VIX - Volatility is likely to continue higher In tandem with our expectations, VIX reached our short-term price target of 30 USD during the FED meeting, constituting a new high. This development hints at a deepening bear market, which foreshadows a more significant spike in volatility over the coming months. We draw this conclusion from a combination of factors. These include fundamental factors on the level of central banks, like higher interest rates and quantitative tightening, and technical factors associated with major stock market indices, all pointing to more weakness ahead. Due to that, we have no reason to change our bullish bias on the volatility index. Accordingly, we stick to our price target of 35 USD; however, we would like to change it from a medium-term price target to a short-term price target.
Please feel free to express your ideas and thoughts in the comment section.
DISCLAIMER: This analysis is not intended to encourage any buying or selling of any particular securities. Furthermore, it should not be a basis for taking any trade action by an individual investor. Therefore, your own due diligence is highly advised before entering a trade.
Volatilityindex
VIX Weekly Forecast Analysis 3-7 Oct 2022 VIX Weekly Forecast Analysis 3-7 Oct 2022
We can see that currently the volatility is around 14.08% for this week, decrising from the 14.3% from the last week.
Currently there is around 35.5% that the asset is going to close either above or below the channel:
TOP 37.72
BOT 28.28
The current volatility percentile is around 15th. With this situations in general the market moves:
AVG weekly bull candle = 12.73%
AVG weekly bear candle = 9.15%
With this mind, from the opening price it would situate us around
TOP 37.2
BOT 29.98
At the same time, due to the nature of the opening price, making this weekly candle a bearish candle, there is currently a
37% that we will break the ath of previous weekly candle of 35, and there is a 60% that we will touch the low of the previous week of 29.4
From the technical analysis point of view:
The majority of moving averages ranging from 10 to 200, are currently around 92% agreement that the market is in a bearish trend ( the current price is above those moving averages)
News that can affect the price of this asset this week:
- Monday 3 October : ISM PMI
- Tuesday 4 October : JOLT Job
- Wednesday 5 October : ADP and ISM release
- Thursday 6 October : Initial Jobless Claims and ECB Report
- Friday 7 October: Nonfarm Payrolls
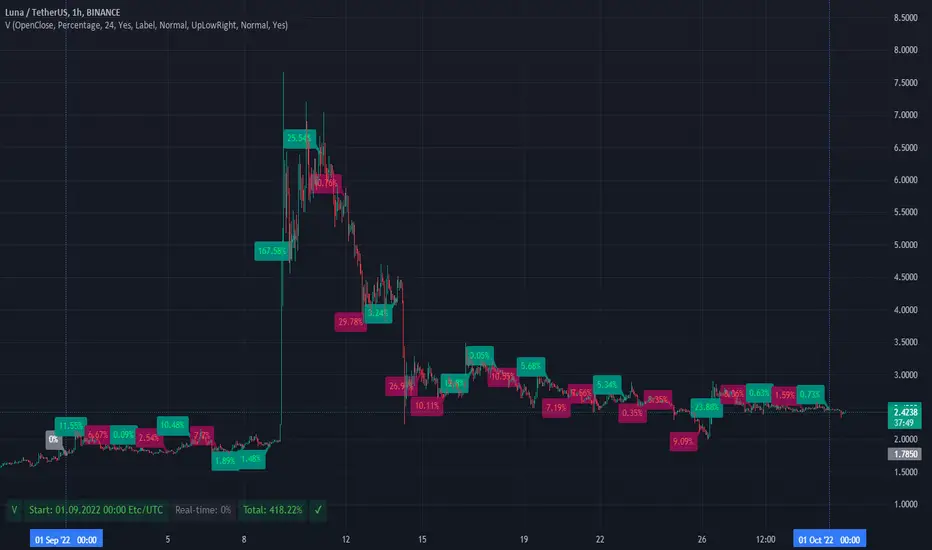
Overview of Cryptocurrency Volatility - September, 2022.Analysis of the volatility index in September on different timeframes.
Currency - US Dollar (Calculated using Tradingview), or analogues of USDT, BUSD.
The selection is carried out according to the lists of cryptocurrencies that are represented on the spot and futures markets, with a total of more than a hundred coins.
Top 15 Coins (1 hour):
1. LUNA - 1237.95% (High&Low: 2727.19%)
2. ANC - 1189.61% (High&Low: 2402.57%)
3. RVN - 931.56% (High&Low: 2068.59%)
4. HNT - 817.05% (High&Low: 1703.06%)
5. REEF - 797.21% (High&Low: 1689.16%)
6. DGB - 764.07% (High&Low: 1977.38%)
7. LDO - 744.15% (High&Low: 1542.13%)
8. TRB - 692.71% (High&Low: 1374.5%)
9. INJ - 687.04% (High&Low: 1349.52%)
10. GAL - 673.92% (High&Low: 1254.45%)
11. STG - 671.25% (High&Low: 1386.23%)
12. IOST - 669.77% (High&Low: 1695.57%)
13. CHZ - 637.55% (High&Low: 1364.21%)
14. OP - 637.49% (High&Low: 1265.55%)
15. ATOM - 632.1% (High&Low: 1346.44%)
The coin showed the worst result: TRX - 243.47% (High&Low: 721.14%)
Top 15 Coins (1 day):
1. LUNA - 418.22% (High&Low: 846.11%)
2. HNT - 273.06% (High&Low: 460.79%)
3. ANC - 263.11% (High&Low: 616.52%)
4. RVN - 252.21% (High&Low: 484.85%)
5. TRB - 182.52% (High&Low: 352.18%)
6. REEF - 177.74% (High&Low: 393.28%)
7. ATOM - 150.09% (High&Low: 304.98%)
8. EOS - 146.22% (High&Low: 275.49%)
9. PEOPLE - 139.43% (High&Low: 271.83%)
10. RSR - 138.75% (High&Low: 290.9%)
11. APE - 135.16% (High&Low: 279.13%)
12. CRV - 131.15% (High&Low: 252.33%)
13. LDO - 129.58% (High&Low: 327.44%)
14. INJ - 129.45% (High&Low: 311.36%)
15. BTS - 129.17% (High&Low: 318.53%)
The coin showed the worst result: TRX - 38.3% (High&Low: 100.3%)
Top 15 Coins (September):
1. XRP - 46.41% (High&Low: 74.98%)
2. REEF - 39.68% (High&Low: 91.92%)
3. LUNA - 38.94% (High&Low: 330.91%)
4. RSR - 31.72% (High&Low: 60.06%)
5. KNC - 31.47% (High&Low: 57.9%)
6. COMP - 31.32% (High&Low: 47.1%)
7. ENS - 28.76% (High&Low: 36.35%)
8. BAL - 24.65% (High&Low: 42.79%)
9. SPELL - 24.18% (High&Low: 39.08%)
10. RVN - 24.16% (High&Low: 172.15%)
11. AUDIO - 23.45% (High&Low: 40.43% )
12. JASMY - 23.44% (High&Low: 47.45%)
13. ALGO - 22.47% (High&Low: 44.75%)
14. GALA - 20.2% (High&Low: 30.32%)
15. CRV - 20.05% (High&Low: 38.37%)
The coin showed the worst result: DENT - 0% (High&Low: 27.77%)
Thanks for your attention!
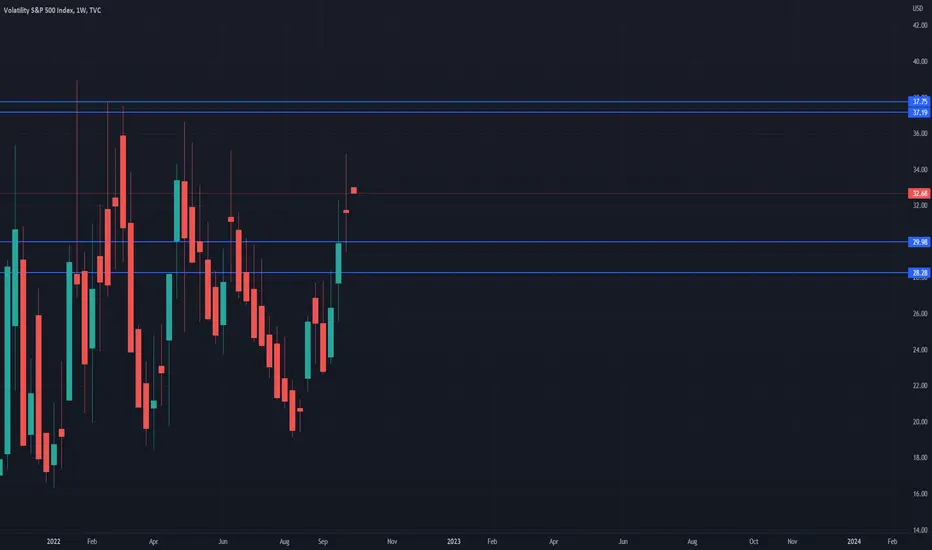
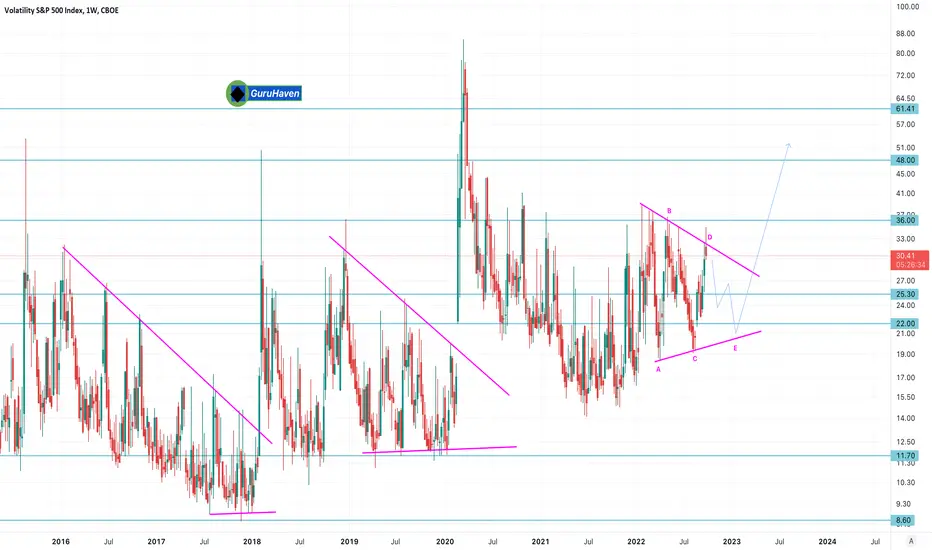
𝗩𝗼𝗹. 𝗨𝗽𝗱𝗮𝘁𝗲: $VIX Weekly. Five-wave patternHas built a triangle (five-wave pattern) over the course of this year. If resistance ~32 continues to hold could see a pullback, which would be bullish for equities
$VXX $SPY $SPX $QQQ $GLD $TLT $TNX $DXY
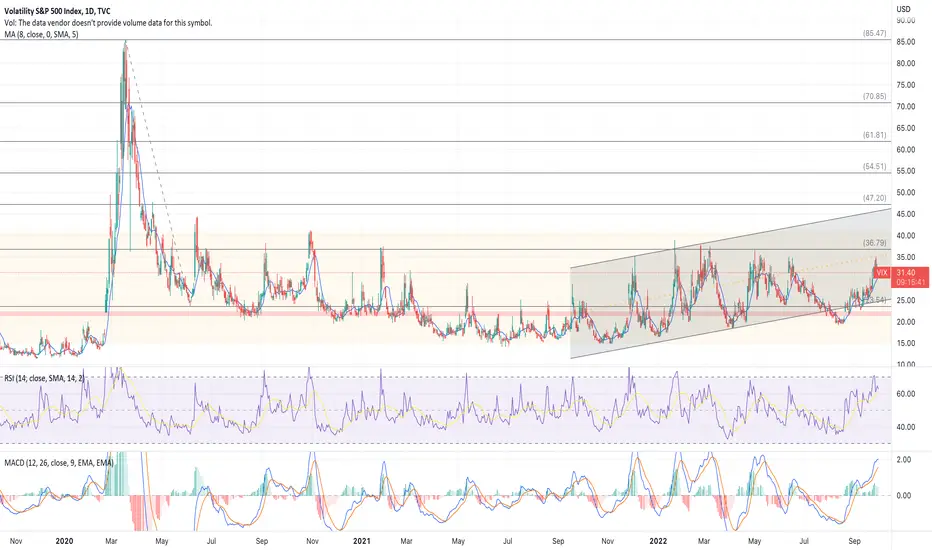
VIX Feels Like a Smoldering Volcano 🌋 Post-2020 Parabolic MoveThe consolidation pattern in the $VIX goes back to June 2020 after the initial COVID flash-crash scenario.
From June '21 to November '21, you started to see a bottoming formation turning into a new uptrend , subtle as might've been. The uptrend has chopped around in this rising channel since the end of 2021 up until the recent false breakdown during August 2022.
This head fake has allowed the $VIX to retake the bottom of the channel and continue up and up after every headline the market fears. Despite the approach of overbought levels, the bear market rally on Wednesday, September 28 gave volatility room to run.
It appears probable a consolidation pattern around 36-38 will level off the relative strength as of late, occurring for the month of October when the market could stage a short-term rally. Coincidentally, this will set up the $VIX right into the midterm elections...
To be clear, sirens won't start popping off on $SPY $QQQ and $DIA until a decisive, sustained move over 36.79 occurs. If that happens, a move to 47.20 seems like a no-brainer.
Notably, that is a test of the top of the rising channel , confirming 2 technical scenarios with the midterm elections as the catalyst for the next leg.
Keep your head on a swivel and keep an eye on the volatility of $VIX $TLT and $DXY for directional signposts in the broader market. Also, it's important to remember Jerome Powell and other Fed officials, Russian tensions, Europe energy or monetary headlines, and CPI could all eliminate this hypothesis.
VIX Feels Like a Smoldering Volcano 🌋 Post-2020 Parabolic MoveThe consolidation pattern in the TVC:VIX VIX goes back to June 2020 after the initial COVID flash-crash scenario.
From June '21 to November '21, you started to see a bottoming formation turning into a new uptrend , subtle as might've been. The uptrend has chopped around in this rising channel since the end of 2021 up until the recent false breakdown during August 2022.
This head fake has allowed the TVC:VIX to retake the bottom of the channel and continue up and up after every headline the market fears. Despite the approach of overbought levels, the bear market rally on Wednesday, September 28 gave volatility room to run.
It appears probable a consolidation pattern around 36-38 will level off the relative strength as of late, occurring for the month of October when the market could stage a short-term rally. Coincidentally, this will set up the TVC:VIX right into the #MidTerms...
To be clear, sirens won't start popping off on AMEX:SPY , NASDAQ:QQQ , and AMEX:DIA until a decisive, sustained move over 36.79 occurs. If that happens, a move to 47.20 seems like a no-brainer.
Notably, that is a test of the top of the rising channel , confirming 2 technical scenarios with the midterm elections as the catalyst for the next leg.
Keep your head on a swivel and keep an eye on volatility of TVC:VIX , NASDAQ:TLT , and TVC:DXY for directional signposts in the broader market. Also, it's important to remember Jerome Powell and other Fed officials, Russian tensions, Europe energy or monetary headlines, and CPI could all eliminate this hypothesis.

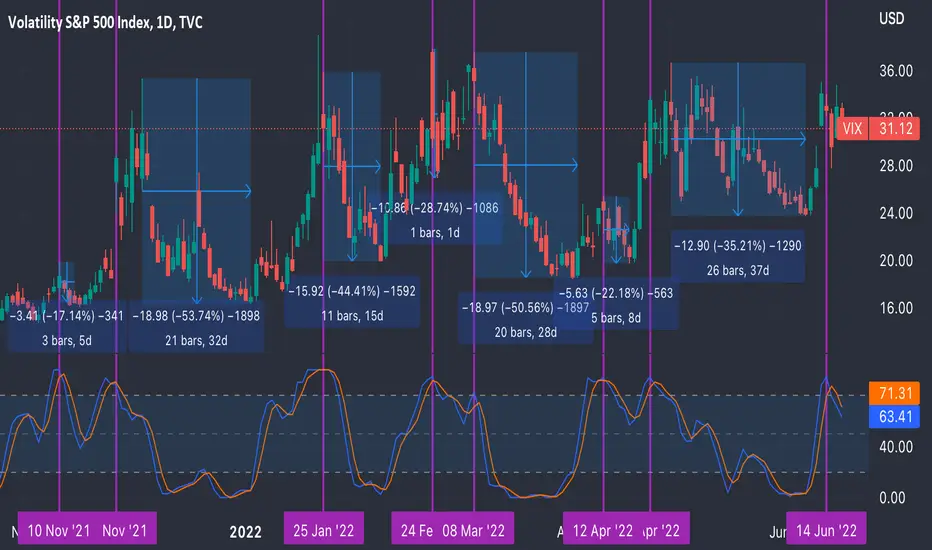
BITCOIN and VIX. Buy/ Sell signals based on the Volatility IndexThis two chart layout depicts Bitcoin (BTCUSD) at the top and the Volatility Index (VIX) at the bottom. A rather simple correlation analysis between the two assets. As you can immediately realize, VIX can give buy signals on BTC (green circles) when the price is High and sell signals (red circles) when it is low.
More specifically we see a clear Higher Lows trend-line and Resistance Zone on VIX. Since Bitcoin's November 2021 market High, every time VIX hit the Higher Lows trend-line, BTC started falling (some days variance), while every time it hit the Resistance Zone, BTC started rising (though rises are rather limited in strength during Bear Cycles). In total we've had 11 such signals since Nov 2021, and only one failed to deliver (May 02 2022).
Yesterday VIX gor rejected just below its Resistance Zone and posted a very strong red 1D candle. It remains to be seen if this very strong correlation will continue to hold and provide another excellent signal, at least on the short-term.
What do you think? Do you agree with this finding? Will the VIX rejection, indicating lower upcoming volatility, cause a rise on Bitcoin? Feel free to let me know in the comments section below!
-------------------------------------------------------------------------------
** Please LIKE 👍, SUBSCRIBE ✅, SHARE 🙌 and COMMENT ✍ if you enjoy this idea! Also share your ideas and charts in the comments section below! This is best way to keep it relevant, support me, keep the content here free and allow the idea to reach as many people as possible. **
-------------------------------------------------------------------------------
You may also TELL ME 🙋♀️🙋♂️ in the comments section which symbol you want me to analyze next and on which time-frame. The one with the most posts will be published tomorrow! 👏🎁
-------------------------------------------------------------------------------
👇 👇 👇 👇 👇 👇
💸💸💸💸💸💸
👇 👇 👇 👇 👇 👇

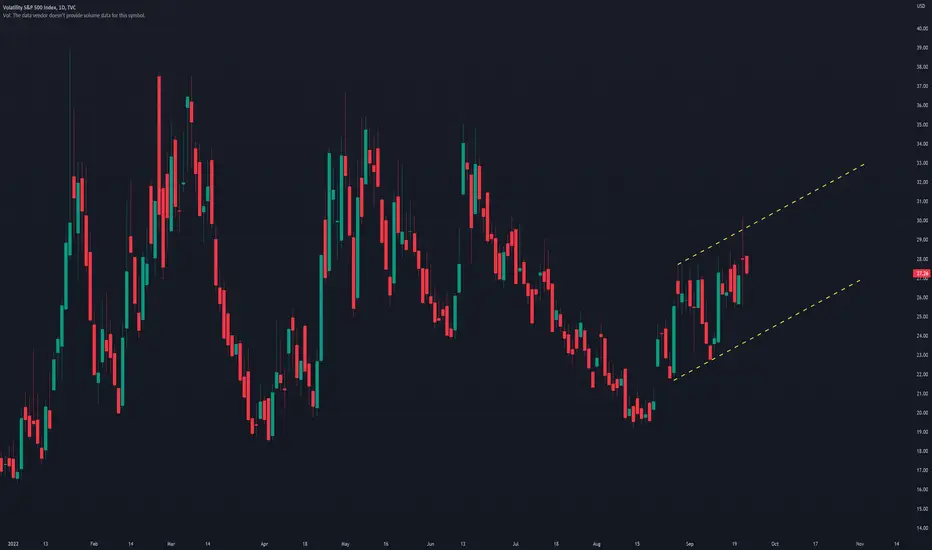
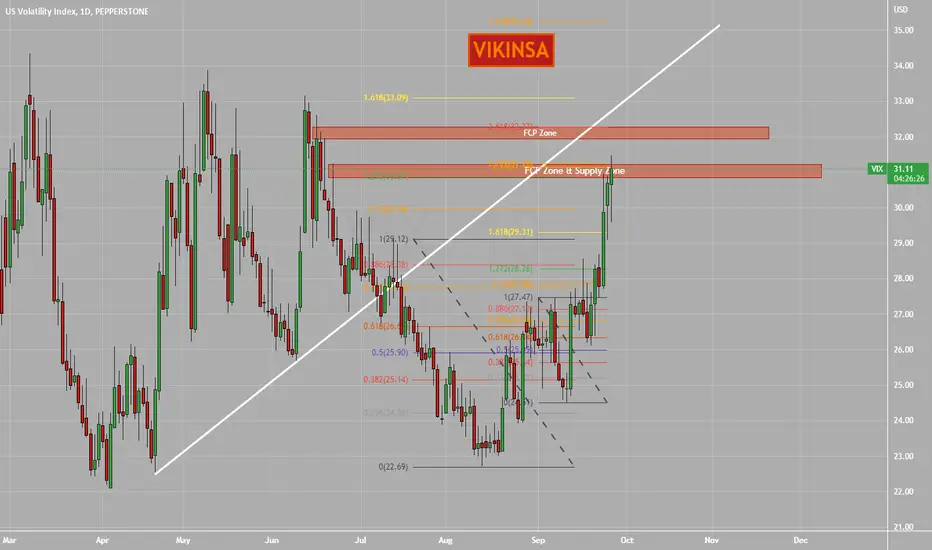
$VIX Has Reached Another FCP Zone - W Pattern Complete #VIXTraders and Investors,
The VIX picked up a lot of strength and violated the bearish flag that was earlier forming. Now it has just completed a W pattern which means that it can take a bit of correction. An extended version of this W pattern places the price in the next FCP zone as well. So although there are chances of it falling down, a little more strength can also push it higher. So watch this carefully along with indices.
Please support this analysis by liking and sharing. 👍🙂
Rules:
1. Never trade too much
2. Never trade without a confirmation
3. Never rely on signals, do your own analysis and research too
✅ If you found this idea useful, hit the like button, subscribe and share it in other trading forums.
✅ Follow me for future ideas, trade set ups and the updates of this analysis
✅ Don't hesitate to share your ideas, comments, opinions and questions.
Take care and trade well
-Vik
____________________________________________________
📌 DISCLAIMER
The content on this analysis is subject to change at any time without notice, and is provided for the sole purpose of education only.
Not a financial advice or signal. Please make your own independent investment decisions.
____________________________________________________
VIX - Volatility is skyrocketingIn early August 2022, we warned that volatility would creep back into the market. Not long enough after that, the market started to sell off, and VIX skyrocketed from 20 USD to over 27 USD. Therefore, we stick to our short-term price target of 30 USD for VIX. However, we want to set a new medium-term price target at 35 USD.
Illustration 1.01
The chart shows a bullish breakout above the resistance and two opening gaps on VIX. All of these developments are immensely bullish for VIX.
Please feel free to express your ideas and thoughts in the comment section.
DISCLAIMER: This analysis is not intended to encourage any buying or selling of any particular securities. Furthermore, it should not be a basis for taking any trade action by an individual investor. Therefore, your own due diligence is highly advised before entering a trade.
VIX - LongWe continue to be bearish on the general stock market and, therefore, bullish on the VIX. Accordingly, we stick to our short-term price target of 30 USD and a medium-term price target of 35 USD. We will pay close attention to the FED meeting on Wednesday as we expect the volatility index to rise further after the meeting.
Please feel free to express your ideas and thoughts in the comment section.
DISCLAIMER: This analysis is not intended to encourage any buying or selling of any particular securities. Furthermore, it should not be a basis for taking any trade action by an individual investor. Therefore, your own due diligence is highly advised before entering a trade.

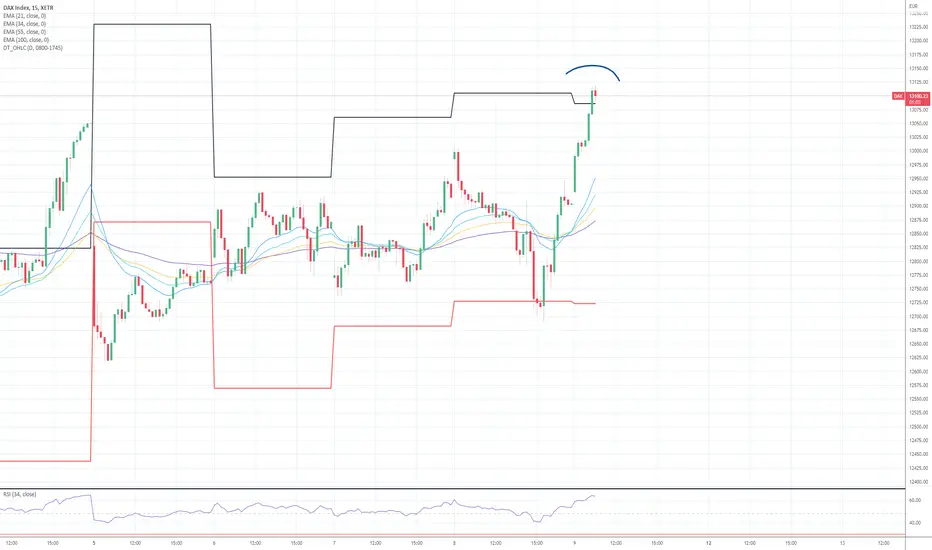
DAX - Bouhmidi-Reversal #DAX - After testing the upper #BouhmidiBands we see directly a push back into the bandwidth.
#volatility

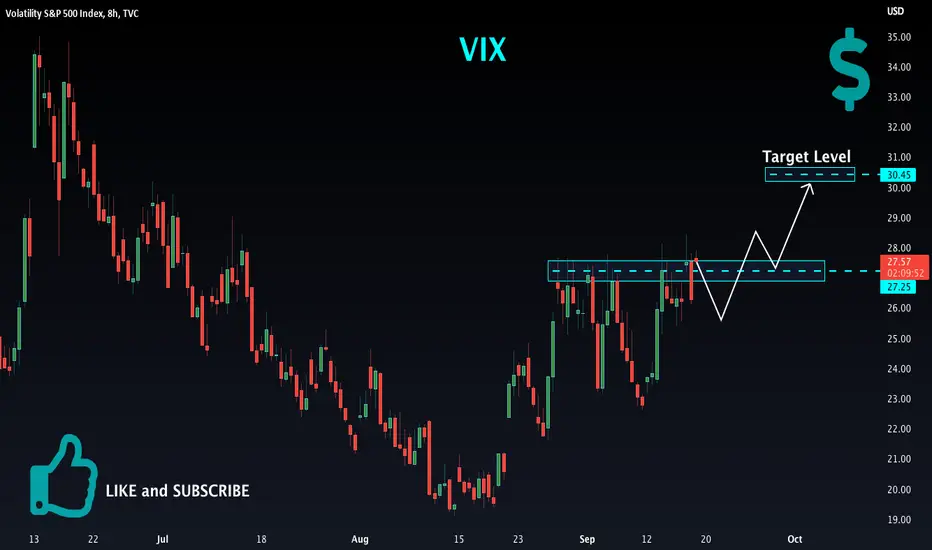
VIX Bullish Bias! Buy!
Hello,Traders!
VIX made a rebound from the support
And is now retesting a local key level
And because I am bullish biased
For fundamental reasons I think
That after we see a bullish breakout
The index will go further up
Buy!
Like, comment and subscribe to boost your trading!
See other ideas below too!
AAPL: Weekly Bullish 5-0 on Apple Inc.Apple after reversing at the PCZ of a Bullish SHark May look to Bullishly Underperform in Bearish price Action and Reverse at the 50-61.8% Retrace if it does reverse wwithin this zone then i would expect it to make atleast an Equal High to the Last High and even may expect to see it hit a 1.618 Extension from the Previous High to Low which if the low lands anywhere between the 50 and 61.8% retrace we should see the 1.618 extension land at around $195-$200

DAX - Bouhmidi-Long Reversal #DAX has already made a nice chartbook #BouhmidiBands reversal long today. Waiting on #WallStreet opening.
#volatility

DAX is testing lower Bouhmidi-Band - Reversal to come...$DAX is testing #BouhmidiBands - We might see a intraday reversal long here at the lower Band today.
#volatility

So Long and Thanks for all the FishI wasn’t able to do much charting and analysis this week.
I'm taking a step back from charting the next few weeks as I finish a project.
I wanted to get this last chart out that I have been working on for historical look at the vix.
Why is the VIX so important?
I would argue that the VIX is the most important indicator in a speculators arsenal.
The vix is important because after a volatility event the vix will do what it does.
Revert to Mean.
To see this phenomenon in action all you have to do is a regression trend of VIX from ~2003 to pre-march 2020 to find the mean for VIX is 15.39
Next add another regression trend line sine the Covid 19 Spike and you will see that it took Oct 25 for the VIX event mean return to historical mean.
So a speculator like me can conclude that the Crash of 2020 has completed its mean reversion.
What was the cost you ask?
To determine that, just extend the regression trend to now to find the current mean and WHAT THE HELL!
A trend line formed from the completion of the mean reversion for covid to today and we see that the VIX Mean overall has now risin to 19.70.
This is huge as a speculator because it gives us a variable to use in our analysis and some assumptions we can make to predicting a trend after an event.
1. When a crisis occurs, the government will step in to correct it with QE in some form.
2. After a large volatility event or even a bear market selloff, we can estimate an amount and time to reversion.
Everyone has questioned why the Fed kept the peddle to the QE meddle.
Well now you know why, to give the markets time to revert to mean.
The bigger the spike, the more QE and/or time it will take to revert to mean.
OK Then. Can the VIX predict a crash?
I think it can and already is pointing to a near term event.
If you compare the 08 GFC you will see 1 important trend of VIX since Jan 07 is a steady increase in volatility until the market eventually crashed.
Unlike the March 2020 event which was spontaneous pop in VIX.
Now you see, since mean reversion completed in Oct 25th, a steady increase in overall market volatility has taken hold.
While the market still mean reverts after a bear leg selloff, that overall mean continues to rise.
So How long before it pops?
While 07-08 rise in volatility prior to its crash gives us some indication an event is imminent, it won’t be the same.
I suspect it will be sooner and larger than anyone expects.
If you look at 07-08s incline, It indicates we are knocking at the doorstep.
It’s why I think VXX stopped issuing in March.
It’s why we get such crazy market rallies in the middle of a “recession” and inverted yields.
Everyone knows there is something wrong, the FED is waving their arms in the air like they just don't care.
OK smart ass, then why won’t the markets crash.
It’s because capital markets of today are much more reflexive than they were in the past.
Since 2018, options began increasing in volume and popularity.
Now, the dealers that sell those options, aka house the risk (or lack of risk) need to dynamically hedge their delta.
When 1 dealer is offside from dealer 2, you can expect they will continuously hedge back and forth until….
They reach mean.
This isn’t an overnight process and takes about 21 days in my estimation and is the VANNA and CHARM effects so prevalent in the markets over the past 2 years.
It’s why there were such predicable dips every 19th during 2021.
It’s why we got a huge bear rally this summer. (Volatility Compression).
It’s why every golden cross has a death cross.
It’s why moving averages provide hints to direction.
OK, OK. This makes sense.
But Why?
Massive amounts of Delta hedging.
I broke down one of the largest hedges wrapped around todays market equities and mapped out the strategies Delta graph.
Delta is simple to understand and once you can visualize negative and positive delta you can extrapolate the zones of volatility.
Once you map those zones to changes in volatility you have a good base to start marking assumptions.
VIX Log Returns moving average.
In the bottom panel I created a log return moving average that can give you a magnitude of movements.
Ranked from 0-10 in increased volatility you can see that covid 19 moved the volatility scale the most in history with a 9.0 in the VIXTER SCALE.
This scale can also move negative to -5
For each spike high there is always an equal push negative to bring volatility back to mean.
With all this knowledge we can form a picture in our mind of a trampoline.
The tension (or reflexivity) in the trampoline are the dealers pulling liquidity to their side. This includes all the hedge funds, market makers, bulls, bears, prop traders, theta gang, tsla gang, retail, institutions, etc are all pulling the trampoline tighter to their side.
Each economical decision or crisis is going to launch VIX that much higher.
That is until the trampoline breaks under the pressure.
The FED saved banks and corporations after Covid with Stimulus, not the checks you got in the mail (those take time to trickle down to corporations), but the debt they were buying and adding to their balance sheet.
That is a massive 9 Trillion dollars.
That gave our trampoline the added support it needed to recover.
What happens now when the FED puts that 9 Trillion in assets back into the market.
The tension grows until the next crisis or event launches it to 10.
Then it's...
So long and thanks for all the Fish.

DAX: Bouhmidi-BreakoutAfter hitting 13.000k - we have broken as well the upper Bouhmidi-Band. We might see a reversal like yesterday
$VIX Is In The Zone, Can Take A CorrectionTraders, $VIX Is In The Zone, Can Take A Correction. Watch $DXY too with it. If these 2 fall, we are looking at some relief in indices (Dow Jones, SnP500 and NASDAQ)
Rules:
1. Never trade too much
2. Never trade without a confirmation
3. Never rely on signals, do your own analysis and research too
✅ If you found this idea useful, hit the like button, subscribe and share it in other trading forums.
✅ Follow me for future ideas, trade set ups and the updates of this analysis
✅ Don't hesitate to share your ideas, comments, opinions and questions.
Take care and trade well
-Vik
____________________________________________________
📌 DISCLAIMER
The content on this analysis is subject to change at any time without notice, and is provided for the sole purpose of education only.
Not a financial advice or signal. Please make your own independent investment decisions.
____________________________________________________

DAX - Wonderful Bouhmidi-Reversal After testing 12.800 points DAX found first support at lower Bouhmidi-Band

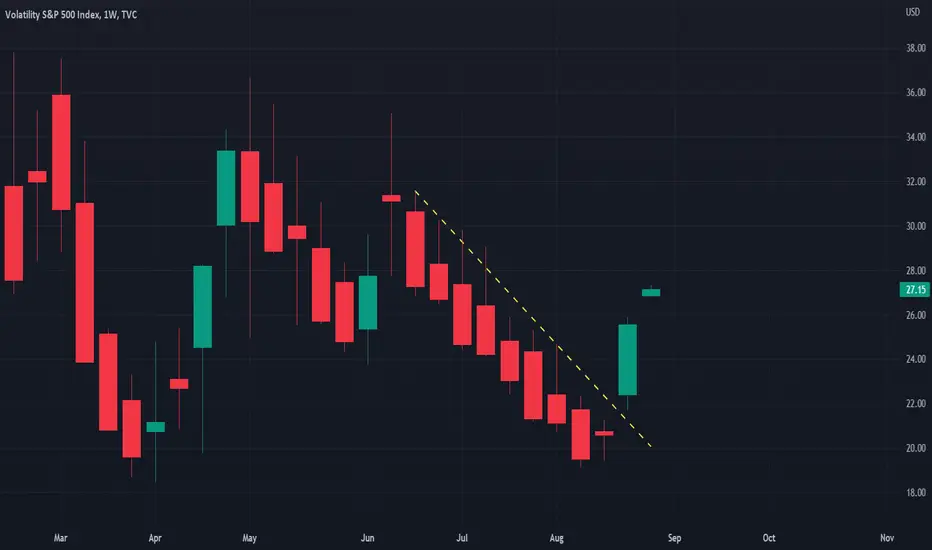
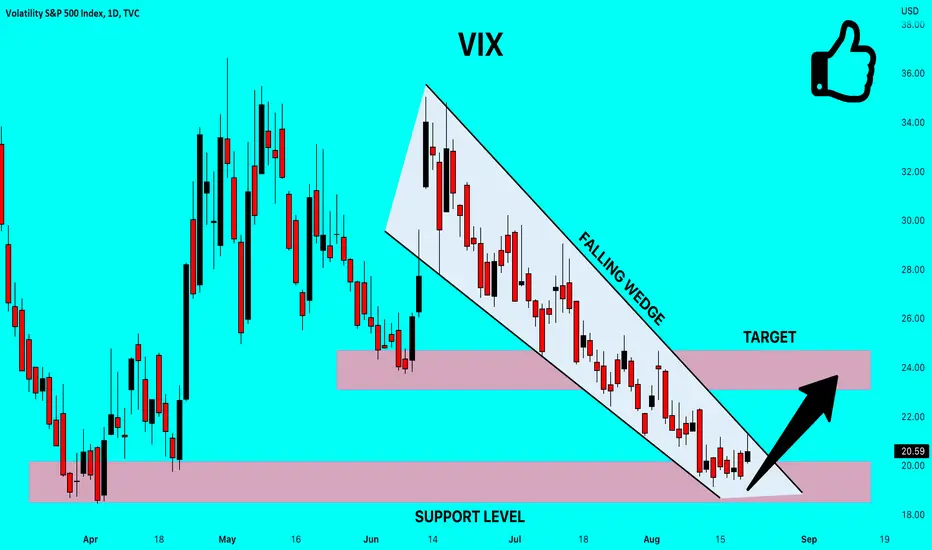
✅VIX POTENTIAL LONG🚀
✅VIX retested the strong support level
After trading in a local downtrend from some time
Which makes a bullish rebound a likely scenario
With the target being a local resistance above
LONG🚀
✅Like and subscribe to never miss a new idea!✅
VIX Spike in Progress - 8/15/2022Spot VIX. Daily view.
The VIX is beginning to behave like it did in 2020-2021. A bullish RSI divergence is beginning to form. The RSI is trending slightly higher while the VIX is trending down. Usually, this is the first step to a VIX spike to form. That doesn't mean a large VIX spike might happen tomorrow. Usually, this pattern takes several days to resolve.
I say first step because the VIX has a certain "dance" to it. The next step is for the VIX to create higher lows. Usually, 3-5 higher lows would create the bigger spike.
The reason why the VIX floated for most of 2022 is due to the market that it reflects. The VIX calculates the amount of hedges in the options market of SPX/ES or equivalent. Simply put, when cash is in demand or futures are used as hedges, that means hedges in options are not being bought up. When there are less options bought as hedges, this mutes the VIX spike. This type of floating action happened in most of 2008, 2015, and 2018. So, it's actually nothing new.
However, as the DX (dollar strength) goes down, it means that there is less demand for cash... which means more money is flowing into derivatives.
The red line that I have served me well for VIX shorts. However, I have this red line expiring around September/October which is just in time.
What I am looking for is an oversized VIX spike. What do I mean by that? I mean if the VIX spikes more than 3 standard deviations, but the SPX/ES didn't drop as much (e.g. only 7%).
Why is that? It will likely mean the bear market in ES/SPX would be over. It means cash is not in hot demand as it was between January to July. Cash doesn't disappear out of thin air. It goes somewhere else.
If I am reading this pattern right, then we should see a spike in September. There is a possibility of near the end of August. However, it's still too early to tell. I rather be patient and let the market tell me what to do. Those who keep telling the market what to do usually do not last very long.

$VIX has peaked or is close to its peak.Since November 10th, the Stoch RSI topping out has been a reliable indicator that a short-term top is in or very close to being in (a few trading days away) and a precipitous fall is to follow.
The indicator has been right 7/7 of the last time. I believe the trend will continue and go 8/8.