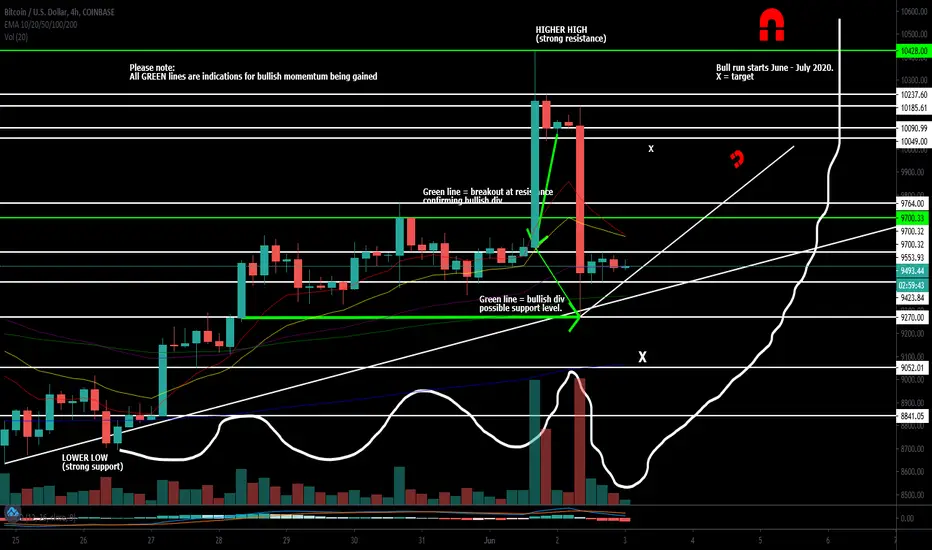
4 HR BULL DIVERGENCE NEXT 12-24 HOURS 9700 TURNS SUPPORT?????Currently been in the works of planning and creating my potential long term trading position for #BTC. After doing numerous technical analysis throughout the last 2 months I've came to the conclusion we've slowly been transitioning from the 2 year downtrend (we just broke resistance at 10k) but then that death candle appeared out of nowhere. That was a stop hunt in my opinion and nothing but attracting more liquidy to the market to create stronger momentum for a bullish divergence to in fact play out. We've now tested the 10k resistance level 3 different times and have wicked above it another I believe. December 4th 2017 is when we peaked at the price of $20,154. It wasn't until June of 2019 where we decided to take another shot at the big 10k resistance level. We have VERY strong support at 9494. thus being said, we've been consilidating and in the 9k region for some time now and ranging above 8500 since April (it's now June so 3 months) and the last week have found support in the 9400 region. Even after the massive red candle today the bulls have recovered and showed they're serious about potentially planning a big move either this month or maybe July. Anything is possible but this is just my thought process and everything going on in my mind when making decisions for my position I've entered. Thinking with logical and rational and seeing things for how they are is very important especially for such a high risk asset like BITCOIN (thats what i find so interesting about it). This whole Technical Analysis I've done tonight has showed me it might be time to spook bears on a regular bias. BTC loves to thrive off evil situations and 2020 is a perfect time to breakout of the 2 year downtrend. June could be the start to BTC history in the next 1-30 years.
Volume Indicator
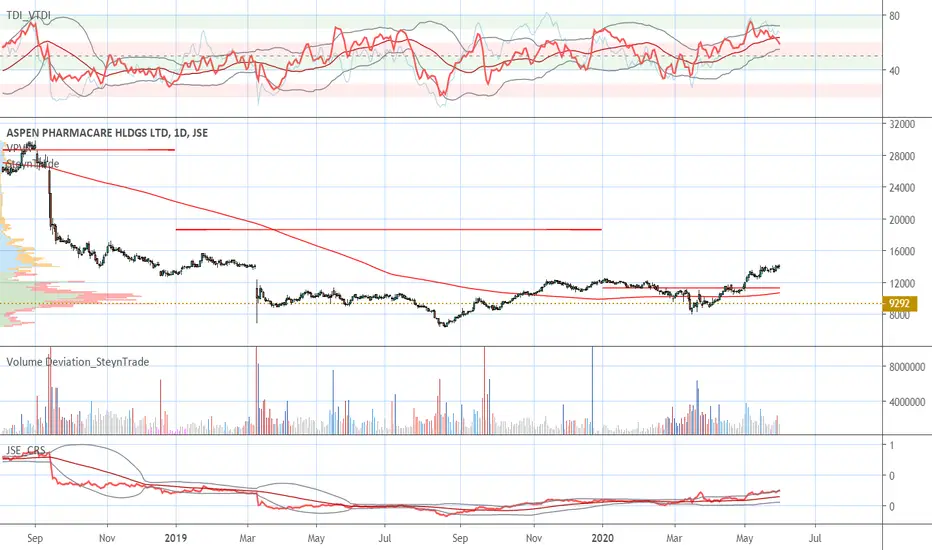
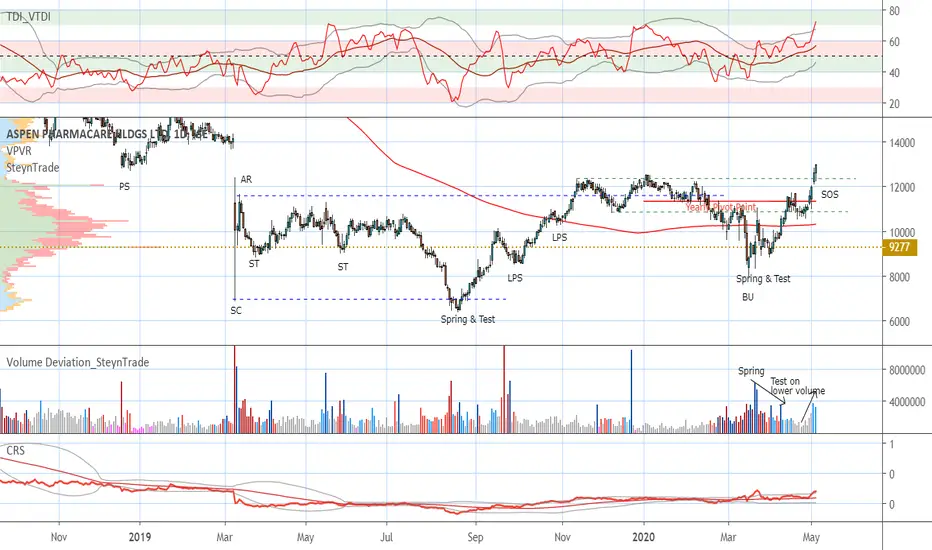
JSE:APN Aspen at Important PointAspen is at an important decision point. It is a level of previous volume at R140 where selling occurred. We have been following the stock signs of strength (see posts below). The relative strength is good and volume is increasing as price increases. However, the volume push is declining. The stock still looks strong but we may see a pause at this level. However, a clean break could result in a quick move higher.
JSE:SOL Sasol Time to Close the Gap?The market volume has been low but it could be time for some action. We have been following the bounce in Sasol since the selling climax (see the posts below). We have now are again pushing the level formed by the gap. The previous attempt has been overcome. Volume is higher during increases and lowers during on decreases. There is negative divergence on the volume RSI also indicating a continuation. Let's see what the week brings.

Facebook Stock is for Buy nowThere are several buy signals with a relatively high volume showing a good opportunity to buy this stock

XTZUSDT Macro Levels| Declining Volume|.618 Fibonacci ResistanceEvening Traders,
Today’s Technical Analysis – XTZUSDT – a break out is imminent as volume continues to decline; key structural levels are likely to be tested.
Points to consider,
- Trend bullish (consecutive higher lows)
- Trend line support holding true
- Current resistance .618 Fibonacci
- RSI above 50
- Stochastics projecting down
- Declining volume
XTZUSDT’s trend has been putting in consecutive higher lows, now trading in a range between two important levels, monthly resistance and daily support.
The current trend line support is holding true, a higher low projection will be at play until the trend line has been breached.
Immediate resistance, the .618 Fibonacci is to be breached for a test of monthly resistance; price has been rejected multiple times.
The RSI breaking below 50 will negate any bullish bias in the market. The stochastics are projecting down, this a sign of momentum shifting.
XTZUSDT’s volume is clearly declining, an indication of an influx in volume being imminent as key structural levels get tested.
Overall, in my opinion, XTZUSDT is approaching a key technical level where a break will be imminent. A long trade will be valid above monthly resistance. Breaking below daily support will validate a short trade.
The break needs to be backed with increasing volume; this will help avoid fake outs.
What are your thoughts?
Please leave a like and comment,
And remember,
“This lack of support is not simply an absence of encouragement. It can be as deep as the outright denial of some particular way in which we want to express ourselves.”
― Mark Douglas

BTCUSD Breakout Trade|Watch Price Action| Apex| Low Volume Evening Traders,
Today’s Technical Analysis – BTCUSD – a breakout is imminent as support and resistances converge.
Points to consider,
- $10,000 Psychological Resistance
- Up sloping support
- Declining volume (Apex)
- Range Median
- RSI above 50
- Stochastics equilibrium
BTCUSD’s current price is above its range median, .50, currently trading under the all important $10,000 Psychological resistance. BTCUSD is respecting its up sloping support; price is being pushed into its apex where a break will occur.
The RSI is above 50, indication of a bullish bias in the market, however NOT confirmed, we need further development.
Stochastics is coiling in equilibrium; momentum for the break is stored in both directions.
BTCUSD volume nodes are declining, an indication of an influx being imminent, this will be more likely when price breaks either key technical level, the $10,000 Psychological resistance and or up sloping support.
Overall, in my opinion, BTCUSD will have a break in the coming hours; a trade will be validated upon the direction of the break. It is important to monitor price action and volume leading up to the break as this will help avoid fake outs.
What are your thoughts?
Join me on twitter for live market updates!
And remember,
“Remember our definition of a winning attitude: a positive expectation of your efforts with an acceptance that whatever results you get are a perfect reflection of your level of development and what you need to learn to do better.”
― Mark Douglas

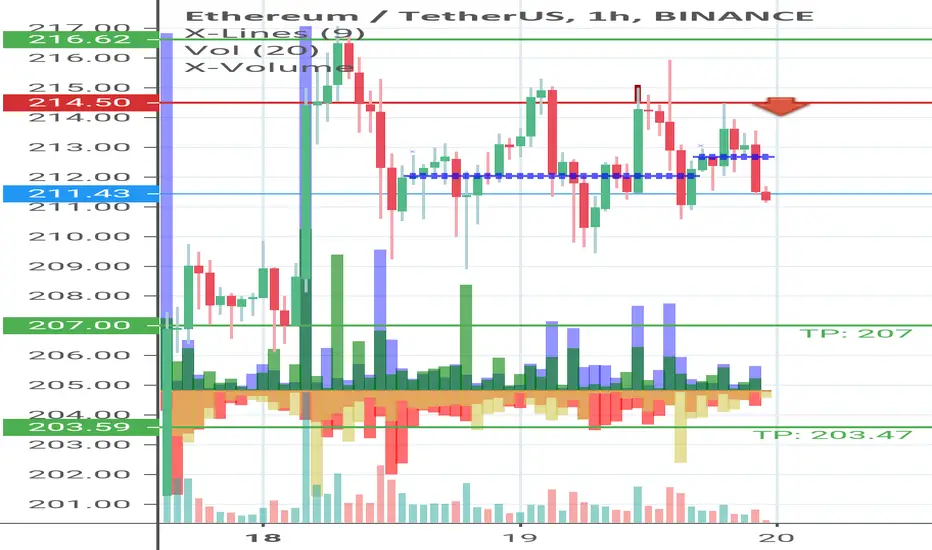
ETHUSDT, short now. Market revers to 207.Hi, everyone. You know market very plastic thing and everything changes with time. For now there's short after revers (bulls closed and then sold by bigger price but for this time by market makers). Short to 207.
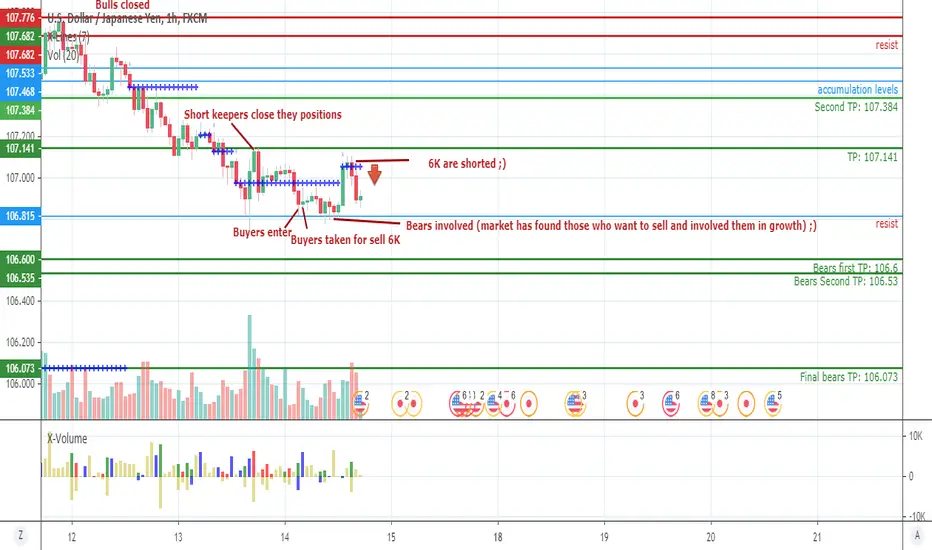
USDJPY, strong short to 106.073. Big volume for short created.Hi, friends. I just deeply analysed USDJPY, very good specularity there.. ) Market maker do big volume for selling now. We go down to 106.073.
Levels thanks to X-Lines indicator. Volume analysis - X-Volume.
Waiting for your likes!
JSE:HAR Harmony Lagging in a Strong SectorHarmony is being pulled higher by the sector. However, there has been a significant volume in the stock indicating buying even though it may be lagging gold stock to be bought. With gold on the move, it could be time for Harmony to follow higher.

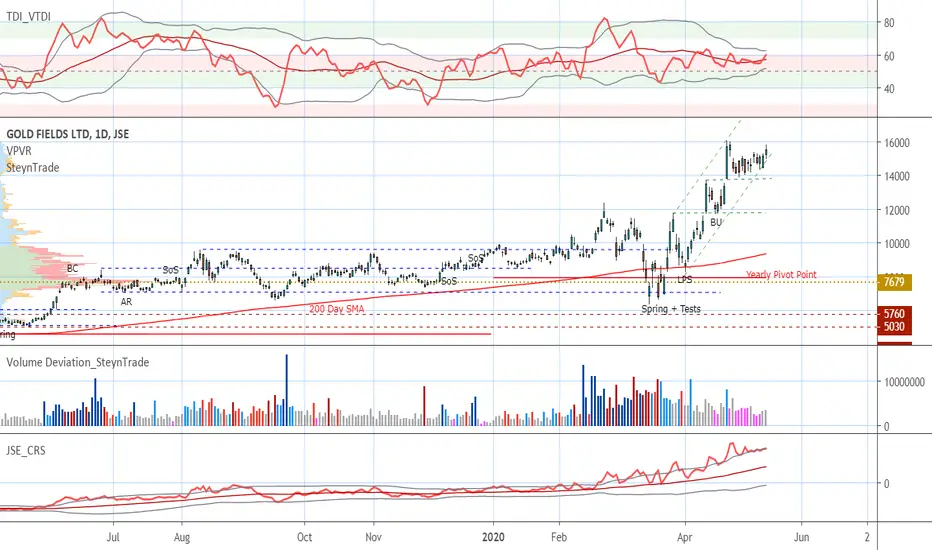
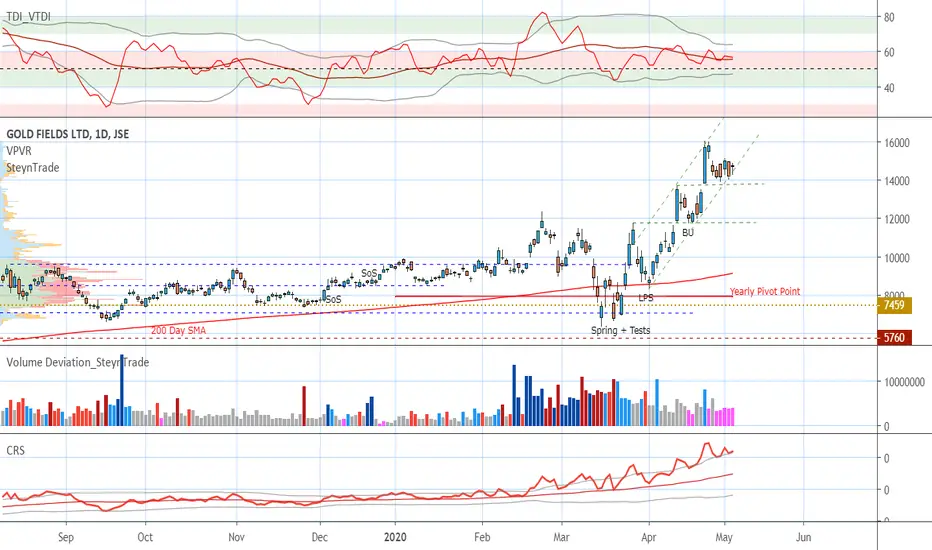
JSE:GFI Gold Fields Pushing HigherGold is very strong. After a week pullback, we are now seeing price breaking higher.
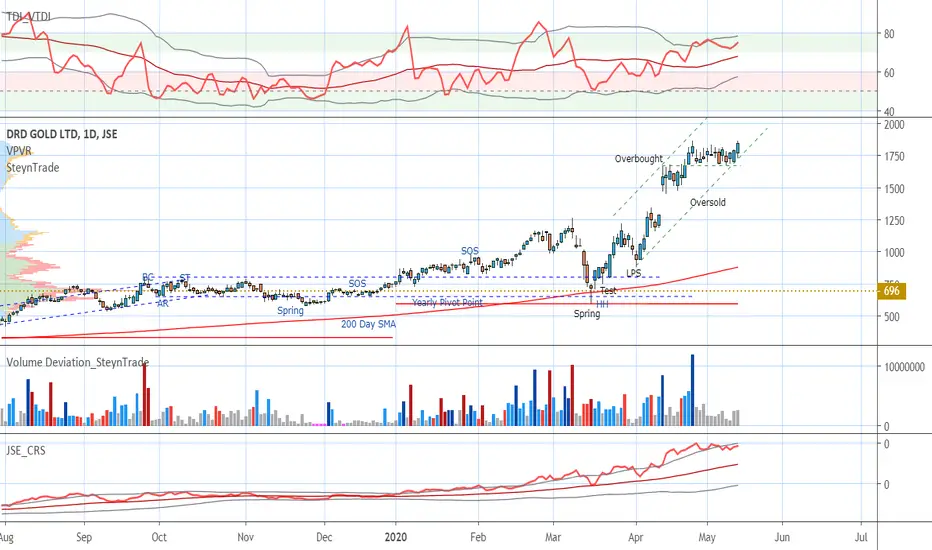
JSE:DRD DRD Gold testing new highsAll the gold stocks have shown a week pullback attempt and has reached oversold conditions. Time for the markup to continue.
JSE:ANG Anglogold Next move startingThere has been some volume buying into the close today. Price has reached the oversold line and was unable to break below the previous trading range. The volume could indicate the start of the next move.

JSE:APN Aspen Ready for MarkupAfter a break the trading range and a pullback on declining volume, we are now looking for a markup to start.

JSE:CPI Capitec Looking for Test of the lowsAfter the selling climax (SC), we have seen an automatic rally (AR) and another attempt to move higher on an upthrust (UT). Now are looking for a test of the lows as part of the trading range that has formed with the SC low and AR defining the boundaries.

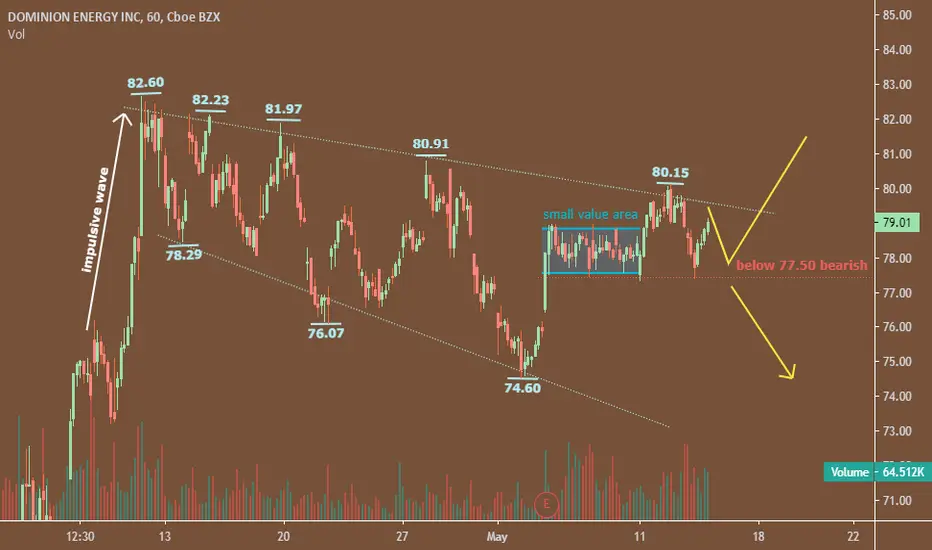
Demand of Dominion Energy....!Buyers are active in the current price, and if the volume increase the price will break the resistance level and go beyond the resistance.
If the prices come lower level and breaks 77.50 level it is predicted that it will move do down direction.
----4 hour chart----
In 4 hour time frame price is creating a value area,
if The buyers are more active then the sellers, price will break the value area and it will go up-direction. And if not the price will continue its move zig-zag formation.
JSE:VOD Vodacom Showing StrengthAfter a trading range starting in mid-2018 Vodacom has had a spring-like action during the market downturn. The comparative relative strength was outperforming while other stocks were falling. There was a pause at the yearly pivot point and 200 day MA but the price was unable to push below the trading range again. Today we have seen a significant bar with some volume. Now we watch if the upper boundary of the trading range will hold or if a markup could start. We could see some consolidation before or after the break before the markup starts. Will watch how this progresses.

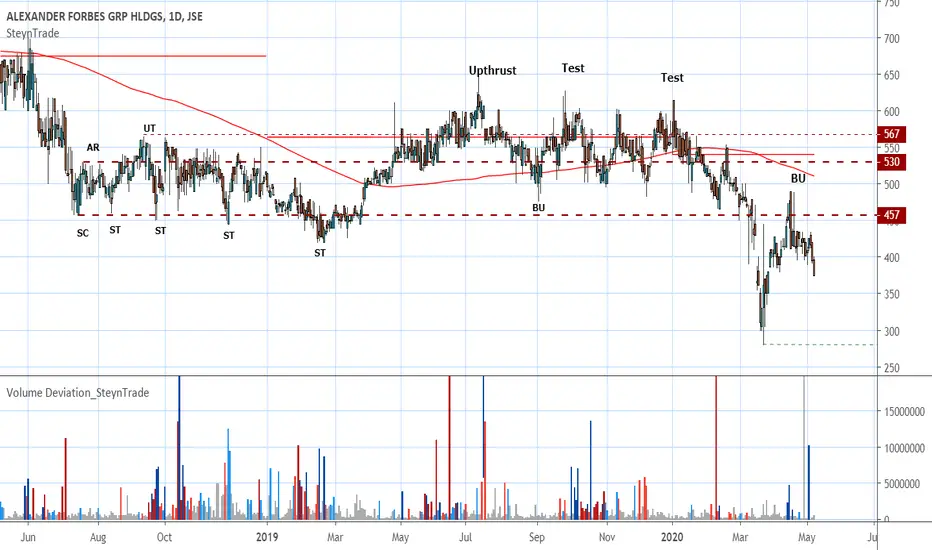
JSE:AFH Alexander Forbes Looking for a Test of the LowsAfter a trading range starting in July 2018, Alexander Forbes has been in a trading range. After an upthrust and tests forming lower lows price broke below the trading range. We have now seen a backup to the trading range and now a push lower again. We can expect the lows R2,80 to be tested again. If this is broken there could be more downside.
USDCAD, stable long to 1.4194, 1.4247.Hi, friends. What we have on usdcad chart window. Bulls still opening newly contracts and bears involved on correction. Target for bulls: 1.4194, 1.4247.
Levels thanks to X-Lines script. Volume analysis - X-Volume script.
Waiting your likes!

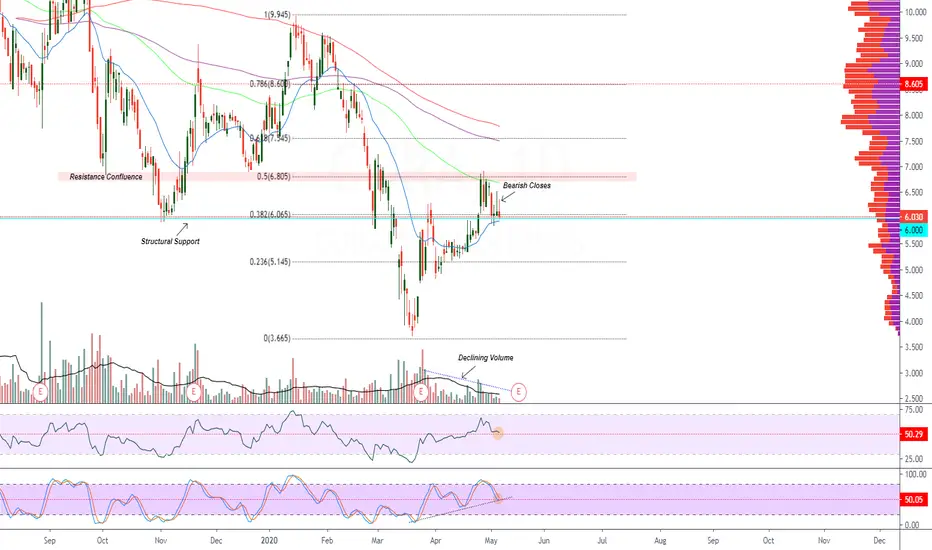
CURA Structural Support| Resistance Confluence| Declining VolumeEvening Traders,
Today’s Technical Analysis – CURA – holding a key support with the current volume clearly declining, a move will be imminent with a subsequent influx.
Points to consider,
- Macro trend bearish
- Resistance confluence
- Structural support being tested
- RSI above 50
- Stochastics projected down
- Declining volume
CURA’s overall trend is bearish with consecutive lower highs, currently recovering from oversold conditions that needs momentum follow through.
There is resistance confluence with the .50 Fibonacci and the 100 EMA; price needs to trade above it to establish a higher high for the local trend to remain true.
Structural support is being tested; current candle closes have been bearish, indicating weakness in the bulls.
The RSI is trading above 50, likely to break if current support does not hold. The stochastics on the other hand is at a key level, if the higher low projection does not hold, the sell cross will increase momentum to the downside.
Volume is declining; technically this leads to an influx at key trade locations.
Overall, in my opinion, CURA needs to hold structural support for a probable higher low. With the declining volume at support, this is an indication of an impulsive move. If support breaks then the macro trend is still intact.
What are your thoughts?
Please leave a like and comment,
And remember,
“Ultimately, consistent profitability comes down to choosing between the discomforts you feel when you follow your plan and the urge to let yourself be captures ( and ruled) by your emotions.” ― Yvan Byeajee
JSE:APN Aspen Breaking OutAspen has been showing strength but after a spring and signs of strength (SOS) price is now breaking out.
JSE:HAR Harmony Spring?Harmony has had a large pullback but if we look at a lower timeframe we have a possible spring forming. Volume has increased as price reached the previous breakout level. There are better gold stocks to consider but it looks like even Harmony could take the next step up.

JSE:GFI Gold Fields MarkupFollowing the trend in all gold stocks, Gold Fields has had a week pullback attempt and is now ready for the markup to continue of the oversold line.
JSE:DRD DRD Gold Markup ContinuesUsing the Wyckoff reverse use of trendlines it is possible that we have reached the oversold line. We are now looking for some (not necessary to be a lot) volume to trigger the next step up.
