$BRQS Cup and Handle Went long BRQS nice cup and handle with volume and breakout here with first target .4 to scale out
Volume Indicator

Volume of trade enterThe volume of trading in relation to your capital play an important role in emotional liabilities such greed and fear.
Greed let you execute large volume with high risk
Fear let you out of the market even when you have a clear setup and edge.
The low volume of trading plan play an important role in attenuation of greed and fear gradually.
With time you will find yourself a good player in the money game.
The low volume of your trading master your plan ,execution and psychology.
It help you how make money with low risk and high profit and how to catch the trend from the beginning.
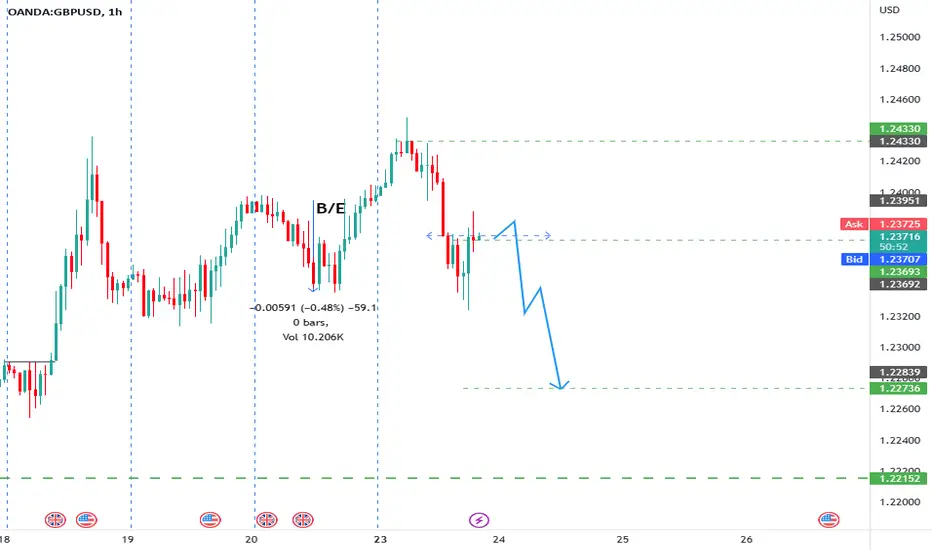
GBP/USD SELL OPPWe have a POSSIBLE SELL
Take profit @ 1.22742
Still holding our initial trade for 1.22150
High Volume Stops Price MovementThe great dilemma - how does volume effect price? Volume is a war between supply and demand. Many believe price is pushed by high volume. I am suggesting that high volume stops the current movement. Newton’s First Law of Motion in effect.

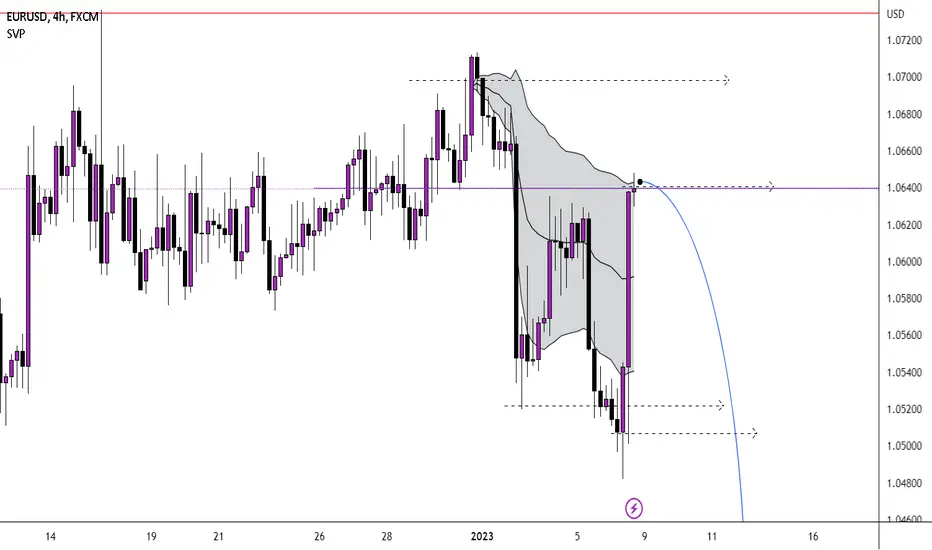
EURUSD ShortsDaily is still bearish decent retracement. In theory VWAP should hold put stops just above daily highs and it should be good
ETHUSD shortsSaid all i needed to say on the video if you liked it dont forget to press that rocketship looking thing


Short Tesla for the next 5 days!We just saw the gap get filled at $123 as I said would happen and that was the short entry to $110 for some fast and furious money! I’m shorting Tesla with 50x leverage from $123.01 to $110.02. From there I will take profit and renter maybe $1112-113 for the ride down to $93. On the swing trade for 2-6 months I see a target of $66. I’ll post another macro chart with Fibonacci points of intrest for this no brainer. Once Elon sold 3 and 1/2 billion of his own stock I knew Tesla was going under $100. Buy zone is $66-46

$TSLA volume gapsIf $TSLA doesn't start bouncing soon, there are some massive volume gaps that can fill up quickly. Reminds me of $AMD...

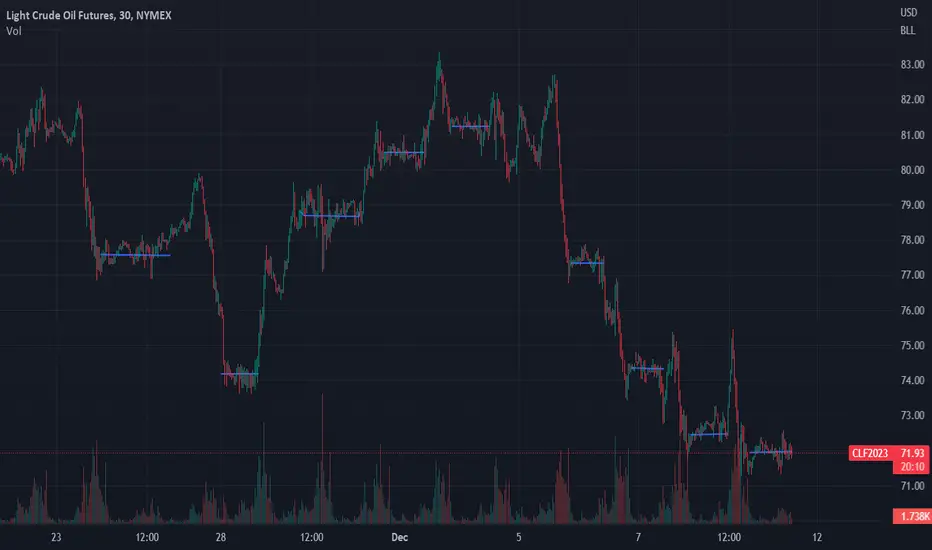
Heart beat of the market - VolumeWas reminded today about the volume indicator, and thought this was in interesting pattern in Oil. The price very much likes to be range bound and channel sideways during the low volume periods, offering opportunity to trade as it breaks out up or down. The 30 min chart on Oil really shows the volume spikes early-mid day and they look alot like a heart monitor to me... Have fun folks! Do your research, trade at your own risk. :) Please feel free to comment, always open for discussion!
Bull Bear Power Void - With trending background
To get this indicator on your charts (remove the old one from your favs and your chart if you have it already)
otherwise just go to this link and add it
Welcome to the coffee shop everybody in this video I am discussing the new changes to the bullet bear power void. There have been some changes to the coding because I did see your messages discussing that it was difficult to see the trend ribbon in the background so now you have an entire background that adjusts its color depending on whether the trend is positive or negative or if there is no trend.
go ahead and watch the video for the results on that one hand I also took the time to show you guys how to see a Divergence in your volume up against your price.
along with that you can also see when you should and should not re-enter the market for a continuation trade.
Black background means there is no volume or that profits are being taken off the table.
Red background means that the volume is trending bearish.
Green background means that volume is trending bullish.
One way to spot a Divergence or a slowing down in the trend is when your volume column brakes outside the void at the same time you get an equal color background, Look at the height of that volume candle and compare it to the last time that you got a similar color background with a column breaking outside the void.
If your volume Is closer to the void it was in the previous one, then you do not enter this as a continuation trade.
If you are trading bullish then your new re-entry has to have more volume than your last re-entry.
If you are trading bearish then your new volume has to be lower than your previous volume

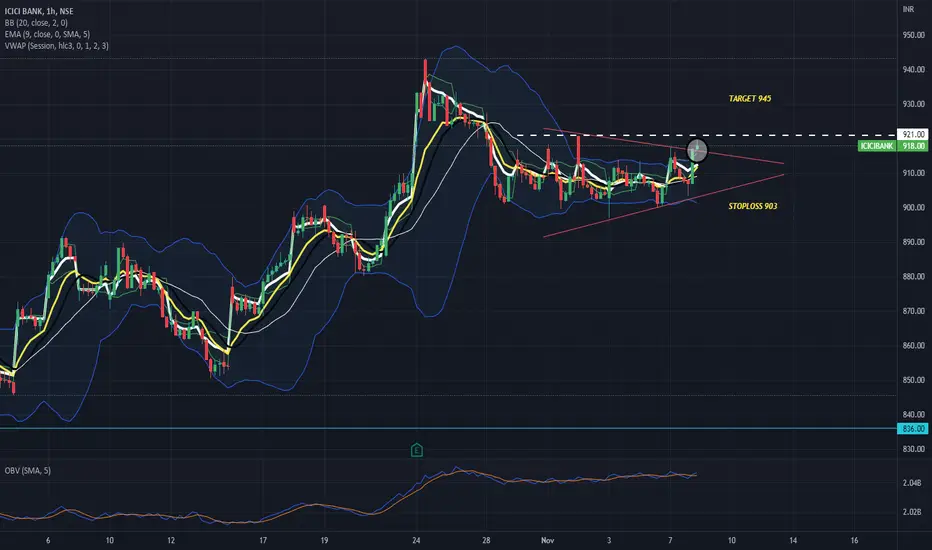
ICICIBANKICICIBANK made broke out of triangle pattern on an hourly chart with good volumes & sustained above beakout.
Could be bought with mentioned stoploss & target

Institution are present here! Look at repeated volume incoming!I have too much reason that will tell us for a nice Long position at this area....

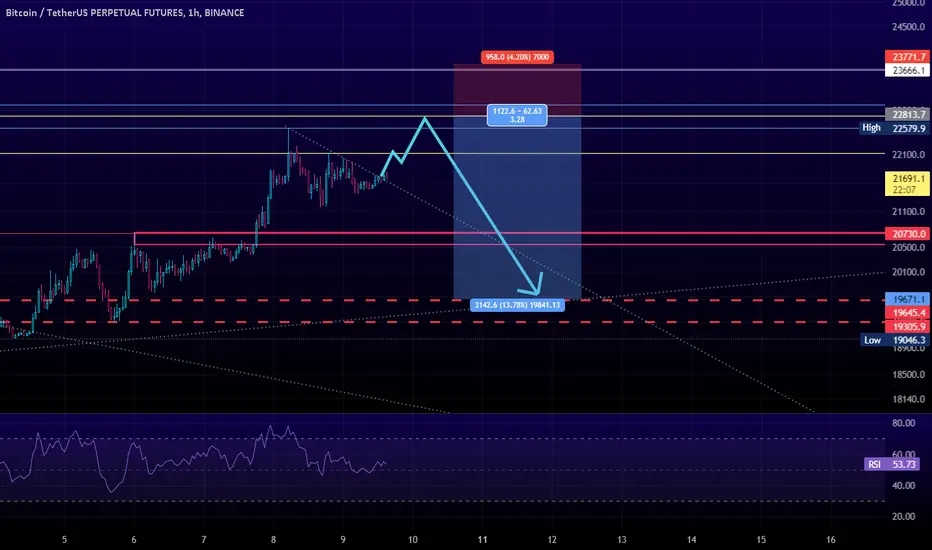
btcusdtperpHello to all ,
In my opinion, this move is likely to happen
If it is useful for you, please like it
BTCUSDT Showing High Volumes in Weekly Time FrameIf you take a glance at BTCUSDT on weekly time frame along the Volume chart and compare areas having high volumes, some historical pattern shows up !
Usually the volume rush has been followed by huge price upward movements as you can see in the red boxes. This type of occasion has been happening again since last 2 months. To check the stats and probabilities, 5 Out of 6 volumes rushes in BTCUSDT weekly history has led into higher prices.
Currently the market has registered 4th and 5th biggest volumes of all time within the last 8 weeks indicating a high potential of price rally and to be exact with the probabilities, the chance of price rally is 5/6 or something about 83% !
The other interesting thing about volume analysis of the weekly BTCUSDT chart is the section covered by purple box, ATH has been registered in that time but the volume was in its lowest values meaning that the majority of market had found these prices extraordinary and illogical and was not willing to buy BTC at those prices which enforced a trend reversal and lower prices; although, the majority of market have found current prices logical and are buying BTC at this price heavily as the volume chart indicates and this huge volume foretells some huge upward movement.

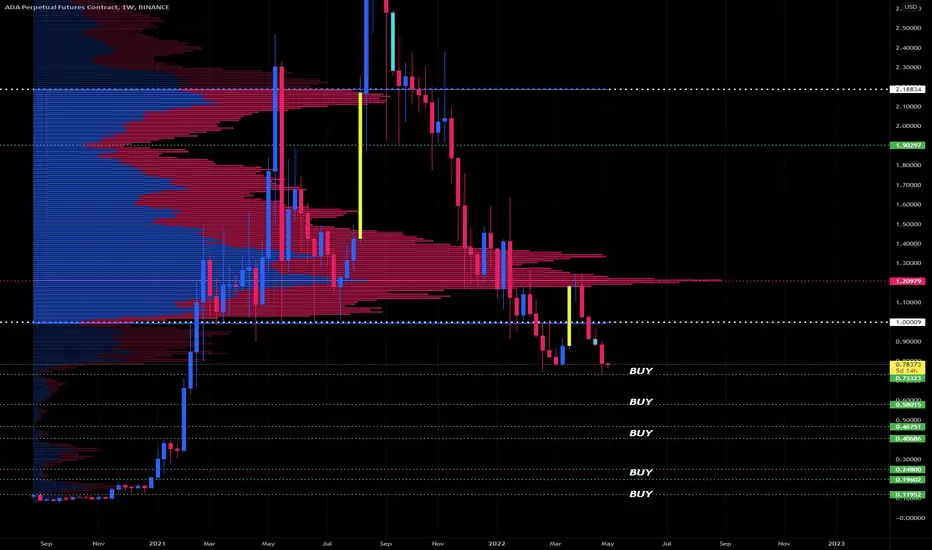
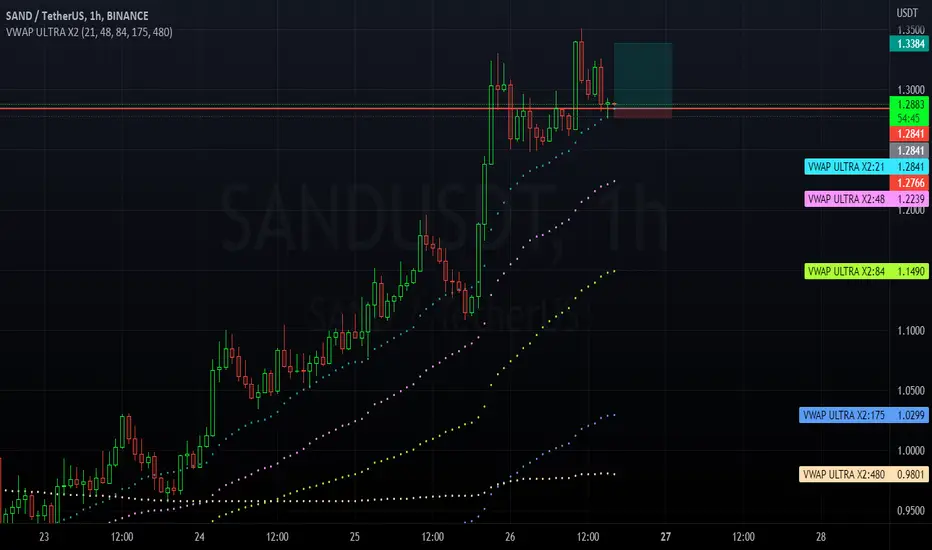
Sandbox / SANDUSDT - VIP PASSBUY !
We analyze the reason (the volume ) and not the result (the price)
We rely on monitoring the entry and exit of systems that control a large amount of money.
$BNB - Weekly Volume - What to expect?Last week the weekly volume was pretty bearish, this week not sure as BNB is showing quite some support at these levels. Do you think it will go down?

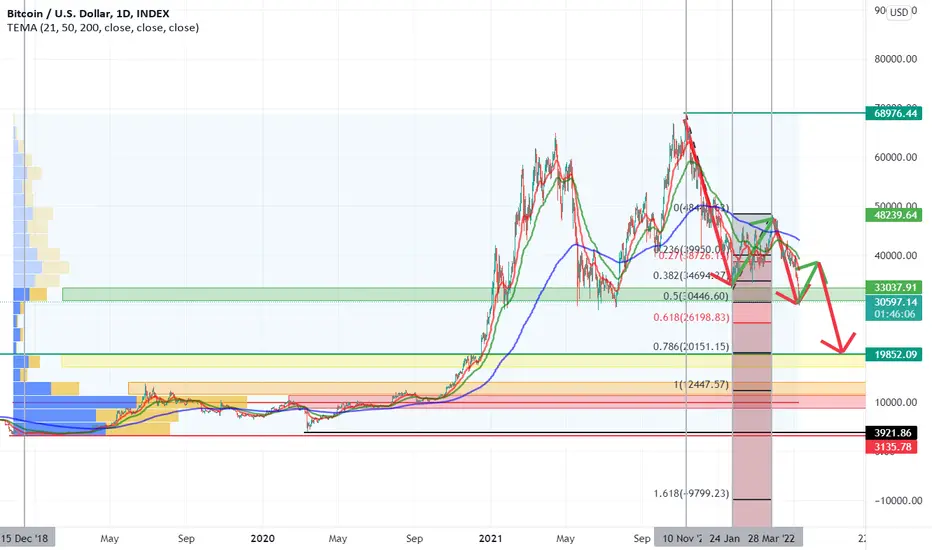
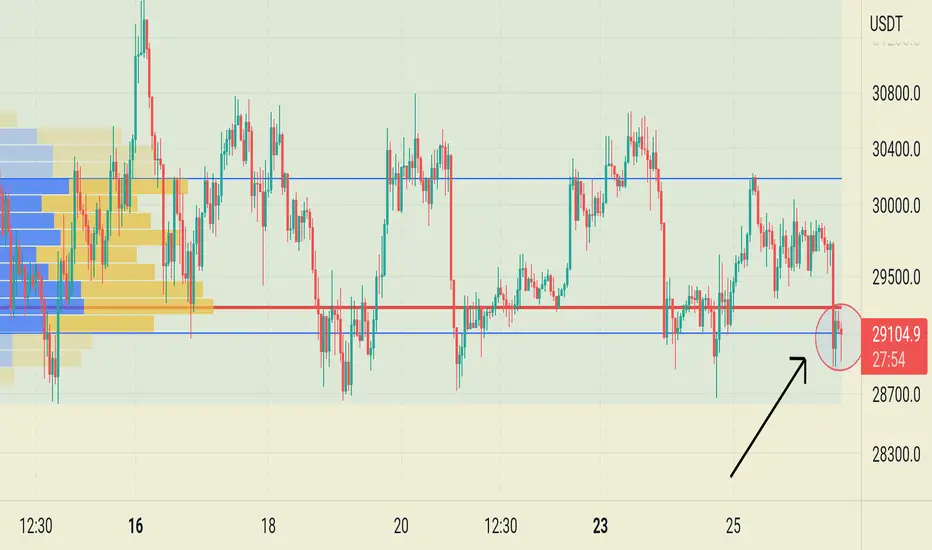
BTC - Volume Profile Levels + Trend-Based Fibonacci ExtentionFixed range volume profile was set from 15 Dec 2018 which is equal to $3135 bottom price and up to $68976 10 Nov 2021.
Based on that information I have drawn levels that show us strong zones for holding price movement. As you can see there is fighting for a 30K support level between bulls and bears. For us, it is an important zone, because if we drop below it the next support will be around $19852 which is the previous cycle high on 17 Dec 2017. Unfortunately, that zone is not strong enough and we might see an even deeper price drop to $14300 - $11300.
Let's move to the Trend-based Fibonacci extension . I have drawn it from the previous higher high of $68976 on 10 Nov 2021 to a lower low of $33037 on 24 Jan 2022 and to a lower high of $48239 on 28 March.
The last movement of BTC was down up to 0.5 level of Trend-Based Fibonacci Extention.
Potentially, if get a new higher inflation rate and U.S. Dollar Currency Index will go up we can expect the BTC price to be around 0.618 ($26198) and 0.786 ($20151).
If tomorrow we get a lower inflation rate it will give a chance for growth to 0.382 ($34694) and 0.27 ($38726).
Also, I have depicted 3 waves of bear market movement on the chart.
May the profit be with you!