BTC Bullish Divergence| Trend Line| ApexHello Traders!
Today’s chart update will be on BTC which has a probable bullish divergence as price travels close to its apex.
Will BTC respect its uprising trend line in this regression trend?
Points to consider,
- Trend in control by bears
- Structural Support to be tested
- Resistance retest confirmed
- Stochastics in lower regions
- RSI respecting trend line
- EMA’s resistance
BTC has put in consecutive lower lows in this regression trend; a break out of this channel will change the overall trend.
Structural support is yet to be tested, the $6000 psychological level is very key to hold for a bullish bias, if BTC was to test that low. The trend line is in confluence with support, signalling that buy pressure should push price up. Resistance level was confirmed by a bearish retest, sell pressure was too strong for bulls to break above, and we also have pressure coming in from the EMAs.
The stochastics is in currently in lower regions, can stay here for an extended period of time, however lots of stored momentum to the upside. The RSI is currently testing support, needs to hold true to confirm a probable bullish divergence.
Overall, in my opinion, BTC needs to break bullish from this current apex; this will respect the trend line coming in from yearly lows and confirm the bullish divergence.
What are your thoughts?
Please leave a like and comment
And remember,
“Sheer will and determination is no substitute for something that actually works.” – Jason Klatt
**Please follow me on twitter for daily updates on fundamental news in the MJ and Crypto Speace ! :) Twitter handle in profile link
Volume Indicator

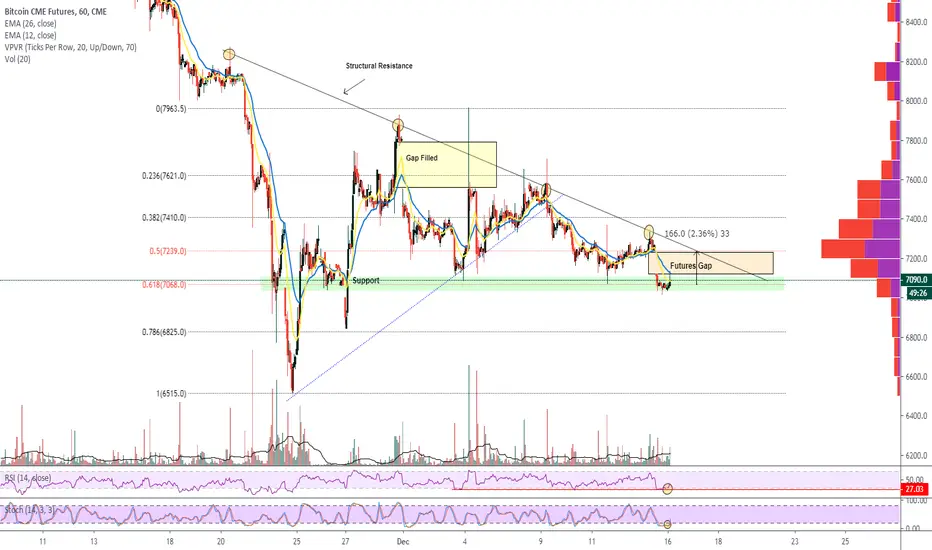
CME Futures New Gap| Clear Resistance Line Hello Traders!
Welcome back to another update, today we will have a look at the BTC CME Futures chart, where a new gap has come to fruition.
Will this gap get filled sooner rather than later?
Points to consider,
- Trend Bearish
- Price testing .618 Fibonacci
- Strong down trend resistance
- RSI in oversold conditions
- Stochastics in lower regions
- Volume below average
The trend has been putting in consecutive lower highs, establishing a very strong downwards sloping resistance line. Support currently is held on the .618 Fibonacci level, a strong area theat needs to hold true.
The RSI is currently oversold; an oversold bounce looks imminent as the stochastics is in lower regions. Stochastics can stay here for an extended period of time, however lots of stored momentum to the upside.
Volume is well below average, this signals that a move is imminent as price travels closer and closer to its apex.
Overall, in my opinion, BTC is probable to respect the .618 Fibonacci level due to oversold indicators. A filling of the GAP may come to fruition sooner than later, very similar to the previous most recent CME futures gap (chart linked).
What are your thoughts?
Please leave a like and comment,
And remember,
“The market can stay irrational longer than you can stay solvent.” – John Maynard Keynes
**Please follow me on twitter for daily updates on fundamental news in the MJ and Crypto Speace ! :) Twitter handle in profile link
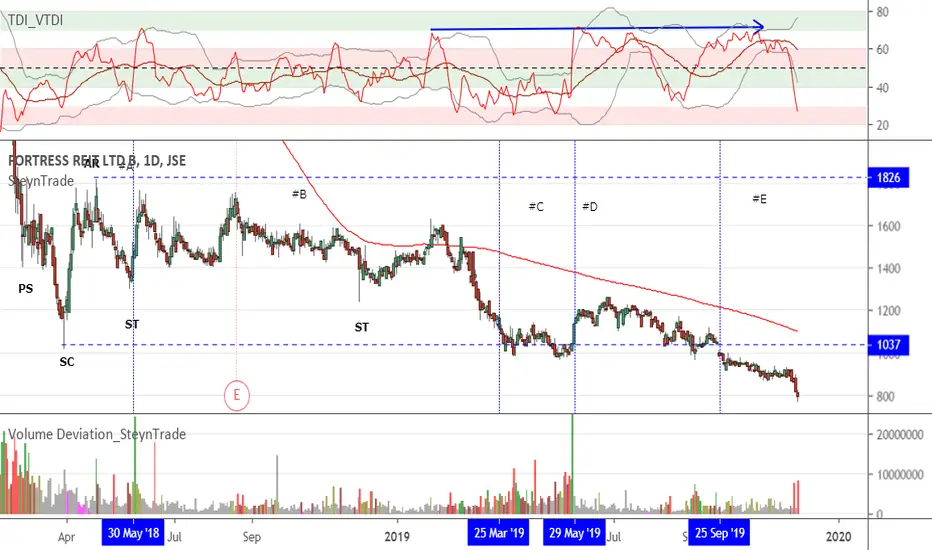
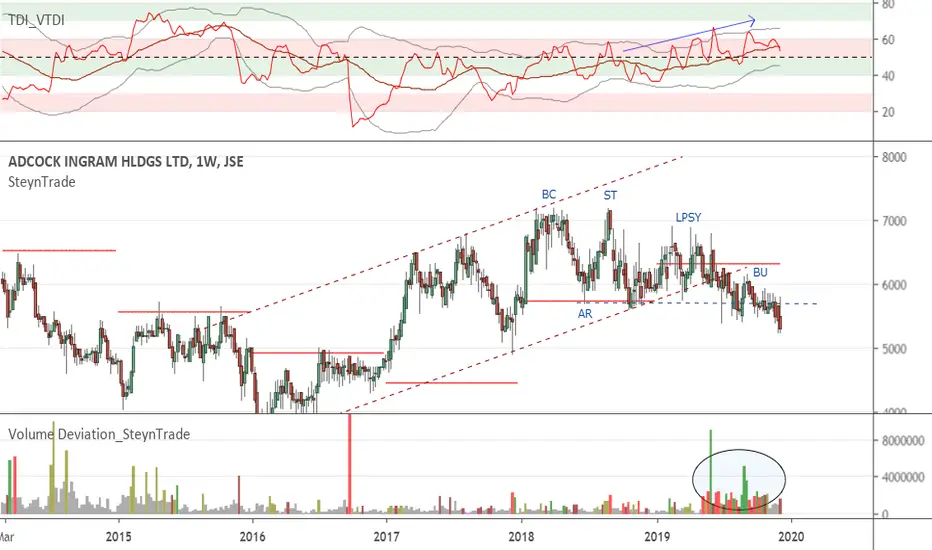
JSE:AIP Adcock Ingram Stock SelloffAdcock Ingram is being distributed by large players. After breaking the upward stride there has been a significant increase in volume with selling pressure. Price has backed up to the trading range and the markdown could begin.
JSE:MRP Mr Price AccumulationMr Price has seen volume increase as buyers step in (see post below). After stopping volume there has been a break of the accumulation trading range (TR) with a major sign of strength (SOS). There has been a backup to the TR but could not break back into the range. Now watching for the markup phase to start with the break of the recent highs.

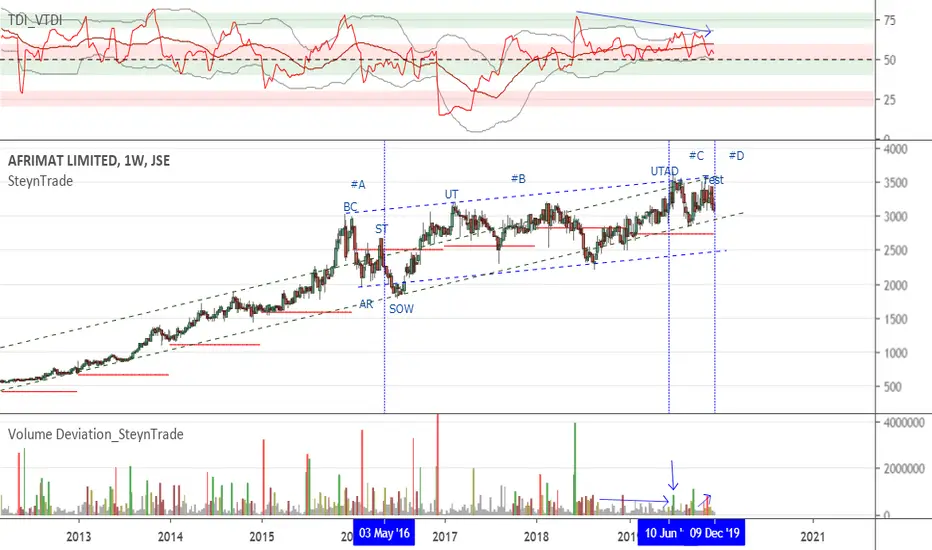
JSE:AFT Afrimat DistributionIt looks like Afrimat is being distributed. Following the Wyckoff logic, we have likely seen an upthrust of distribution (UTAD), a test to the UTAD and am now looking for the markdown in phase D. The distribution started after a throw over of the overbought line forming a buying climax (BC), automatic reaction (AR), secondary test (ST) in phase A. Some volume of the highs and divergence on the volume RSI gives some indication that this is distribution. Looking for a break of the upward stride to go short.
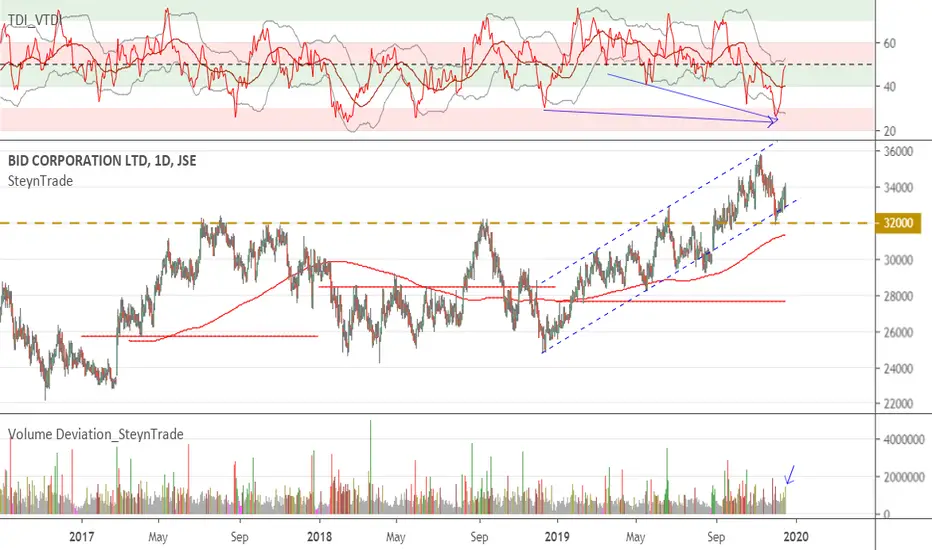
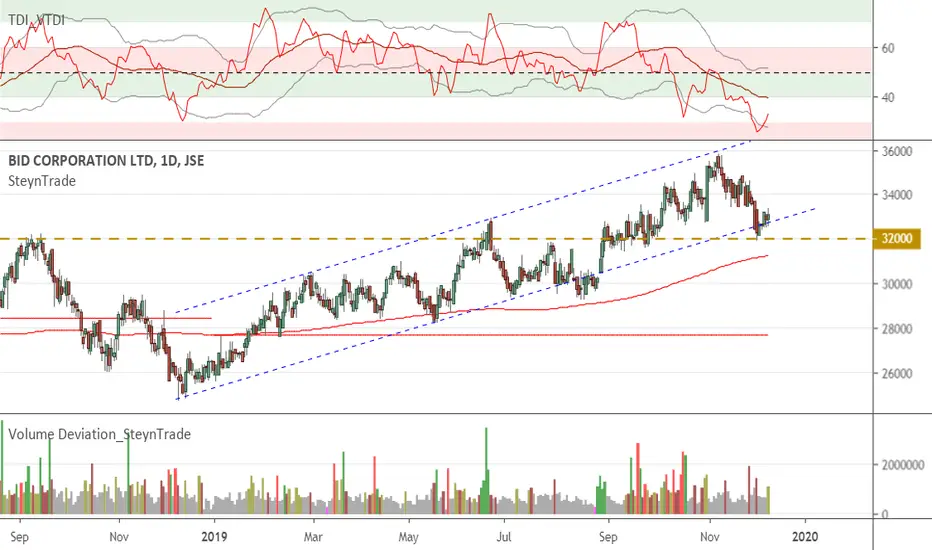
JSE:BID BID Corp Successful TestBID Corp has tested the breakout level at R320 and now is ready for the upward stride to continue. Some good volume indicates that the upwards stride could continue.
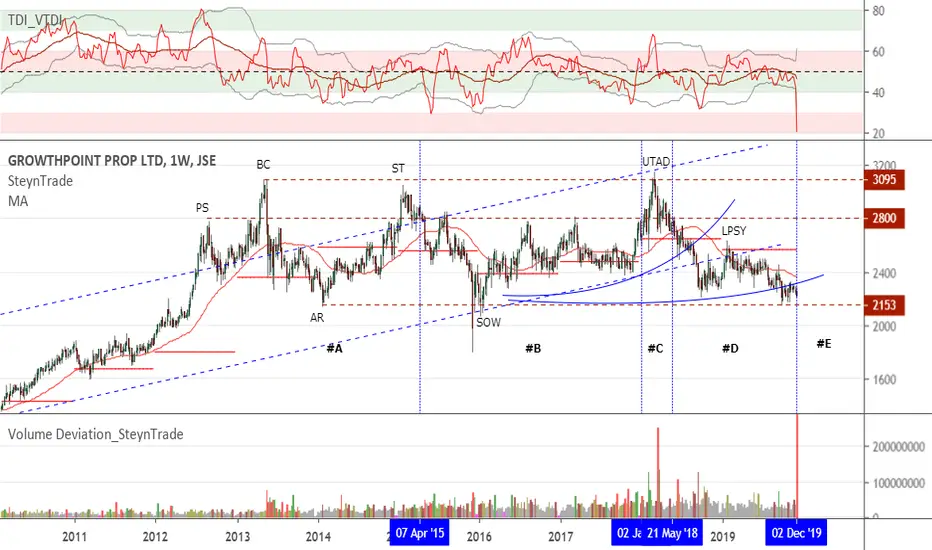
JSE:GRT Growthpoint Selling PressurePatiently following the distribution of Growthpoint (see posts below). Last week was a high volume down week indicating that the decline could gain momentum and break below the trading range (TR).
APHA Bullish Divergence | Double Bottom?Hello traders,
Apologies, been under the weather the past few days, but now I’m back!
Today’s chart update will be on APHA – APHRIA Inc – Canadian MJ. Which has been in a brutal down trend, but there are signs of a possible reversal…
Points to consider,
- Trend Bearish
- Support at $3.90 Region (double bottom)
- Price testing resistance
- Stochastics trading in upper region
- RSI diverging from price
- EMA’s giving price resistance
- Volume declining
The trend has been putting in consecutive lower highs as it approaching its possible apex zone. The green highlighted zone is the current support level with a possible double bottom, signalling that buyers are strong. Resistance is poised by the trend line, which needs to break to negate the higher low market structure.
Stochastics are currently trading in the upper region, can trade in this region for an extended period of time, however lots of stored momentum to the downside. The RSI is currently diverging from price as it puts in higher low whilst the price has put in lower lows,
The EMA’s are currently giving price resistance, needs to cross bullish to support price in testing upper resistance levels. Volume is visibly declining; an influx of volume will confirm the direction of the break.
Overall, in my opinion, a break is imminent as we have a probable bullish divergence and a double bottom coming to fruition. APHA needs an influx of volume with follow through; this will avoid a possible false break.
What are your thoughts? Please leave a like and comment,
And remember,
“Never let a win go to your head, or a loss to your heart.” – Chuck D.

JSE:NTC Netcare Showing StrengthNetcare has been struggling but is now showing signs of strength. After a strong breakout of a reaccumulation range, with increasing volume, we have seen a correction on declining volume. The stock looks like it might go and test the 2400 level.

JSE:BID Bid Corp Continuation of Upward StrideFollowing the upward stride of Bid Corp (see posts below) we have now seen a backup to the key breakout level at R320 which is also the oversold line of the upward stride. We can expect a continuation of the upward stride.
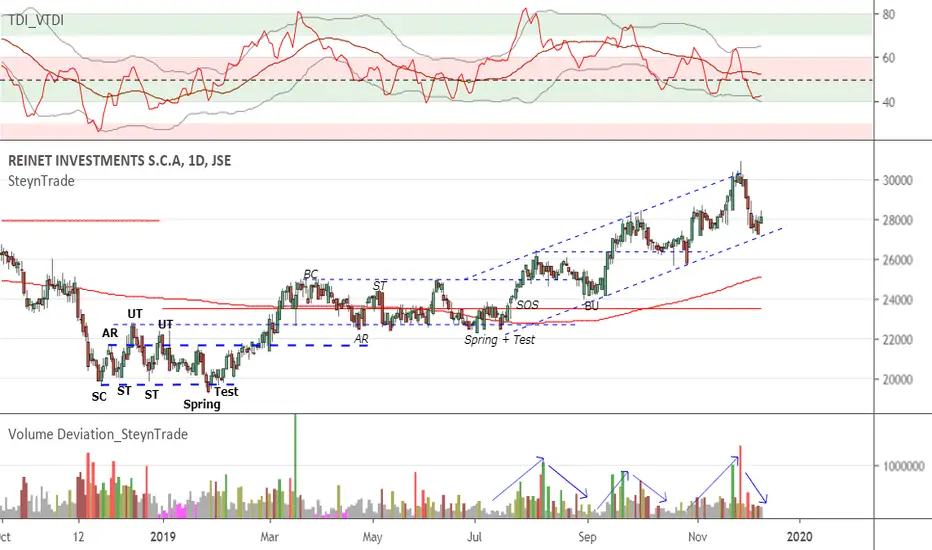
JSE:RNI Reinet Continuation of Upward StrideAfter an accumulation phase (see posts below) Reinet is now being marked up. Price has now reached the oversold trendline of the upward stride and can be expected to take the next step higher.
JSE:STXIND JSE Industrial Stocks Being distributedUsing the STXIND as a proxy for the industrial index to get an indication of volume it looks like the industrial stocks on the JSE are being distributed. We have seen an upthrust and sign of weakness (SOW) with increased volume on the declines and no interest in the increases. Price has held below the 200 SMA and Yearly Pivot Point. We are now looking for a break of the trading range to see the start of the markdown.

JSE:SAP Sappi Buyers Taking ControlAfter distribution and markdown, we have seen climax volume as buyers are stepping in. Price has now broken the downward trend it looks like the price could be breaking higher.

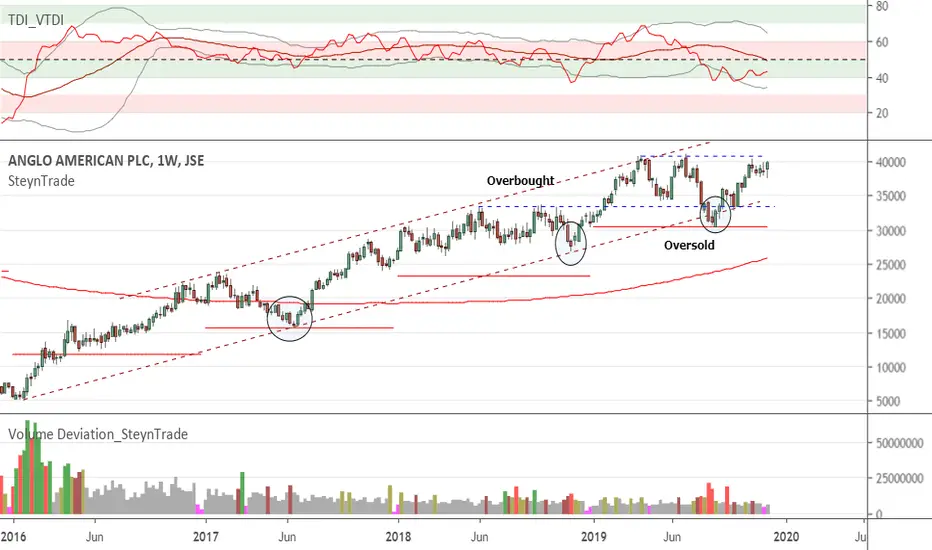
JSE:AGL Anglo Ready to Break HighsAnglo American has been trading in a well defined upward trend (see posts below). After testing the oversold line there has been a good advance and the recent highs are being tested. A break of the highs should see a test of the top of the trendline.
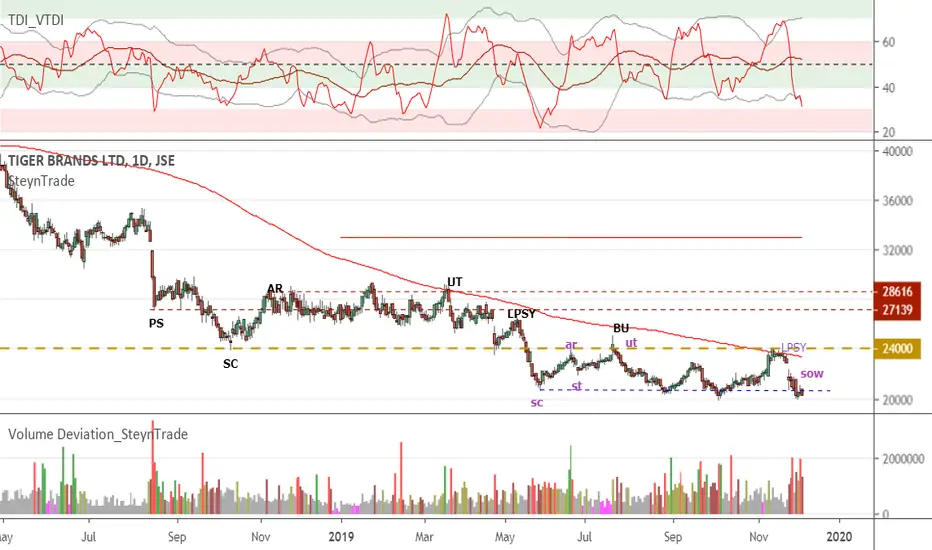
JSE:TBS Tiger Brands Next Step DownTiger Brands have is in the process of being marked down (See posts below) in a series of redistribution stepping stone. The latest redistribution trading range (TR) has seen a change of character in Phase D and I am now expecting the TR to be broken. Some consolidation at the breakout level can be expected but after that the next step down is expected.
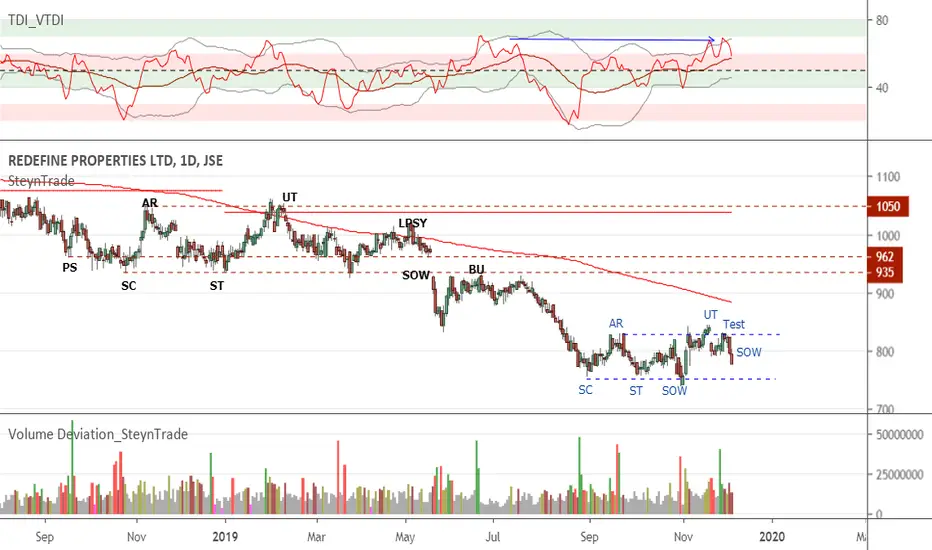
JSE:RDF Redefine Markdown Continuing Following the markdown of Redefine Properties (See posts below), we have seen a smaller redistribution trading range (TR). There have been signs of weakness (SOW) with volume increasing on the highs pushing price lower. After an upthrust (UT) and Test, we are seeing price being marked down. This could just be the start of the further markdown.
JSE:PSG PSG Markdown in Phase D StartingIn a previous post (See link below) the theory that PSG is being distributed by the large investors was put forward. We are now seeking the start of the markdown in Phase E of the distribution and there is likely to be more downside to come.
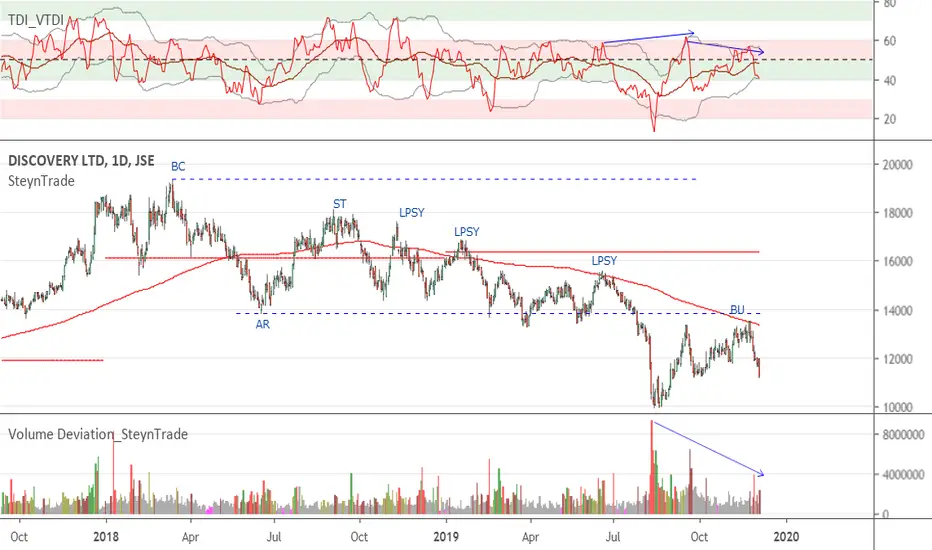
JSE:DSY Discovery Markdown Starting After a good markup phase, Discovery has undergone distribution. After a breakout of the distribution trading range (TR) price has backed up (BU) to the TR and is now pushing lower which could be the start of the markdown phase. Volume has declined on the BU and divergence with the volume RSI indicates a continuation of the decline.
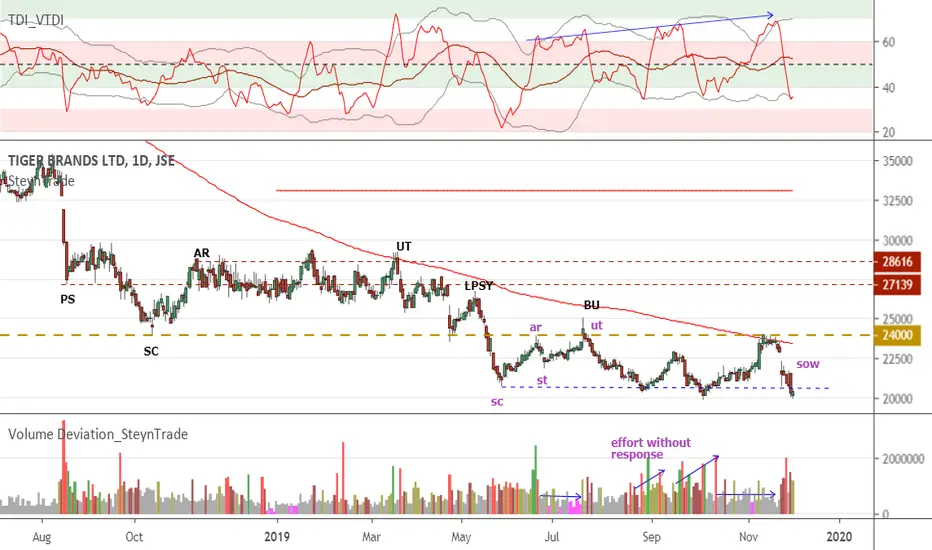
JSE:TBS Tiger Brands Markdown Set to StartTiger Brands has traded in a redistribution trading range (TR) and after breaking the TR it has attempted to break back into the TR but was unable to so. We have now seen signs of weakness (sow) which followed no demand on the increase. The previous attempt to rise with volume (effort) showed little response indicating that sellers are in control. After some consolidation at the smaller TR breakout level, we can see the markdown begin.
JSE:SAP Sappi High Volume (Effort) without ResponseAfter distribution, Sappi was being marked down. However, we are seeing very high volume that has been increasing and this week the highest volume was recorded. In spite of this high volume, the price has been trading in a very narrow range around the key R40 level. It seems that large interest buyers have stepped in and a break of the narrow trading range could result in a significant move.

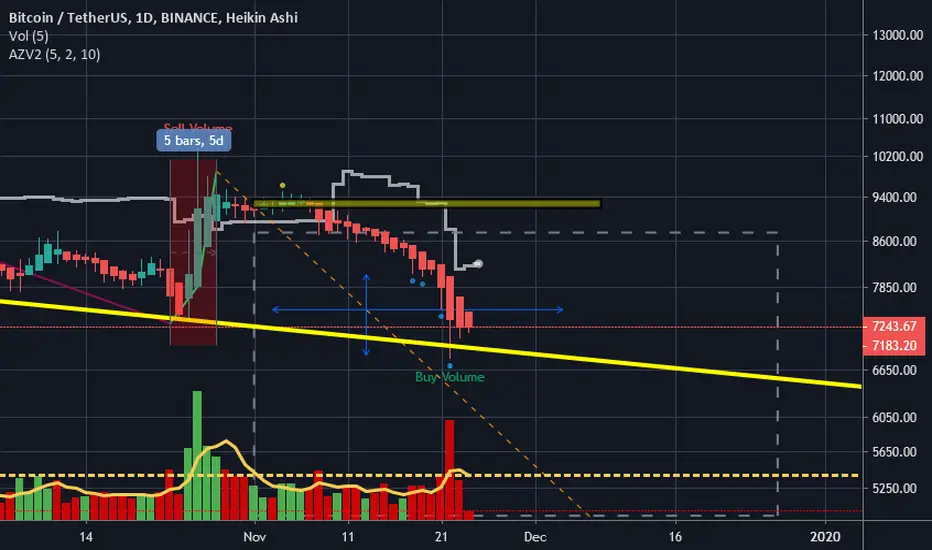
BTC Pump incoming Using AZV indicator with Profile Analysis
BINANCE:BTCUSDT
Buy signal: (Bounce back ) ( Breakout )
AZV Sell signal : AZV - NO of bars = 5 & Multiplier = 2
AZV Signal type = Open Target
AZV indicator Link :
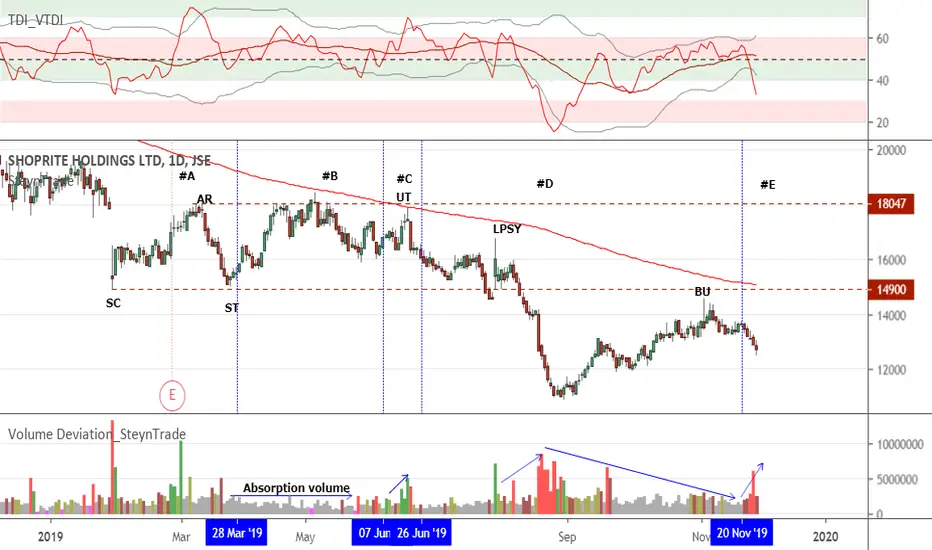
JSE:SHP Shoprite Markdown StartingAfter breaking the distribution trading range (TR) we have seen a backup to the TR and now price is breaking lower. This looks like the start of the Phase E markdown. Increased volume on declines and decreased volume on attempts to rally indicates supply overcoming demand and large interests distributing the stock.
JSE:FFB Fortress B Effort Without ResponseThere has been an effort to push price higher without response. The effort is seen in negative divergence on the volume RSI and in the volume. I previously interpreted (See post below) this as buying pressure but the lack of response is pointing to supply being dominant. The markdown is set to begin.