Reaccumulation SchematicWyckoff schematics come in many different forms but originate from a basis of 3 other schematics: distribution, accumulation, and reaccumulation. Reaccumulation patterns consist of many creeks and channels. As you may see here, the minor creek has been broken with a lot of volume. Then, after a big jump--wide spread and high volume-- we saw another break of the major creek creating a major sign of strength. This momentum was enough to confirm a breakout and create an LPS to add to a profitable position. The LPS is shown here in the circle. It is hard to see on a 15 min time frame, but it does exist there for a perfect low risk entry.
Volume Indicator

Replaying Trade Setups - High Volume RecoveryThis video is to show how areas of high volume can act as a great tool for Technical Analysis.
The settings were as follows:
- Timeframe 15 minutes
- Lookback average (10) equaling 150 minutes
- Volume above 250% above the lookback average
What we could see at the start of the video was that there were previous red zones where there had been above 250% down volume.
This was recovered by high up volume creating further green zones that were then recovered.
This is just one of many tool that can assist you with your Technical Analysis.
Where does this leave us, with a potential to sweep the current low to grab the green zone followed by a reversal or price move up to the newly created red zones.

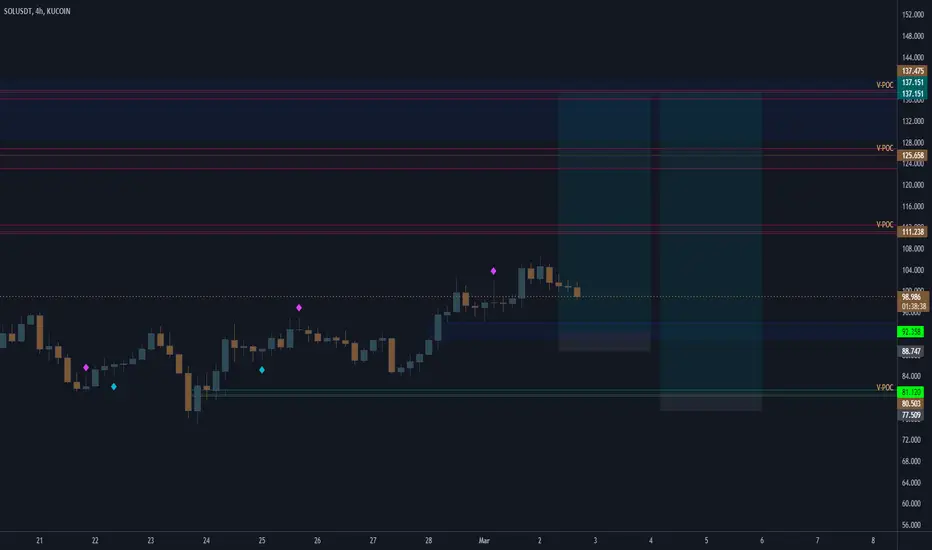
SOLANA Possible head and shouldersHello 👋
Possible head and shoulders forming on the daily chart. keep an eye out.

SOLANA TRADES Upcoming Potential trades for Solana and levels to watch...once price approaches these levels we watch for bullish moves + momentum
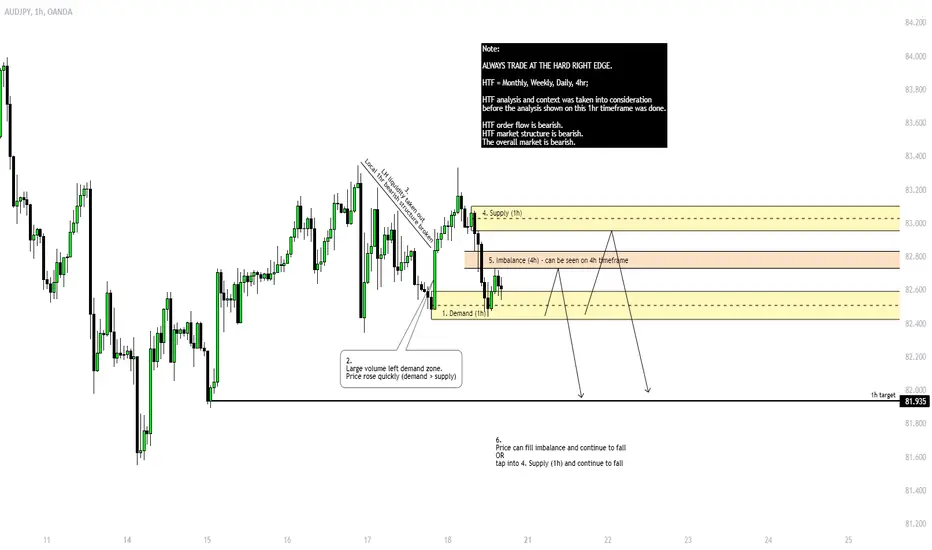
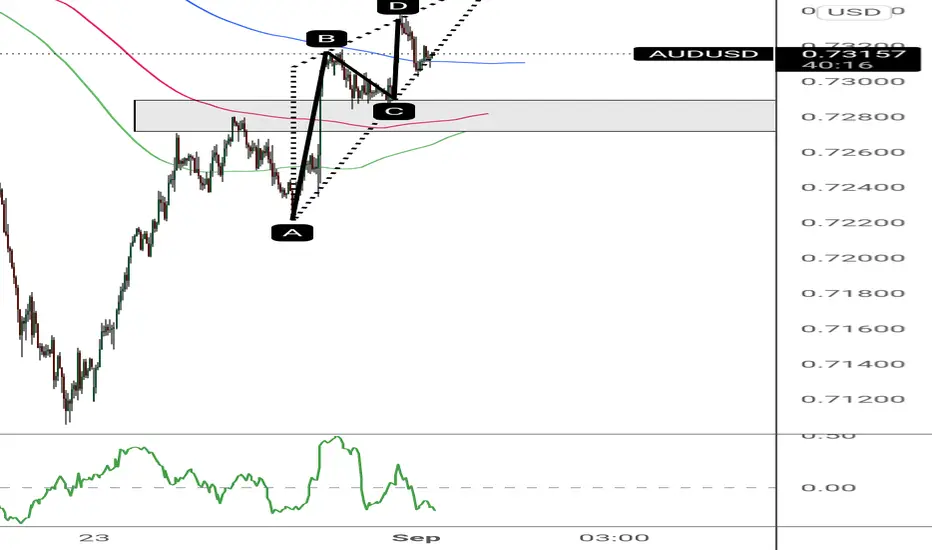
AUDJPY ShortRead the chart.
Read the chart.
Read the chart.
Read the chart.
Read the chart.
Read the chart.
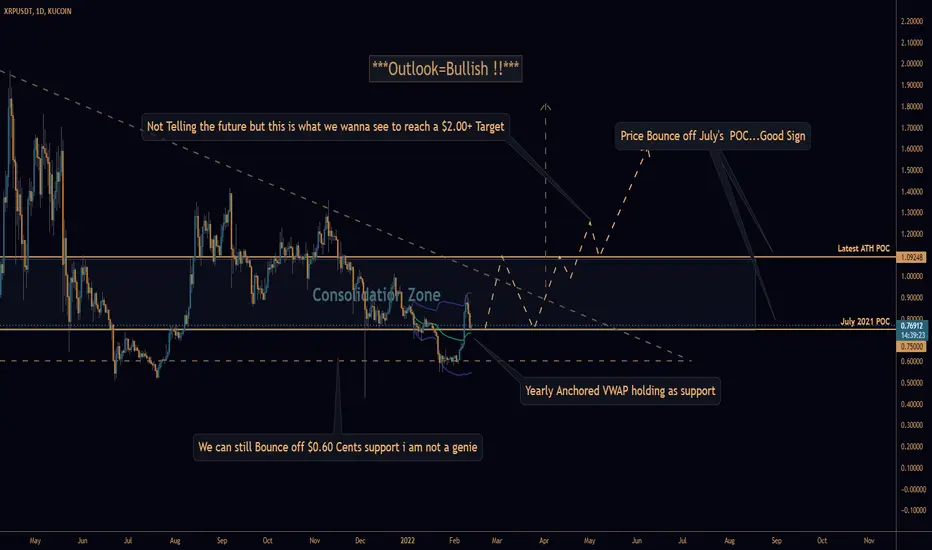
XRP Long term outlook using POC + VWAP Hello there 👋
Here is my long term outlook for XRP
Overall Bullish if we continue holding support on July's 2021 POC
XRP is currently holding support on the Yearly VWAP and POC ( Good Sign!! )
Next we wanna see Price break the Consolidation Zone and hold above the latest ATH POC.
We can see a retest of July's POC after breakout.. but as long as we break consolidation we can expect to see bullish moves in the near future.
Thanks for reading. 📜
Uhm that's huge right?I typed a while bit out but I went to get the link and it all disappeared when I switch back over to this application. So that looks like a lot of volume like a whole lot of volume. Does that mean if this purchase wasn't made that we would be deep in the home? Or did it just trigger a lot of pre-made orders?

High Volume StatsThe below are just some statistics based on:
- Volume bars with 500% increase of volume.
- 15 minute timeframe BTCUSD.
- Baseline of the last 10 volume bars averaged against the current volume bar.
Since 21st July 2021 there has been 51 occasions were there has been a 500% increase in volume.
47 of these (500% volumes) has seen price retrace/recover that price action area.
Out of the 4 that are left 1 is below current price action with a price range of 29925 to 30525 .
This is not a trading call but more of an observation of reviewing past price recovery of volume bars that are equal to or exceed 500%.
Trade safe, DYOR.

CAKECAKE
CAKE is also after huge and health correction. Price is in the small
yellow acummulation rectangle. If the CAKE want be able to do something - he should react on market at the current moment. So going up soon.
If CAKE and market fail we will see CAKE back in the green support.
But looks bullish.
LBL_CZ

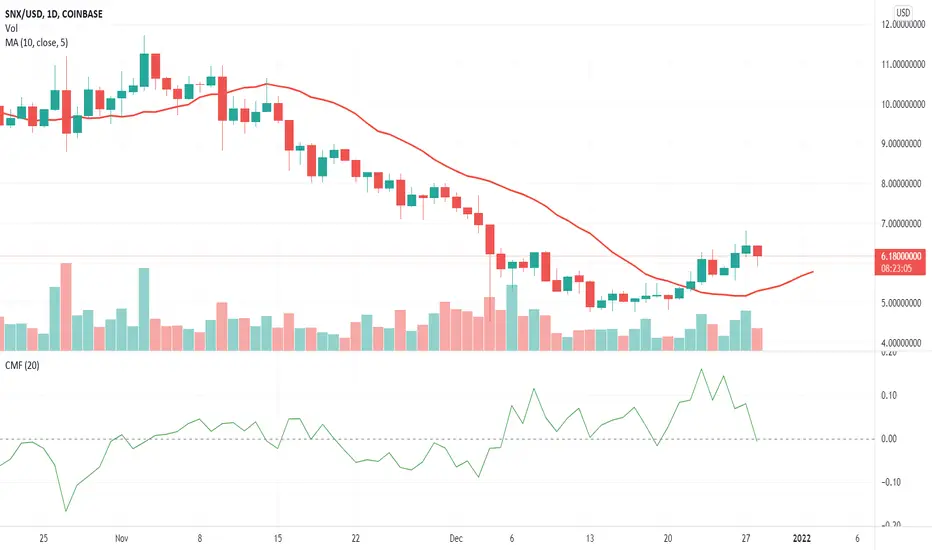
SNX and the Chaikin Money FlowKnowing what is in store for Synthetix Network Tokens (SNX) has kept me in for the long view. I have been fairly impressed with the Chaikin Money Flow (CMF green line on bottom of chart) attempting to maintain positive territory (staying above zero) for SNX even as ETH goes negative. Right now, it seems SNX is more closely tied to BTC money flow. Should be interesting to watch knowing that BTC is King Crypto and will eventually rise to unimaginable price value... even from here. Here's to SNX continuing to mirror. It will eventually pay handsomely.
EXRD/USDTSecond TA.
Possible scenario?
Feedback is welcome.
I am going for the Volume at the rotations (fixed range).
I focus at the POC's from past, even consider the HVN and LVN in this areas.
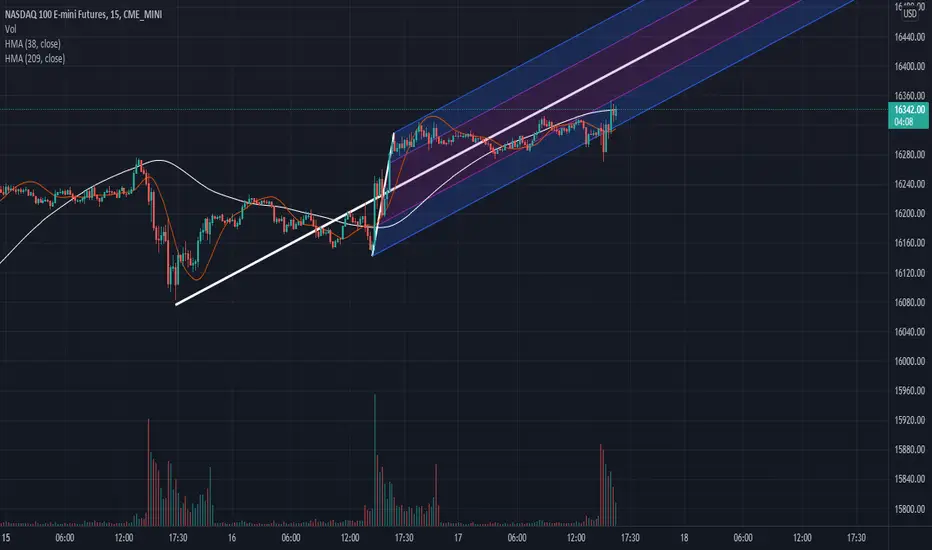
NASDAQ 100 E-MINI FUTURESKnowing the next market trend BY PITCHFORK INDICATOR
NASDAQ 100 E-MINI FUTURES analysis
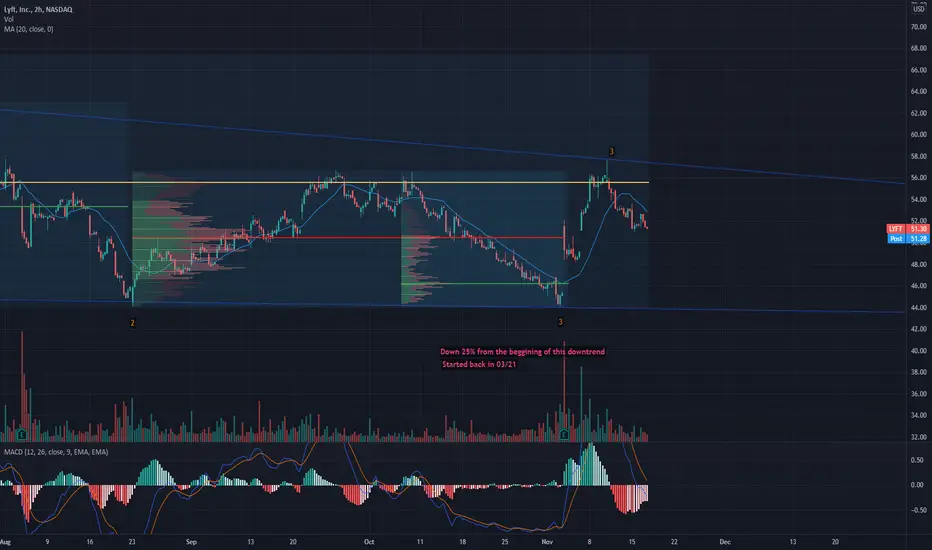
LYFT Downtrend Range 2HRLFTY has seen a downtrend range since March 21', and keeps making lower lower and lower highs. Chart may look a little messy with the VPA, but here are the notable things about this pattern:
-Both support and resistance have had 2 high touches, with the 2nd touch nearing the resistance (support has had 3 touches)
-The ellipse shows a Head/Shoulder formation, with the neckline confirming a sell on the break, further rolling LYFT down the hill
-VPA suggests that the downtrends overall POC (shown in yellow) and the green POC show a average POC of $54.40-ish
-Red VPA suggests there will be a battle of $50.50, however , most of this volume was realized this last earnings call - nearly 425k to be precise, so 'battle' might be closer to $48.48 (in between red and green POC's)
-Nov. 5th gap. Historically, LYFT has had a decent rate of filling the divots, I expect this to not be different.
-MACD in stagnant divergence over the past few days.
Nevertheless, I believe LYFT will follow the trading bands for the moment, possibly making another touch on the support.
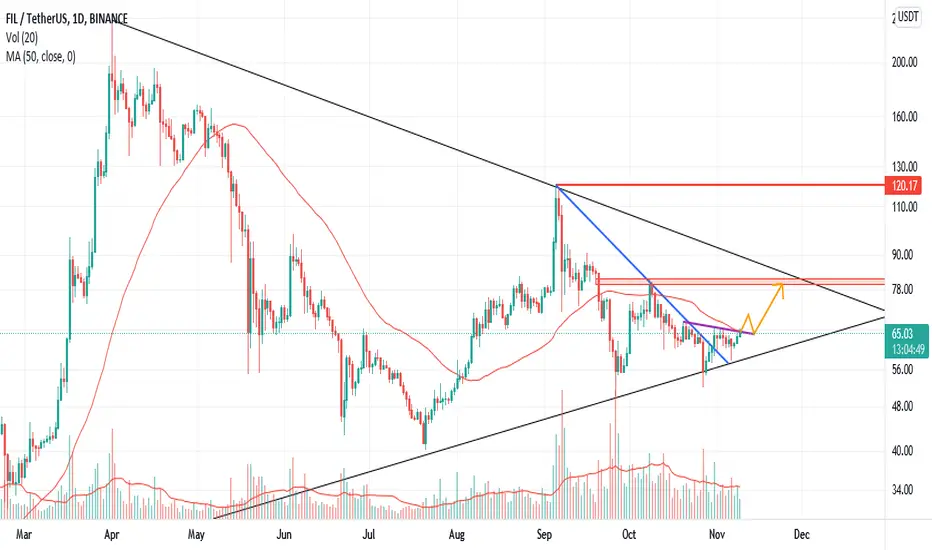
FILCoin Can rise up?We are still in the triangle but the blue downtrend line has been broken.
Now we have tow resistances:
1)MA 50
2)purple downtrend line.
for going up we need volume above 3.3M in a day...
XCUR / USDTit may not come all the way down for it... or at all.. but if it does... i would highly consider buying the retest. not financial advice. XCUR gonna run hard
CADCHF reversal coming??It's been bearish for a while and has reached major demanded level bullish B.O.S and internal bullish candle that level hold we should see slight bulls pressure to the highs

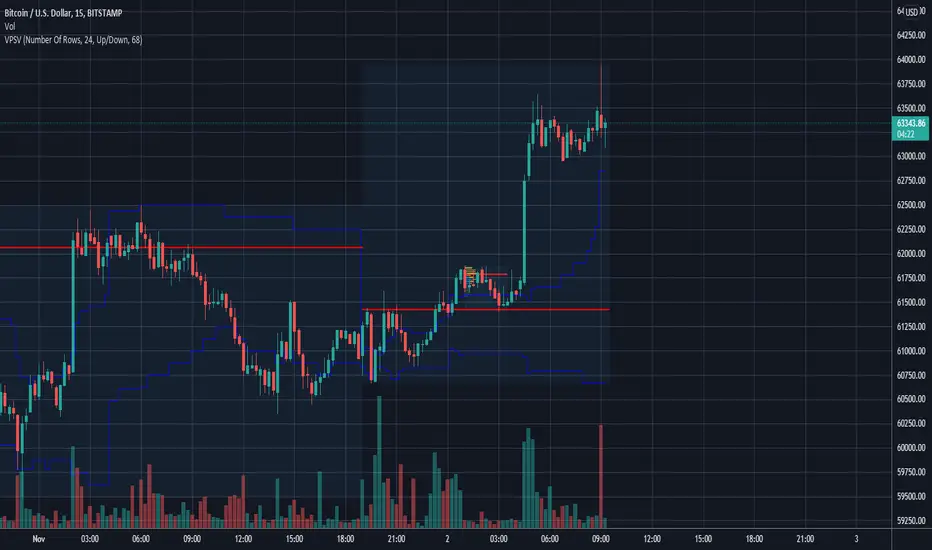
Short Term (24-hours) Pull-Back to $62,000.Lots of selling pressure. Point of control is well below the current price. I remain bullish long-term.
Analysis of BTCUSD levels of interest; suggested price Vmax zoneBulls will need to see this volume bar at continue to increase in magnitude. Failure to further develop the volume at the current spot price likely suggests pullback potential; pullback potential is limited, perhaps, to the next lowest volume profile peak circa ~56,965 USD. Notice, the 54,391.69 to 49,244.89 has notably low development on the volume profile; this low magnitude suggests that in the event of a pullback, price action will move with high velocity through this area. Peak velocity of price movement is expected to hit a Vmax at 52,630.94. However, this is better considered a price level of high importance, as it could easily also become a new support level, where buyers seek to buy BTC at a "discount," or, in stark contrast, breakdown into this level could potentially lead to a drawdown/correction - only time can tell. No recommendations. Not trade advice.

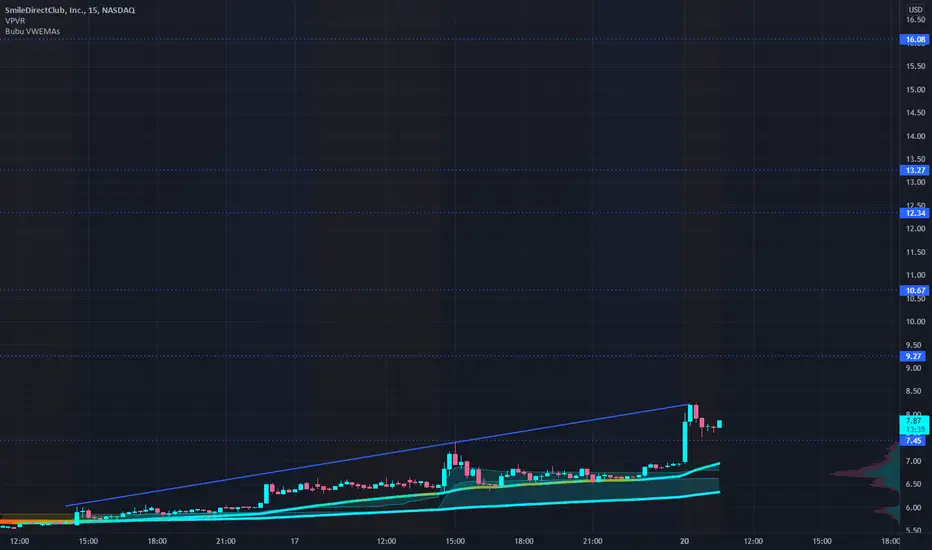
SDC - Finding the extreme topsAs Smile Direct Club becomes the newest "Meme" stock. It's the fun guessing game of predicting a top where no obvious obvious resistances can be found.
You can look back on monthly / weekly levels to try and have faith in those lines being retested. But which do we ignore and which do we believe?
You can do fib to try to align the previous supports / resistances to predict another.
Thankfully, we are not at all time highs and there are very old levels which are important.
Monthly Volume Weighted Prices become important levels. People "holding" for a change to sell can have that chance at these levels.
Already, the 7.45 was tested and acted a strong resistance. This line was drawn on the first of this month.
The next most important levels are 9.27, 10.67, 12.34, 13.27 and 16.8.
It is extremely tough to say it will absolutely hit these levels, but if you are looking for a price to sell, be sure to draw these down.
ES getting wound up tightYou can see that ES is winding like a spring. Here it sits between the 2 green support and resistance lines and narrowing Bollinger. And also looking at daily volume it is pretty low. In last month we hit lowest volume in 3 month and 6 month period. All this to me means we may be at a high and in for nice drop.

AUD/USD SHORTAUD/USD appears to be consolidating upwards within an ascending triangle. Chaikin money flow is showing strong bearish divergence. If price can break below the shaded support area waiting for a rebound then entering short seems like a good idea.
*For educational purposes only*
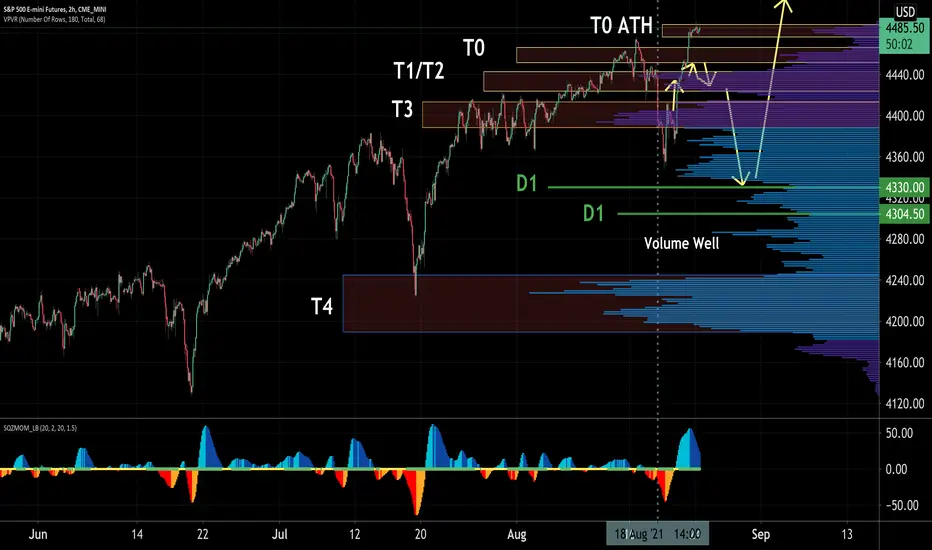
The Next Buy the Dip Moment ComingThe market has settled into a persistent pattern, making consistent new ATHs. Here's my prediction for the next All Time High.