$MCEP Short, hovering under past resistance w/ overbought RSI$MCEP has been parabolic and is near the past resistance @ the 3.50 level. The RSI is around 81 and is extremely overbought, I will be watching MCEP right out of the gate for a confirmation of the short. Keep an eye on this one tomorrow!
Volume Indicator

CSCO-160412-STO/DMK-G1D-SHORTSome days ago i see NASDAQ:CSCO walking with dante, but if we put attention the price is rejected by the 22.75 zone one and other time and is describing a big flat bottom triangle pattern, and very nice to navigate inside of this.
The volume is reacting now and indicate the same risk than the Stochastic - and the price - in this days can re-test the 28.5/29 zone (or not), but if the triangle is right then go to 22.5/24 zone, and then evaluate if broke the triangle down or go up to the 27 zone.

RTN-160412-STO/VSA-G1D-SHORTi see the next at NYSE:RTN :
The stochastic of volume weighted show a clearly downtrend
present a divergence between action price and volume price weighted
the volume is starting a downtrend and the price have problems to cross the 127 zone
I think is starting to be short.
Ideas, comments or corrections
They are always welcome

RTN-160412-CCI/VSA-G1W-SHORTi see the next at NYSE:RTN :
The CCI-VSA indicator present a downtrend
present a divergence between action price and volume price weighted
the volume is starting a downtrend and the price have problems to cross the 127 zone
I think is starting to be short.
Ideas, comments or corrections
They are always welcome

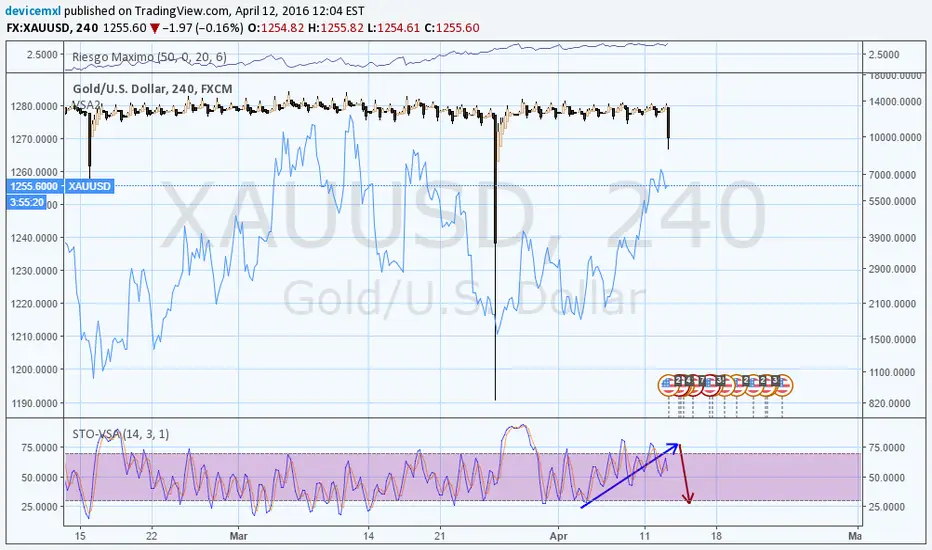
XAUUSD-160412-STO/VSA-G4H-SHORTFX:XAUUSD is in a bull trend, but the volume weighted has a continuous big black candles in the past days, and the stochastic of volume weighted show and exhaust bull trend.
Ideas, comments or corrections.
They are always welcome
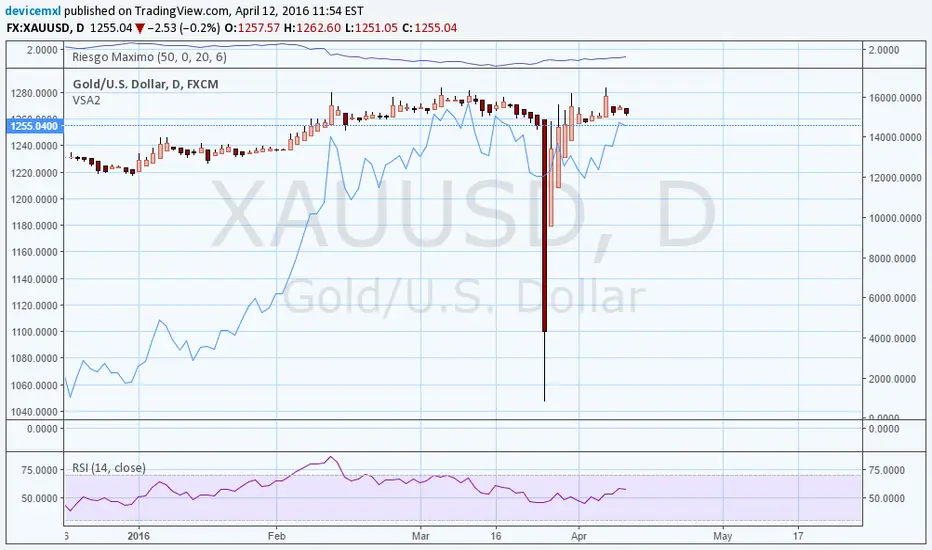
XAUUSD-160412-RSI/VSA-G1D-SHORTFX:XAUUSD is in an apparent uptrend, but the price-volume weighted is not reacting by the way. The volume has a strong pullback and the RSI present a flat and large downtrend. I think is strong short in few hours or days.
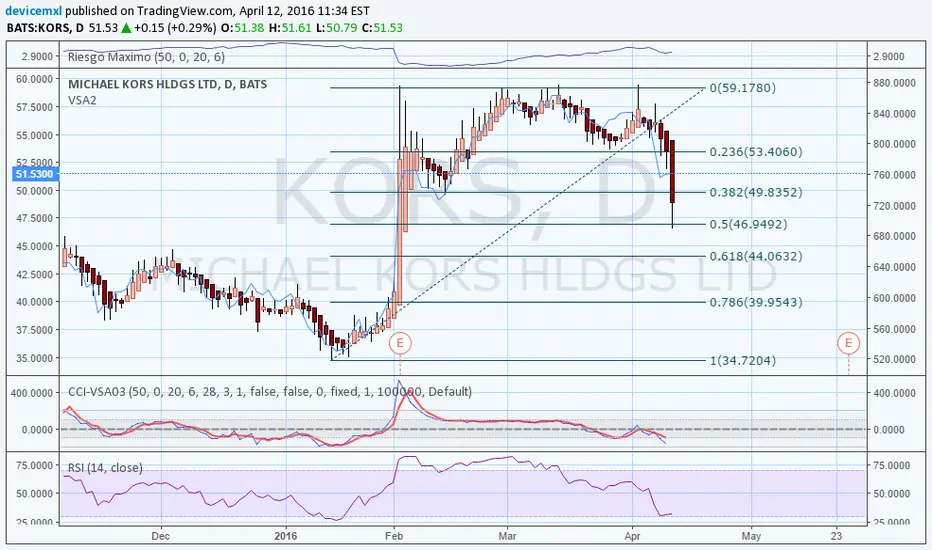
KORS-160411-STO/VSA-G1D-SHORTNYSE:KORS present the next symptoms:
is reacting to the 38.2 support line
strong resistance line around 60
the stochastic present an strong and fast bear trend
The price and volume present a big divergence.
The big down at price-volume weighted and the price reacting bull, plus the possible reaction in stochastic indicator meaby will be make a head and shoulders formation.

KORS-160411-CCI/VSA-G1D-SHORTNYSE:KORS present the next symptoms:
is reacting to the 38.2 support line
a "slow" volume weighted CCI have space for too much bear trend
KORS presents a big resistance around the 58/60 level.
The price and volume present a big divergence.
i think in the other analysed scenes and the general ambient and meaby can react to form an head and shoulders or another slow bear formation.
GD-160411-CCI-VSA-G1W-POKER_FACEAn speculative idea of NYSE:GD We can see how the volume have a big drop down starting the week, meaby can be a hammer at weekly end, or continue the drop. The RSI (price) have space for a big down and the VSA_CCI is recuperating or simply will be down a "little". The Heikin Ashi of the volume weighted price is forming a descending wedge and is easy the route to the 0.328 of fibo.
Target 1: 115
Short for few weeks
“stocks do not rise in price unless demand exceeds supply. Demand is measured in volume and thus volume must precede price.”
Joe Granville

$SQ Cup&Handle Breakout FIb ret. and continuation of trendSquare's trend has changed, if you don't belive me take a look at this chart! Following an unsuccessful IPO (Can't think of any successful one in today's market enviroment) it bottomed out at $8.05 and volume dried up, subsequently it started gaining momentum volume picked up and reached a level of 12.64 forming what looks to be a cup, then the handle came along at a theoretically perfect retracement level 38.20% in Fib terms. The breakout pushed the stock beyond the high of the left side of the cup, and volume is continuing to increase signaling fresh buyers. Adding to all Mizhuo initiated coverga eof the stock issuing a BUY rate with a target of 16$ (www.marketbeat.com)

Buy volume increase strongly Dollar trading above SMA100 with strong buy volume increasing. Long trade setup. Good luck!

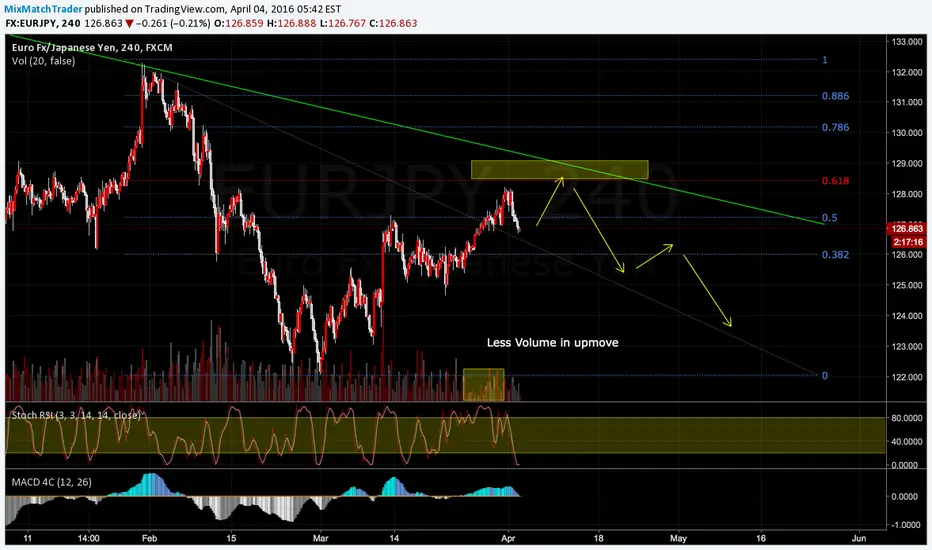
Looking for one more down move in EURJPYHi traders,
Less Volume in Upmove, so there is no more demand.
the trendline is around 61.8 fibs. so i'm going to look for short opportunity in short term period.
Good Luck and Trade Wisely
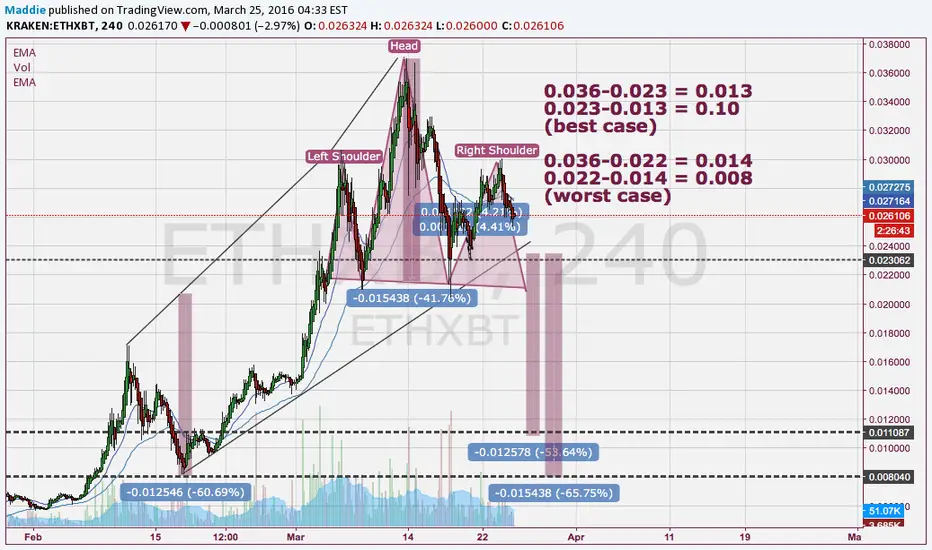
Possible H&S forming on the ETHXBT chart !Hi Guys,
Guess what.... Maddie is back!
Because some of you found my chart's ugly i've made a new layout, with a little touch of pink :) hope you'll like it! Im no't gonna make a very long description on explaining patterns etc so, if this head and shoulder pattern breaks it's neckline for more than 1,5 days, than you should take a look @ my price prediction. Everything you need is in the chart, but if you still have any questions, feel free to ask them of course!
Have a great day,
Maddie
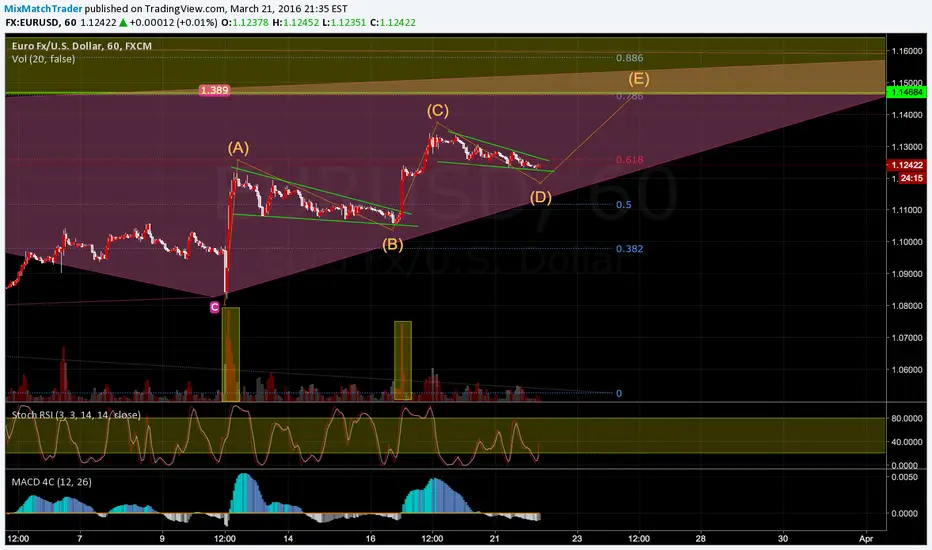
Buy ABCDE completionHi Traders,
Last Week I posted Short in EURUSD Gartley Pattern, Now in lower Timeframe before they making A Gartley pattern, I see an Opportunity to go Long with TP at Gartley D Leg.
The Volume Show more demand in Wave A and C, So i'm taking the risk to Go Long in Wave E.
So i will Buy this EURUSD pair at the Breakout of D retracement.
Good Luck and Trade Wisely
Short CADJPYHi Traders,
Volume shows lesser people attracted in upmove (less demand). so i see the upmove just as an retracement.
Bat Pattern will formed soon.
Elliot ABC retracement is ended soon.
Stoch divergent
More than a reason to short this pair. and i will short this pair just like i planned
Good Luck
