JSE:SOL Sasol Time to Let it GoWe have been following Sasol sins the climax lows in 2020 indicating a target of R200 - see the progression of posts below. We have reached the target and now we are seeing active signs of distribution. After a climax in March, there was a strong secondary test but the next upthrust (UT) on volume made no progress (Effort without Response) indicating selling by the big players. A change in character was seen in June with an increased downward spread on volume making signs of weakness (SOW). The latest attempt to rally could not break the 50SMA and after a key reversal bar, it is time for Sasol to drop potentially retracing all the gains of the last year.
Volume Indicator
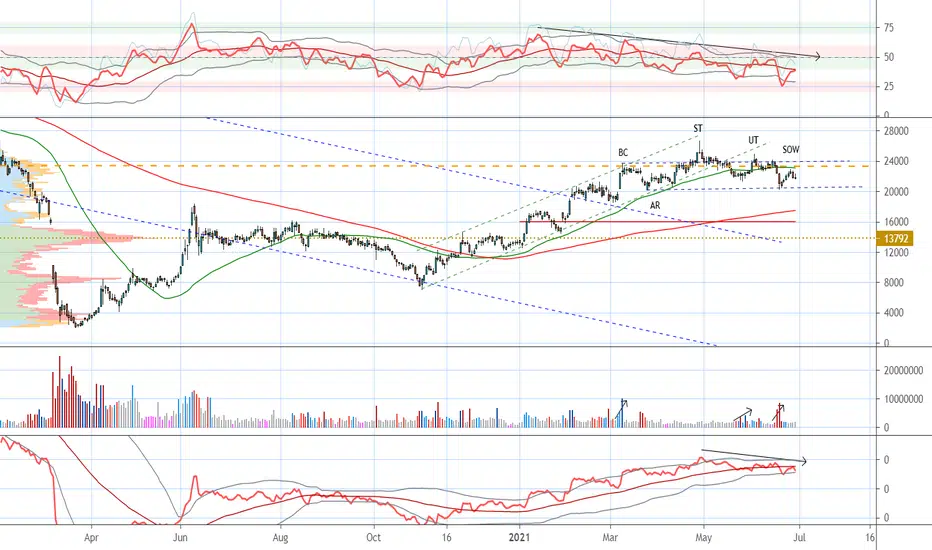
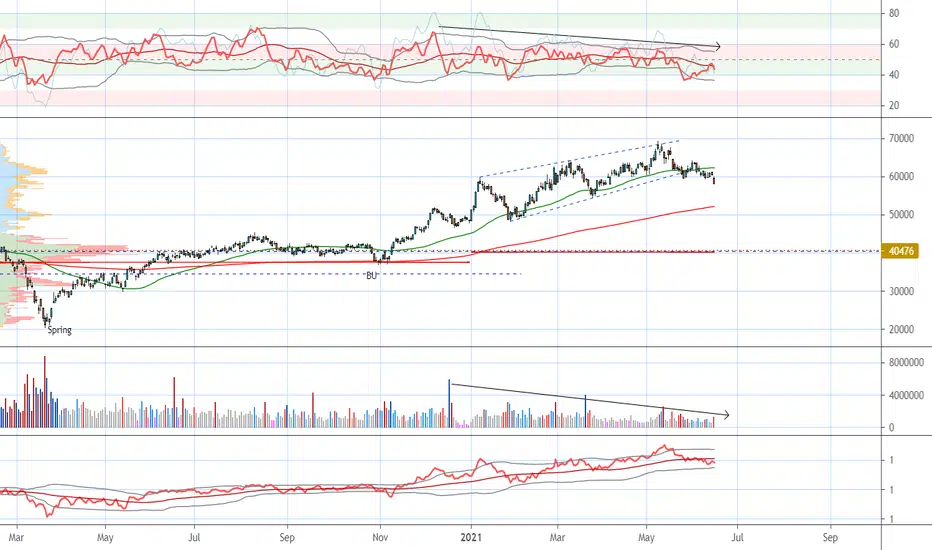
BTC wyckoff Accumulation back in 2015I think taking a look at the past is one of the best ways to predict the future. History repeats itself over and over again.
Wyckoff always emphazised Volume as the best Indicator. He also challenged us to ask ourselves "what is the composite man doing right now?"
I think he was spreading FUD like crazy, while accumulating
Phase C
Remeber what the Spring aka Shakeout is: It’s usually the last attempt of the Composite Man to acquire shares at cheap prices before the mark-up move. Creating selling pressure forces retail traders to think that the current trading range will end in the mark-down movement (along with FUD) and exit or reverse their positions. The Composite Man waits for breakout to create enough liquidity and then rapidly covers all available supply resulting in price getting back into trading range.
Test: A small retracement to check if there is enough support at the bottom of the trading range after a shakeout. The Composite Man stops his buying pressure (as we see on VOL) and checks if the market has enough demand to not let price fall below the trading range. If so, the market is ready for the mark-up move. If not – the Composite Man continues his accumulation of available supply
Phase D
LPS: is the reaction after a Test rally. It usually retests previous levels which were considered a resistance. These reactions are usually quite slow and have no volume (as we see right now!)
Right now for BTC the VOL should stay low, because the Institutions stopped buying and manipulating, to check if the retail is ready to push the price up, or if there is any major selling pressure. This might take a while and might be a little more back and forth than in 2015. Once we break above 40-42k and CONFIRM it as support the Volume will come back in and from their we good.

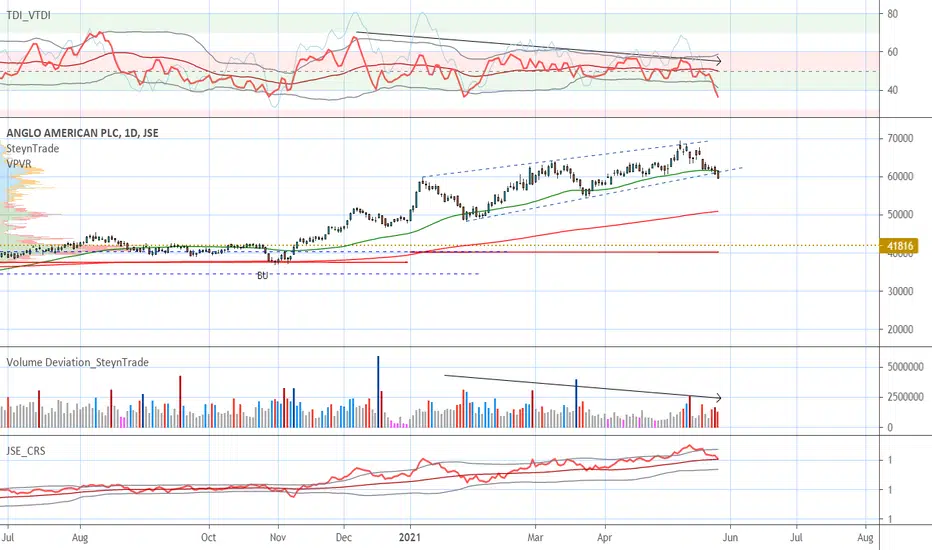
JSE:AGL Pullback Gaining MomentumAs indicated previously - see post below - Anglo American is ready for a pullback and is now gaining momentum. Still looking for a test of R400 to determine what is next.
JSE:J200 Effort Without ResponseThe Top40 has been on the rise since the covid lows, however, we can now see some cracks and we could be in for a correction back to 53000 for the rest of the year. My reasoning is as follows:
- The buying climax (BC) of the latest trading range could not make it back to the overbought line showing a lack of interest.
- Divergence on the RSI leading into the BC shows the interest to push higher is gone.
- The effort (increase in volume) with each attempt to push higher could not make higher highs.
Based on this it looks like that a break of the trendline could open the path for a drop back to 53000
Helium going to hold support ? Helium (HNT) is at weekly support.
Not far above the point of control of this range.
This is a nice time to ladder into longs. if prefer to wait until the point of control or even the weekly that lines up with te value area low (VAL).
I'm going to set alarms at these point to asses if these places are goog long opportunities.
But al that mathers offcourse is BTC. if the big lady is going down or up , alts can only follow.
Shorts at the value area high (VAH) and daily, with the golden zone looks like a confluence zone.

JSE:NED Nedbank finally on the moveNedbank has taken some time but is finally on the move to R200. Financials are making a final push and Nedbank is one of the stronger banking stocks. Look for a final push into support likely to become resistance.

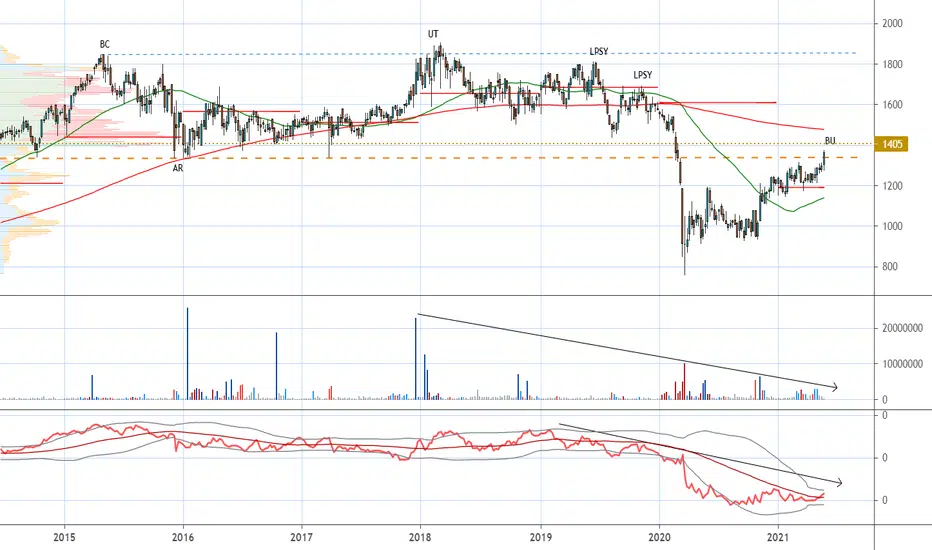
JSE:SATRIX FINI Don't Get Swept Up in the ExcitementLast week the JSE Financials were on the move but before jumping on the train a word of caution. If one looks back to 2015 we see a long distribution range that formed with investors getting out of South African financial stocks. The recent rise on the back of the covid drop is likely to only be a backup to this distribution range and not longer-term interest in the financials. Using SATRIX Fini as a proxy we see the volume has been declining since the upthrust (UT) that took place at the end of 2017 / beginning of 2018 highlighting the lack of interest. The relative strength to the Top40 is also declining. We are now spiking into the an area of previous high volume so it is rather time to watch and see what the reaction will be than just jumping in.
JSE:AGL Anglo American Time to Let it GoWe were looking at a markup in Anglo American - see post below - but with declining interest in the stock, divergence on the volume RSI and break of the 50 Day SMA I think this stock is ready for a pullback probably to R400.
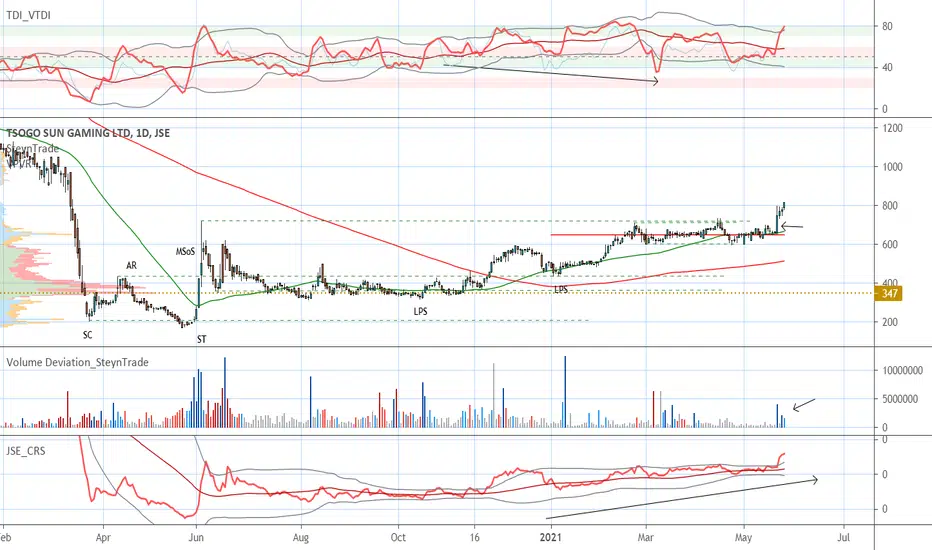
JSE:TSG Tsogo Sun Gaming Breaking OutTsogo Sun showed a major sign of strength (MSoS) in June 2020. We are now breaking the highs of that push with a significant bar on some volume. This opens some upside potential with the next major resistance level at around R20. Using the significant bar and yearly pivot point as stop loss (SL) gives a great risk-reward trade.
JSE:ABG ABSA Looking for Buying ClimaxWatching ABSA's recovery from the covid lows - see posts blow from December - back to a previous resistance level around R150 we are now seeing the last push into this level. I will be watching for a buying climax (BC) on volume to get out.

EURUSD | LONG | Areas of InterestTrend: Bullish
Retail Sentiment: 81% Short
LP Sentiment: 30% Long
Moving into Wednesday my sentiment still has not changed. Bullish on EUR until I am bearish 😒
For all my followers I wanted to provide content that can enable you to become a better trader. My Areas of interest are defined by looking for volume imbalances in the market 👨🏾💻
I will be focused on the buy-side (green) areas of interest. As an intraday trader, I will be looking for a good setup to trade back into the trend. Sell-side areas are great for exits 🕵🏾♂️
Happy Trading
Regards
LBM

ETH: Goat entry at 1300Check out my previous idea, where I called out an excellent short opportunity. I entered at around 2000, and have since closed the trade at 2650
It is hard to predict where we will go from here, but my gut tells me we will test major support at around 1300, so that is where my buy order sits. From there, I think we will bounce to test 1850 again, and that is roughly where I will close that trade. Beyond that, who knows!
Good luck!

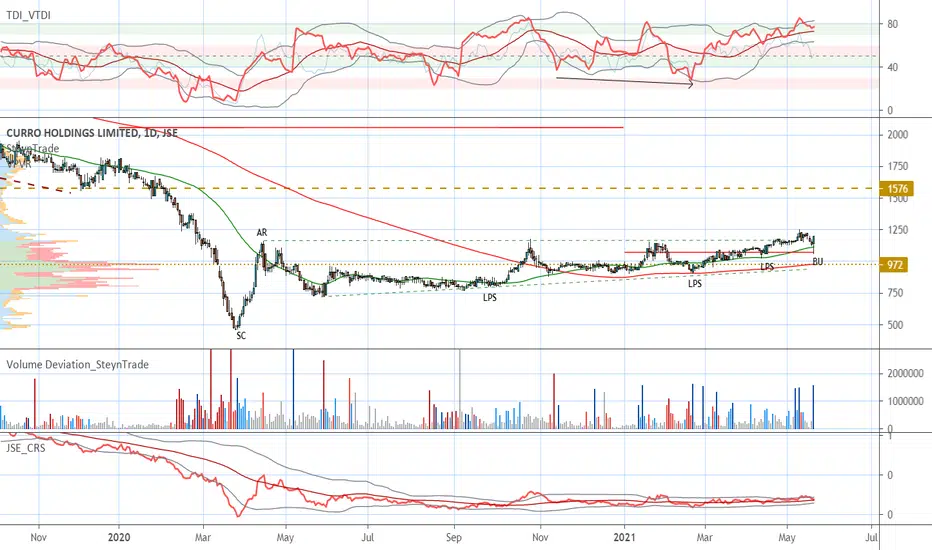
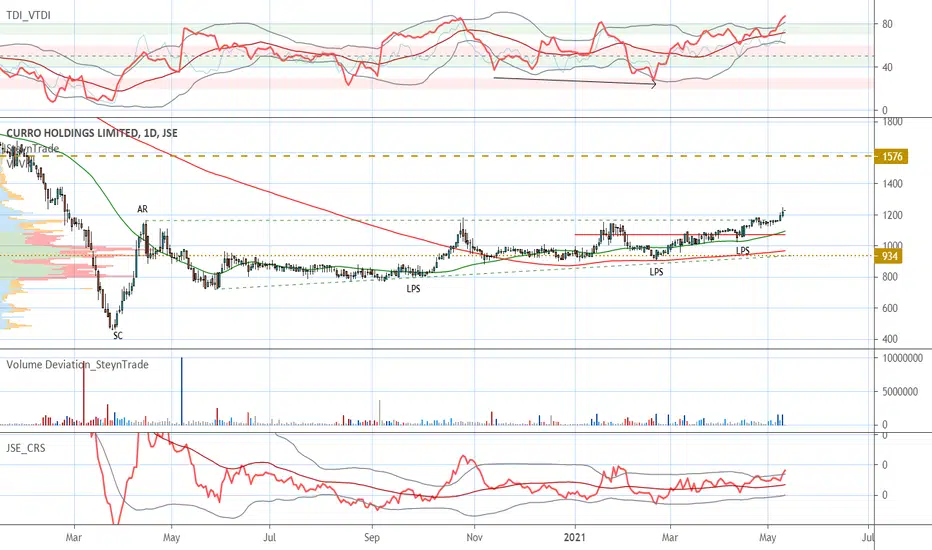
JSE:COH Curro Significant BarToday there was a significant bar in Curro Holdings with volume. A spring-like action from the yearly pivot point also forms a backup to the breakout of the accumulation trading range. Now we are expecting a quick markup to around R16. This confirms the previous evaluation provided in the post below.
JSE:GFI Gold Fields Time to Look at Gold Stocks AgainAfter a significant pullback in gold stocks, there are some good signs of strength with Gold Fields one of the strongest and above its yearly pivot point. On the pullback, buyers stepped in below R150 of GFI. Price has pushed out of the trading range formed after the pullback with some significant bars. Other gold stocks are showing similar signs. With these signs, it is now a good time to look for good entry levels on a pullback to the accumulation trading range on a number of stocks. For Gold Fields, this is also the yearly pivot point.

JSE:SDO Stadio Holdings Rather Late than NeverStadio Holdings has been on a downward trend but with the Covid drop, something changed. The trading range indicated lots of buying with no spring and only higher highs at the last points of supply (LPS). The backup (BU) to the trading range was also very shallow. Now the price is already in the markup phase. However, there is still strength in the chart with an upsloping accumulation trading range in the markup. The next level of resistance is at R4 so there is still some potential from the current levels and given the current strength could indicate that even that resistance could be broken for a longer timeframe trade.

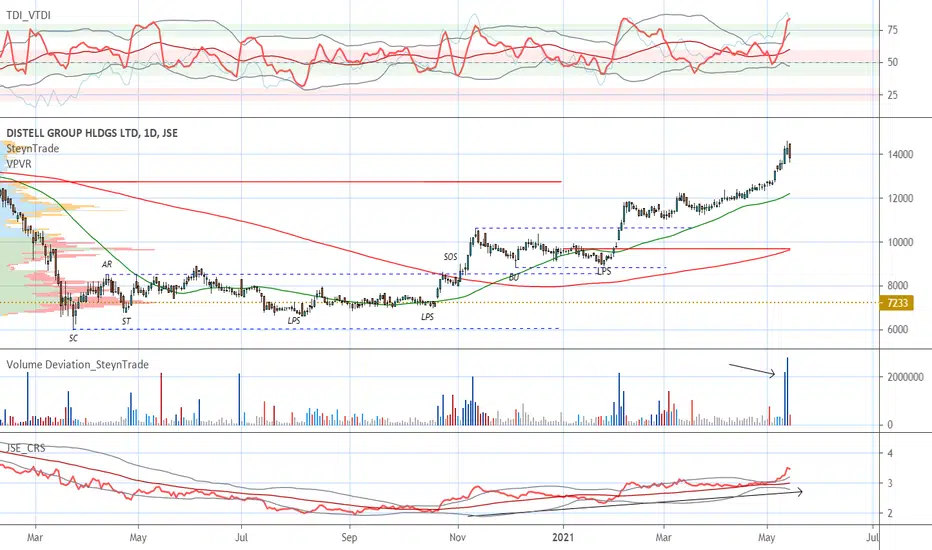
JSE:DGH Time for a RestAfter starting to follow Distell early in December 2020 the stock has made good progress from R100 - see posts below following the progress. However, last week there was a high volume spike above R140 pushing it back below this level. This could indicate a time for the stock to form a trading range with some profit-taking holding price back. We will have to watch how this plays out to see if it is an accumulation trading range.
JSE:CFR Richemont Markup Set to ContinueThis month, I looked at Richemont as an investment stock to follow during the mark-up on a weekly chart - see post below. At the time I felt a pullback to R120 was possible but looking at price action last week it looks like the stock could already be ready to mark up further. In the smaller trading range on the daily timeframe, we have seen a spike in buying with volume below R146. A clean break of R148 could quickly push us higher.

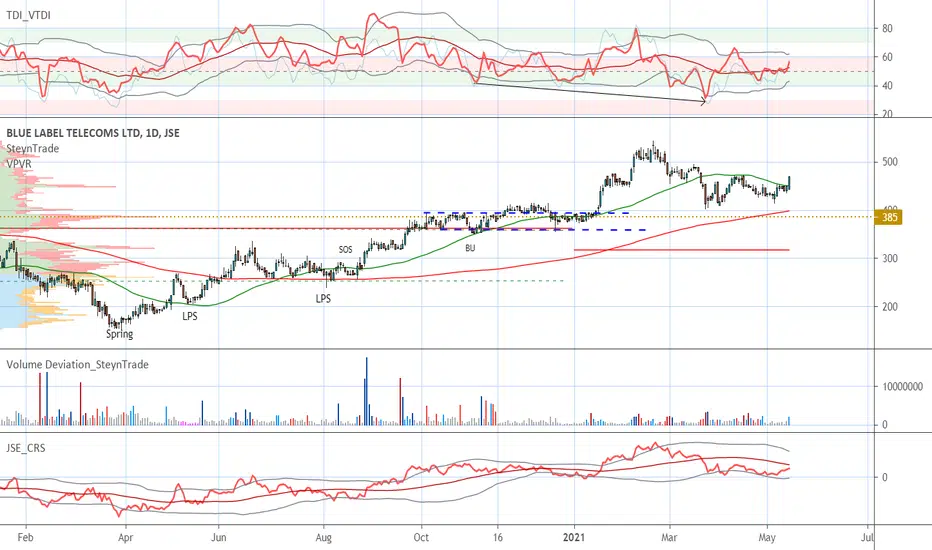
JSE:BLU Blue Label Telecoms Still Grinding Its Way HigherIt has taken some patience but Blue Label seems to be ready for the next push higher. Seeing the buying in November 2020 - see posts showing progression below - we expected a substantial increase. After reaching an area of historic resistance and pullback to R4 we are now again ready to push higher.
JSE:COH Curro Making Higher HighsAfter the covid low, Curro Holdings has had a good recovery. The in the trading range formed after the selling climax (SC) and automatic rally (AR) price has been making last points of supply (LPS). After the breakout of the trading range we can expect a markup to around R16.
Seting up Volume Indicators on Trading View ChartThis is basic video will show you how to set up volume indicator on a Trading View chart.

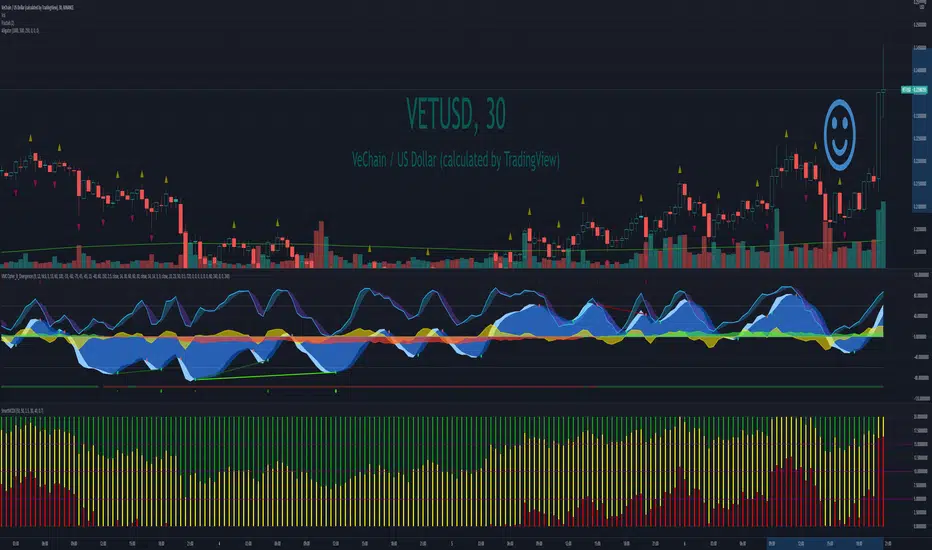
VETUSD Vechain Almost Finished Consolidating. Volume Picking UpThis has a bit more to go to take out resistance at the top. It should break the top in the next few days if BTC can hold above 55800. The volume is picking up and institutional money is coming in (see the red at the bottom mcdx indicator). Get your alarms ready or set a buy order for the next 5% retracement, it may be the last one before the run up.
JSE:IVT Invicta Looking for a break of R22Invicta has had a reaccumulation and after breaking R19 backed up to the trading range. We are now looking for a break of R22 for the next push higher. See posts below for the analysis following the trend up.
