XAGUSD Weekly Technical Analysis Breakdown (MMC Style) + Target📈 Chart Summary:
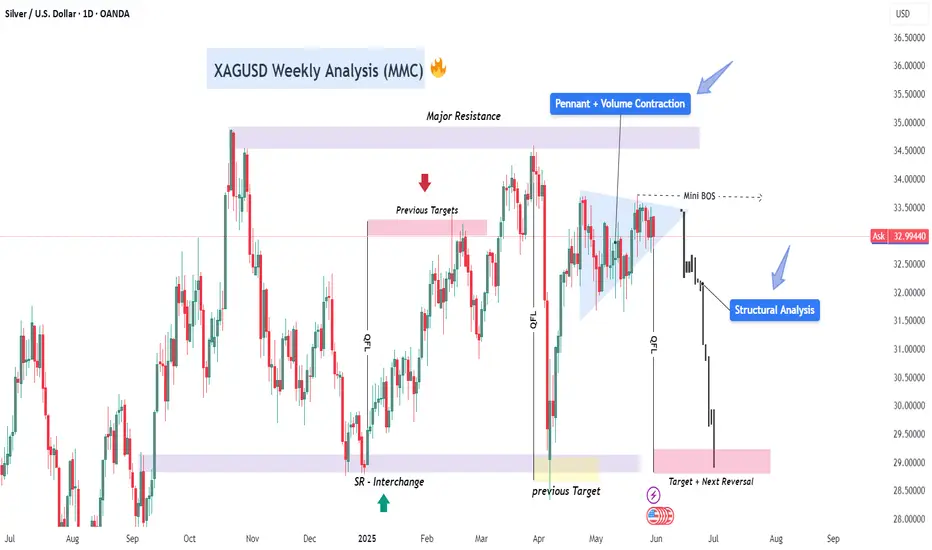
The chart shows the price action of Silver (XAG/USD) on the daily timeframe, capturing a significant shift in market sentiment. This analysis is based on the MMC (Market Maker Cycle) concept and a combination of Smart Money Concepts, Pennant Structure, and Volume Contraction patterns.
Over the past weeks, XAGUSD has transitioned from accumulation and markup to distribution and markdown, suggesting that smart money has exited long positions and is now pushing price toward discount zones for future reaccumulation.
🔍 Detailed Breakdown:
🔹 1. Major Resistance Area – The Selling Origin
At the top of the chart, we see a major resistance zone near $35–$36, which acted as a structural ceiling for months. Each time price approached this area, sellers stepped in aggressively, rejecting price and creating long wicks.
This level represents institutional supply—where big players offload positions, often leaving a liquidity trail behind for later use.
🔹 2. Pennant Formation + Volume Contraction – Classic Distribution
From late April to mid-May, Silver formed a pennant structure, a well-known consolidation pattern. What's special here is the volume contraction—a subtle clue that buyers are drying up while sellers prepare for a large move.
This is a classic Wyckoff distribution behavior:
Buyers are lured in as price moves in a tight range.
Breakout traders enter early expecting a bullish continuation.
Institutions trap liquidity before dumping price into inefficiency.
The mini Break of Structure (BOS) to the upside acted as a false breakout, perfectly engineered to trap liquidity above the pennant.
🔹 3. Structural Breakdown – Momentum Shifts Bearish
Once the trap was complete, price reversed with strong momentum, breaking past key supports and violating internal structure. The label "Structural Analysis" marks the beginning of this break in market structure, confirming the change in character.
This shift aligns with Smart Money’s "Manipulation → Distribution → Expansion" logic.
We also note how price broke below the SR-interchange zone, where support became resistance—a powerful reversal confirmation.
🔹 4. Target + Next Reversal Zone – The Magnet
Currently, Silver is headed toward the $29–$28 zone, highlighted in red as the "Target + Next Reversal" area.
This level has high confluence:
Acts as a previous QFL (Quasimodo Failure Level).
Has unmitigated demand.
Matches with earlier lows where smart money likely accumulated positions.
Here, we can expect either a strong bounce or short-term consolidation before the next directional move.
📌 Confluence Zones:
Key Zone Significance
$35–$36 Major Resistance (Supply / Exit zone)
$33.5 Mini BOS & Liquidity Trap Area
$31.8 – $32.5 Structural Break Zone (Old Demand Broken)
$29 – $28 Target + Reversal (High Confluence Zone)
🧠 Smart Money Perspective:
This entire sequence is not random—it’s engineered.
Institutions:
Collected orders at the bottom.
Pushed price up to resistance.
Consolidated in a pennant to build liquidity.
Triggered a false breakout to trap late buyers.
Dumped aggressively, targeting previous lows for re-entry.
This is the Market Maker Cycle in action — and we’re in the Distribution to Markdown phase right now.
🎯 Trading Plan:
Short-Term Bias: Bearish until $29–$28 is reached.
Swing Traders: Look for signs of reversal in the $28–$29 zone (bullish engulfing, FVG fill, or demand reactivation).
Day Traders: Watch for pullbacks to the $32.5–$33 resistance zone to enter continuation shorts.
🧵 Final Thoughts:
This is a textbook example of how Smart Money manipulates structure, traps liquidity, and moves price in phases. Patterns like pennants, BOS, and SR flips, when combined with volume and context, give us clear directional bias.
If you're still chasing the breakout without understanding the setup behind it, you're trading against those who engineered the move. Understand the structure — or get trapped by it.
Volumecontraction
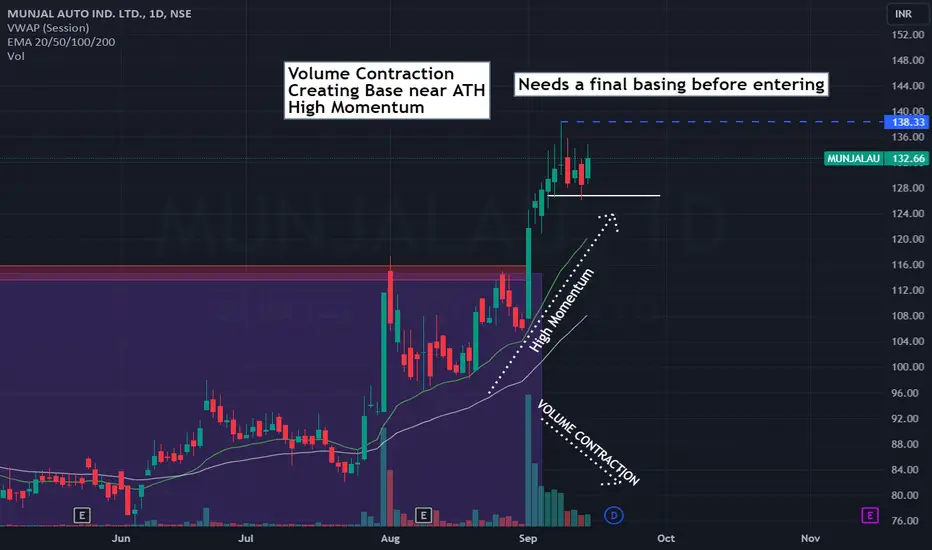
MUNJALAU | SWING | LONGVolume Contraction
Creating Base near ATH
High Momentum
Needs a final basing to plan entries
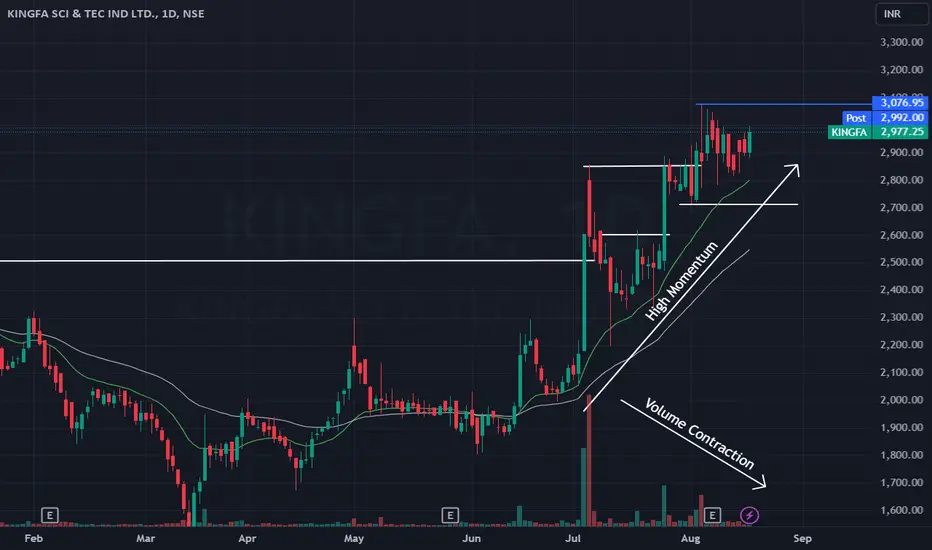
KINGFA | VOLUME CONTRACTION | HIGH MOMENTUMCreating a nice base near highs
Volume contraction
High Momentum
Caution:
Overall market conditions are highly volatile which can impact the trade idea
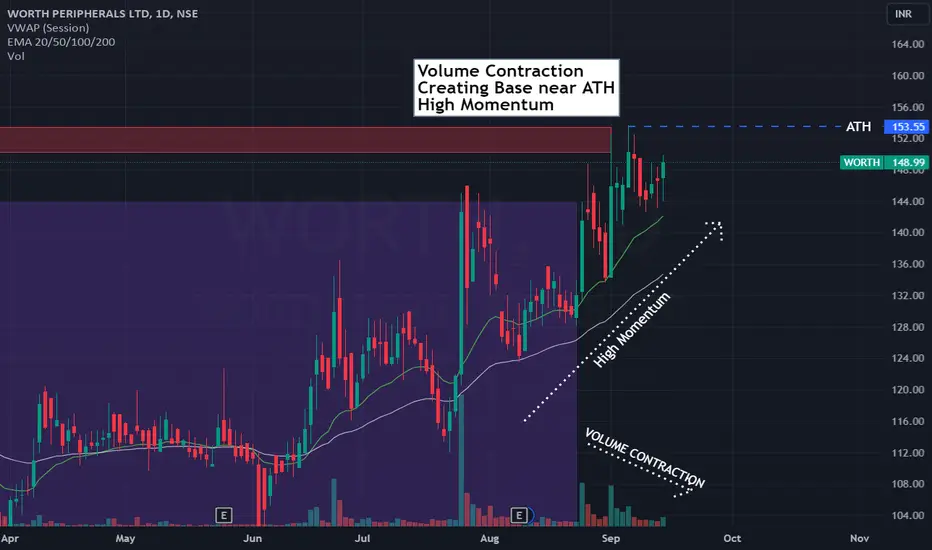
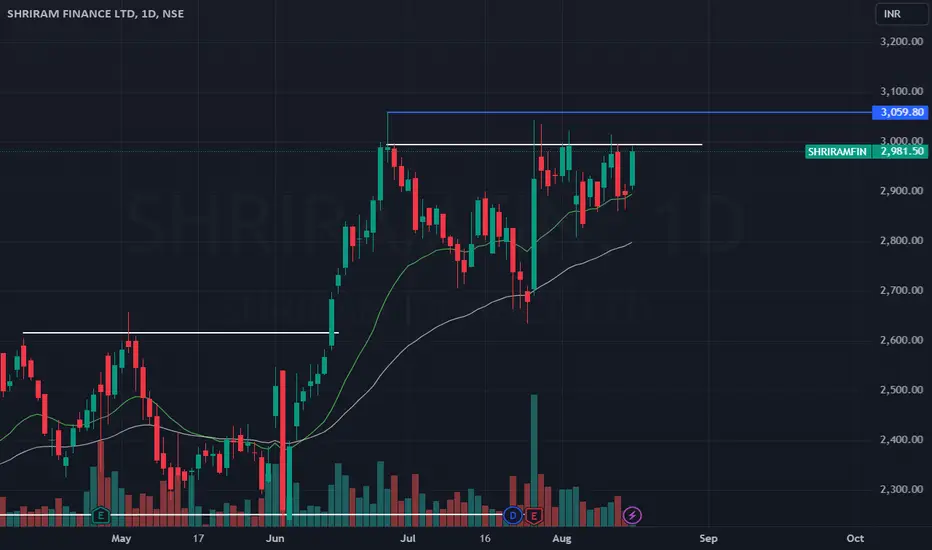
SHRIRAMFIN | SWING | LONGCreating a nice base near highs
Volume contraction
Negative:
EMA's Flatting which means the price is lacks momentum
Caution:
Overall market conditions are highly volatile which can impact the trade idea
IIFLSEC potential breakout Strong buying force followed by VCP formation.
Price trading in tight range.
Volume contraction.
Low risk entry.

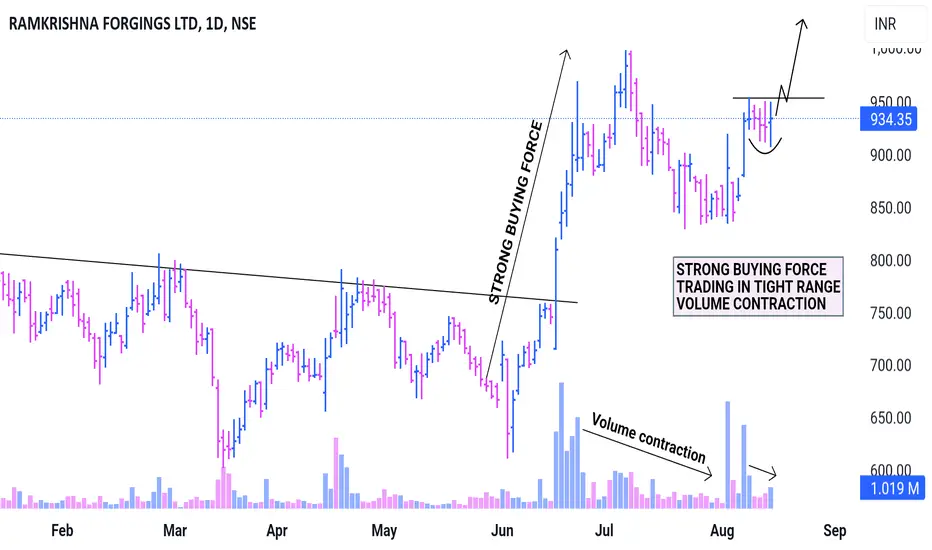
RKFORGE potential breakout POSITIVE POINTS:-
Strong buying Force.
Trading in a narrow range.
High relative strength.
Took support from 50EMA & now above 20EMA.
Volume contraction & institutional footprints visible.
NEGATIVE POINTS:-
Overall market condition is not favorable for breakout trading. Key indices are near 50EMA, there could be a potential break down in the coming days. No follow through moves were seen in last few days.
KOS formed a nice base, waiting to break outKOS has been consolidating nicely the last few day and forming a handle that is coupled with volume contraction. Relative strength is strong on this stock - with volume it can easily clear $8.50 and higher

HAL about to break out from a stage 2 baseHAL is showing incredible strength, with a cluster of RS before new highs and even after a day of significant selling, price still held the short term uptrend that also forms the handle in this cup and handle pattern. Over $42.60 and this stock sees new ATHs with just over a month to go before earnings; HAL has done well on the last 4 earnings and in this current market this looks likely to happen again. Volume has been contracting during this accumulation phase, but this stock looks ready for a strong next leg up

RELIANCE price action analysis - bullishNSE:RELIANCE did a breakout recently and made all time high. Looking at hourly timeframe it looks like it's consolidating and forming a bullish flag pattern. Volume is also contracting while the price is consolidating.
There's a gap to be filled from 2395 to 2412. It had a chance to fill it on 8th september but the price reversed from 2406. It would be interesting to see what happens next week. It might give a fake breakdown to fill the gap and then reverse strongly trapping bears. Hoping for a break from a bull flag structure with a volume influx. Happy trading!
