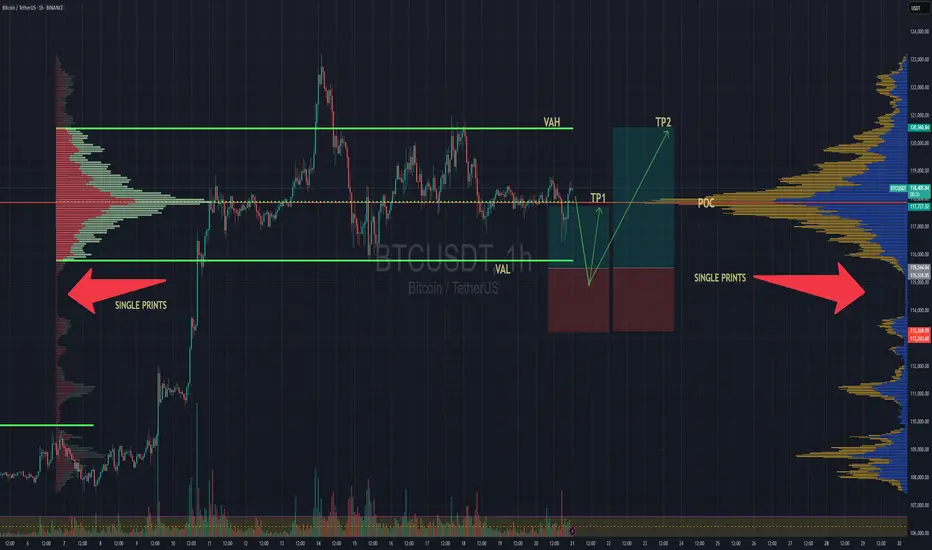
BTC Balanced Volume Profile BTC is now trading in a textbook D-Shape Volume Profile. In english - Buyers & Sellers are happy to transact here and will stay inside the value area & consolidating sideways until further notice.
Consolidation at POC is a signature of this profile, and one of the easiest and least stressful trade setups because now, your mission, should you chose to accept. Is to fade the Highs (VAH) and Lows (VAL) and avoid the middle unless you love donating money to the market.
I'll have buy limit orders waiting right below the VAL where we have the single prints. It doesn't get any easier than this.
Doesn't mean price cant rip through, but this is always the best entry with less risk, especially when the single prints have not been tested yet..
BINANCE:BTCUSD CME:MBT1!
Volumespreadanalysis
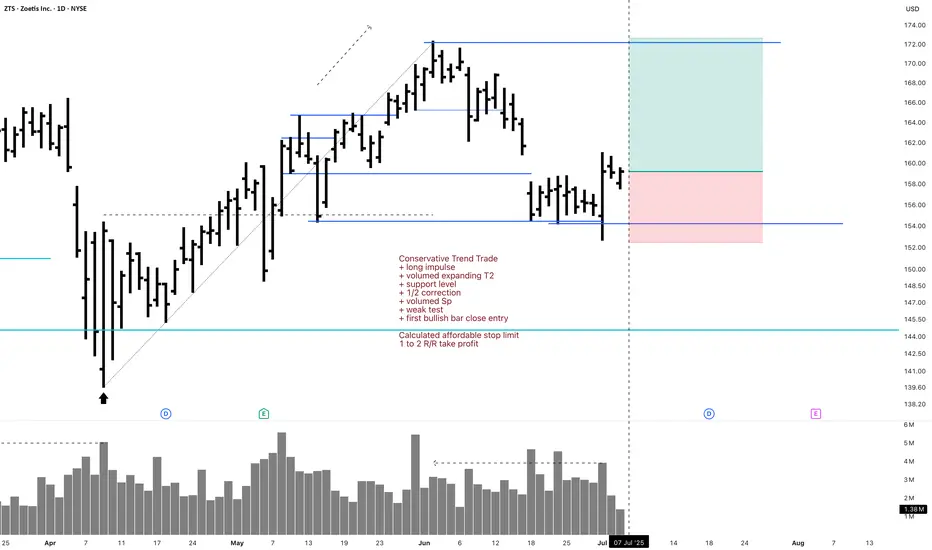
ZTS Investment 1D Long Conservative Trend TradeConservative Trend Trade
+ long impulse
+ volumed expanding T2
+ support level
+ 1/2 correction
+ volumed Sp
+ weak test
+ first bullish bar close entry
Calculated affordable stop limit
1 to 2 R/R take profit
Monthly trend
"+ long impulse
+ ICE level
+ support level
+ 1/2 correction
+ volumed 2Sp
+ weak test?"
Yearly trend
"+ long impulse
- correction"
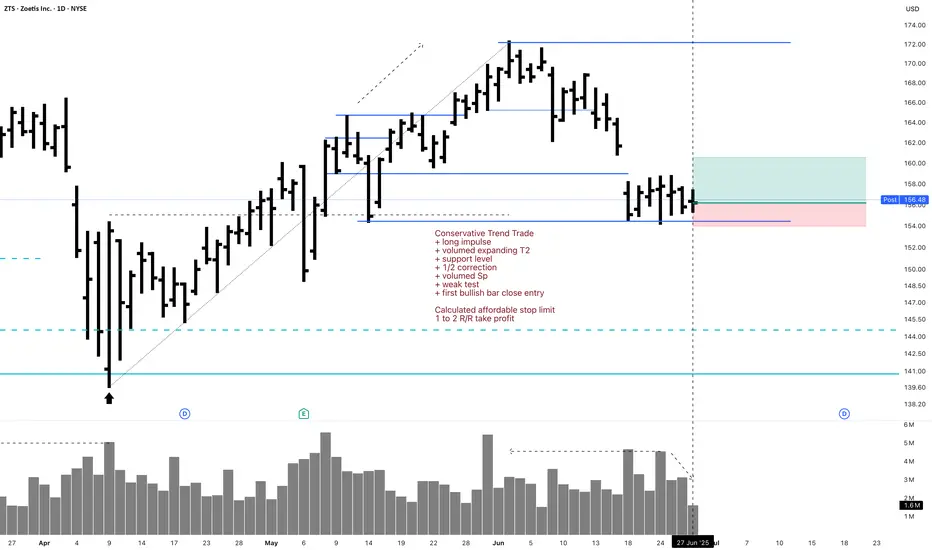
ZTS 1D Investment Conservative Trend TradeConservative Trend Trade
+ long impulse
+ volumed expanding T2
+ support level
+ 1/2 correction
+ volumed Sp
+ weak test
+ first bullish bar close entry
Calculated affordable stop limit
1 to 2 R/R take profit
Monthly Trend
"+ long impulse
+ T2 level
+ support level"
Yearly Trend
"+ long impulse
- correction"
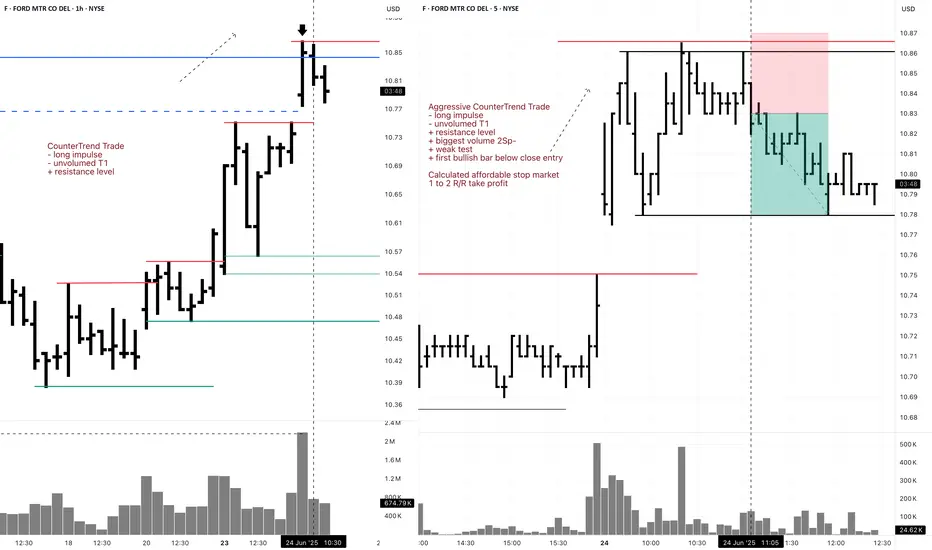
F 5M Long Daytrade Aggressive CounterTrend TradeAggressive CounterTrend Trade
- long impulse
- unvolumed T1
+ resistance level
+ biggest volume 2Sp-
+ weak test
+ first bullish bar below close entry
Calculated affordable stop market
T2 5M take profit
1H CounterTrend
"- long impulse
- unvolumed T1
+ resistance level"
1D CounterTrend
"- long impulse
- unvolumed T1
+ resistance level"
1M CounterTrend
"+ short impulse
- exhaustion volume
+ T2 level
+ resistance level
- unvolumed interaction bar
- reaction bar looks to close bullish in 6 days"
1Y CounterTrend
"+ long impulse
+ volumed T2 level
+ volumed 2Sp+
+ 1/2 correction
+ weak test"
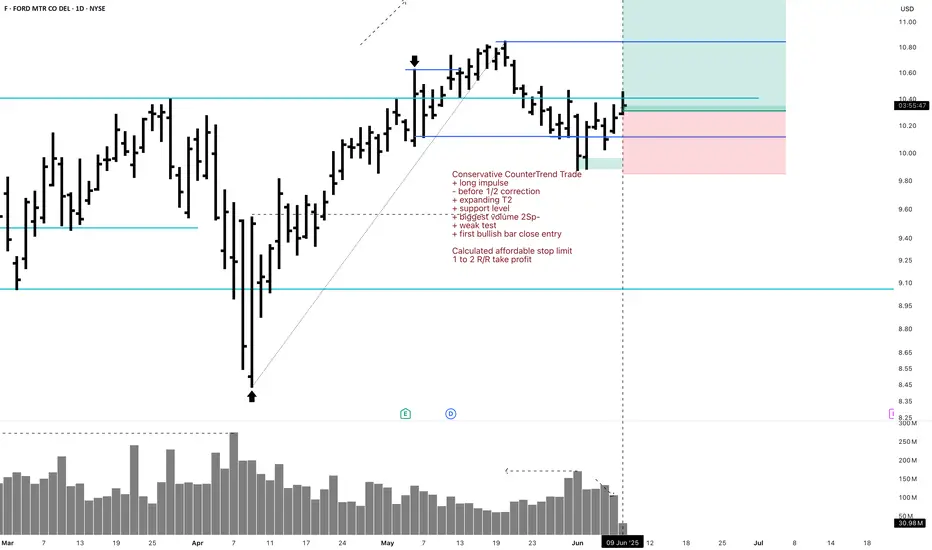
F Investment 1D Conservative CounterTrend TradeConservative CounterTrend Trade
+ long impulse
- before 1/2 correction
+ expanding T2
+ support level
+ biggest volume 2Sp-
+ weak test
+ first bullish bar close entry
Calculated affordable stop limit
1 to 2 R/R take profit
Monthly CounterTrend
"- short impulse
+ 1/2 correction
- unvolumed T2
- resistance level
+ unvolumed interaction bar"
Yearly Trend
"+ long impulse
+ volumed T2 level
+ volumed 2Sp+
+ 1/2 correction
+ weak test"
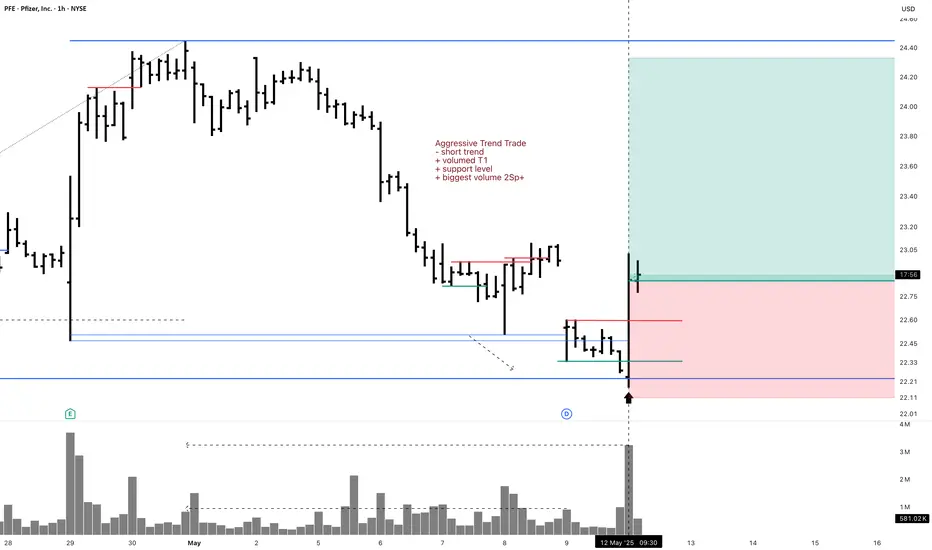
Aggressive Trend Trade 1HAggressive Trend Trade 1H
- short trend
+ volumed T1
+ support level
+ biggest volume 2Sp+
Daily Trend
+ long impulse
+ T2 level
+ support level
+ 1/2 correction"
Monthly CounterTrend
"- short balance
+ expanding ICE
+ support level
+ unsuccessful biggest volume manipulation"
Yearly Trend
"+ long impulse
+ 1/2 correction
- below exhaustion volume?
- below SOS"
Will add more when 5M, 1H or 1D will show entry point
A Follow up to: “Adjustments for Better Readings & VSA vs BTC"When a trend approaches its end, we typically observe the formation of a buying or selling climax. That was certainly the case during Wyckoff’s era. Everything he described—market manipulation, signals, footprints—remains relevant today. But you know what that also means: if it's out there, it’s old news.
Yes, this is still happening, but we need to acknowledge that this information is no longer exclusive. And when a method becomes well-known—especially among retail traders—it can be used against them. Wyckoff himself hinted at this: the manipulators can and do use these same technical patterns to deceive. His real message?
“Keep an open mind.”
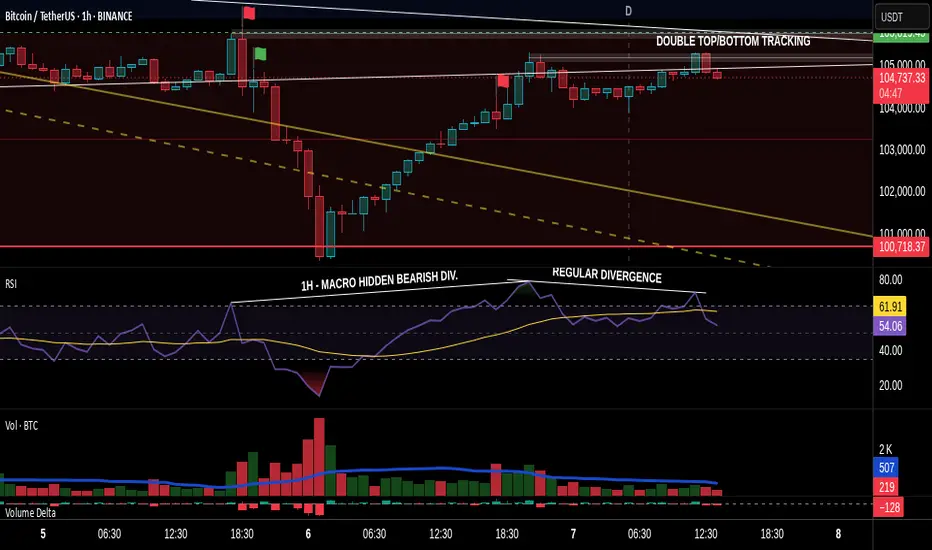
📉 In our current BTC chart, we’re seeing a textbook example of potential manipulation. A selling climax is visible—normally a sign of trend exhaustion and a bullish reversal. But is that really the case here? Did the downtrend truly end?
On the 1-Hour timeframe, both the RSI and volume indicators suggest otherwise: a bearish continuation seems more likely.
🧱 We're also witnessing a real-time formation of a Double Top pattern, taking shape since June 6. Measured by body candle spreads (excluding wicks), we observe four touches within a key price rectangle. These align with a known candlestick pattern: the Tweezer Top, commonly associated with bearish reversals.
What’s more, all of this is happening within a supply zone—actually three marked zones on the chart. The most recent zone shows signs of offloading pressure, amplified by both the Double Top and bearish candlestick formations.
And I haven’t even touched on the rejection wicks or how bearish volume spikes are gaining strength. That’s where the principle of Effort vs. Result comes in—remember, nothing in the market is free.
📊 In line with our past two posts, note how price action (PA) shows equal highs while RSI diverges, reinforcing earlier signals. The signs are stacking up.
So, the critical question now is:
Are we heading below the $100.718 level for a confirmed Head & Shoulders pattern?
Or is this just a retest before another move?
If this way of reading the market resonates with you and you want to go deeper—whether it’s building confidence or spotting signals before they play out—I work with a small circle of traders sharing TA privately on a daily basis. Feel free to reach out.
Till next time be well and trade wisely!
PLUG 1D Investment Long Aggressive Trend TradeAggressive Trend Trade
- short impulse
+ volumed TE / T1 level
+ support level
+ biggest volume 2Sp-
+ weak test
+ first buying bar close level
Calculated affordable stop limit
1 to 2 R/R take profit
Monthly Trend
"+ long impulse
+ support level
+ T2 level
+ biggest volume reaction bar
= below 1/2 correction"
Yearly CounterTrend
- short impulse

PLUG 1H Long Swing Conservative Trend TradeConservative Trend Trade
+ long impulse
+ 1/2 correction
+ volume zone
- strong approach
+ ICE level
+ support level
+ volumed Sp
Calculated affordable stop limit
1 to 2 R/R take profit
Daily Trend
"- short impulse
+ volumed TE / T1 level
+ support level
+ biggest volume 2Sp-
+ weak test"
Monthly Trend
"+ long impulse
+ support level
+ T2 level
+ biggest volume reaction bar
= below 1/2 correction"
Yearly CounterTrend
- short impulse
Will add more after successful test on 1H and / or after test completes on 1D.

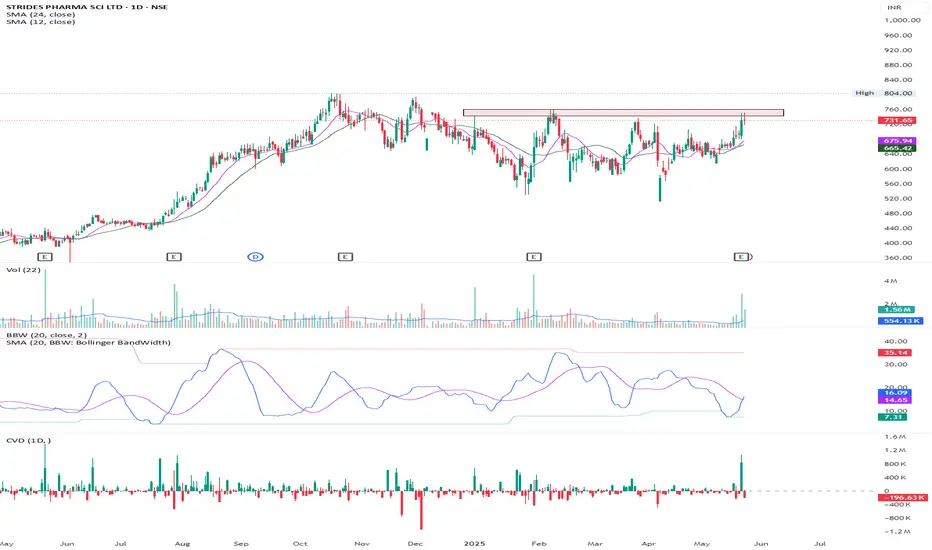
STAR breakout candidateThis is the chart of Strides pharma science ltd. The stock currently is trading sideways.
Stock has approached the resistance with very high relative volume.
Stock has continuously performed financially well with triple digit earnings growth and margins expansion.
The recent approach to resistance with very high relative volume suggests a high probability for breaking out resistance zone because the stock has very high earnings but not reflected in price hence the reason. Keep watching the stock.
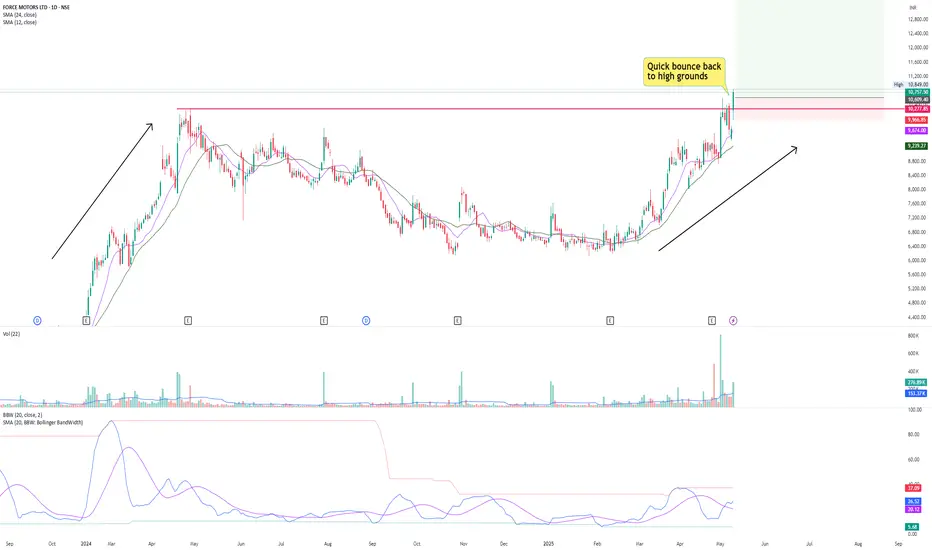
Force motors a strong stockThis is what a strong stock looks like in volatile market. Quick bounce to new high ground after a short pullback.
Due to market pressure stock briefly crossed all time highs but came back in the same day of breakout.
But now as the geopolitical situation improved stock quickly bounced back to all time highs with high relative volume. This shows the strength in stock and kind of support to stock.
Keep watching NSE:FORCEMOT
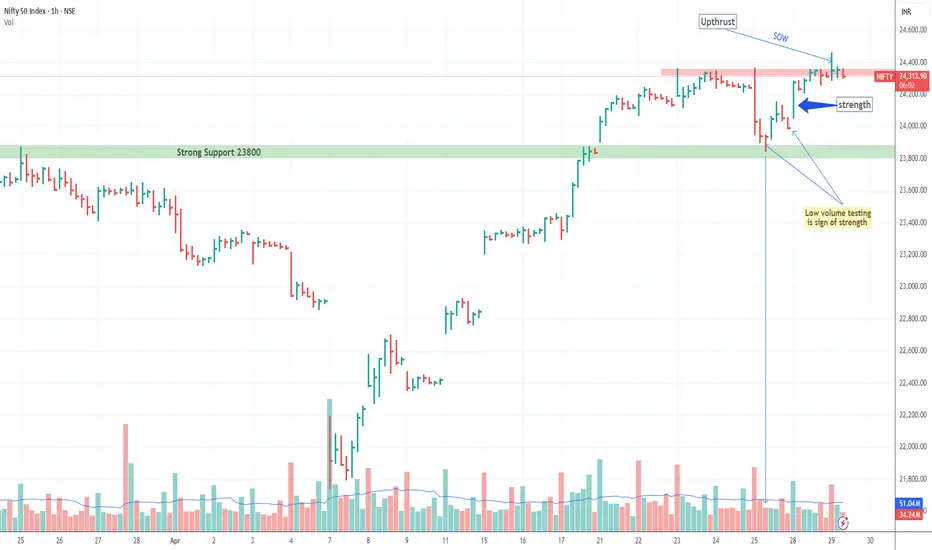
is selling being absorbing near 23350 level ?yesterday 27 April I mentioned that nifty must have to break & sustained 23350 level it happened today but long upper wick on hourly time with high volume been noticed showing selling pressure in market of course market bullish momentum still intact it respected the near 23800 level trading above 20 EMA but we need to wait more multiple testing for confirmation to continue upside journey so consolidation may happen in 2-3 days.
INTEL DROP --- FIELD COMM LOG #02242025🪖 WAR ROOM DISPATCH — FIELD REPORT FROM CAMP JARVIS & CAMP LIVERMORE
Date: 4/24/2025
Status: STANDBY
Volume: Normal
Current Order: HOLD
⚔️ SUMMARY OF ENGAGEMENTS – LAST 30 DAYS
The battlefield has been blood-red. Abnormal reactions litter the map. Morale was tested—but our troops never broke. The Red Army pushed hard, exploiting weakness, creating chaos. Yet we held.
📍Camp Jarvis
Coordinates: 115.10
☑️ Status: HOLD
📈 Trend: UPTREND
📊 ATR: Tightening (3.39)
🟩 Zone: Top of box: 115.10 | Bottom: 86.62
📢 Latest: “We’re nearing breakout. Position secure. Scouting volume now.”
Jarvis is seeing a shift—momentum is whispering beneath the soil. There's life stirring. But RSI is low (sub-45). This isn't the time for heroes—it’s a time for patience. Let the weak exhaust themselves.
📍Camp Livermore
Position: Natural Reaction Zone
☑️ Status: HOLD
📉 Trend: Weak uptrend but too early to act
🔄 Recent movement: Mixed signals, sporadic action, no confirmation.
Livermore's forces are strong in discipline, but not yet in numbers. They report: “Volume’s stable, but not convincing. We’ll move when the field confirms it—not before.”
📛 INTEL WARNING
The maps are clear—we are not in breakout yet.
There’s a false calm in the air.
Do NOT chase. Do NOT preempt.
This is how armies get slaughtered in the fog.
💡 Key Quote from Command:
“The Red Army still has strength. We’re holding—but holding isn’t winning. We wait for the flinch. The break. The rally cry. That’s when we move.”
🎖️ Current Position: HOLD
🛡️ Camp Jarvis: Monitoring breakout zone
🧭 Camp Livermore: Awaiting troop confirmation
📉 RSI low, Trend early
🔕 No All-Signal-Go confirmed
🚨 Mixed Signals = DO NOT ADVANCE
The war is not over.
But neither are we.

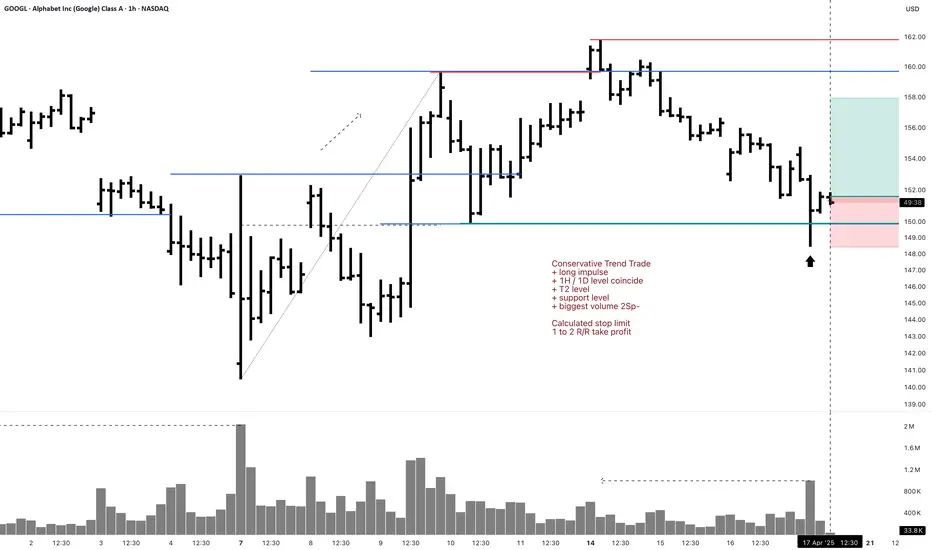
GOOGL 1H Swing Long Conservative Trend TradeConservative Trend Trade
+ long impulse
+ 1H / 1D level coincide
+ T2 level
+ support level
+ biggest volume 2Sp-
Calculated stop limit
1 to 2 R/R take profit
Daily Trend
"+ long impulse
+ JOC test / T2 level
+ support level
+ 1/2 correction"
Monthly Trend
"+ long impulse
+ T2 level
+ support level
- before 1/2 correction"
Yearly Trend
"+ long impulse
- T1 level
- resistance level"
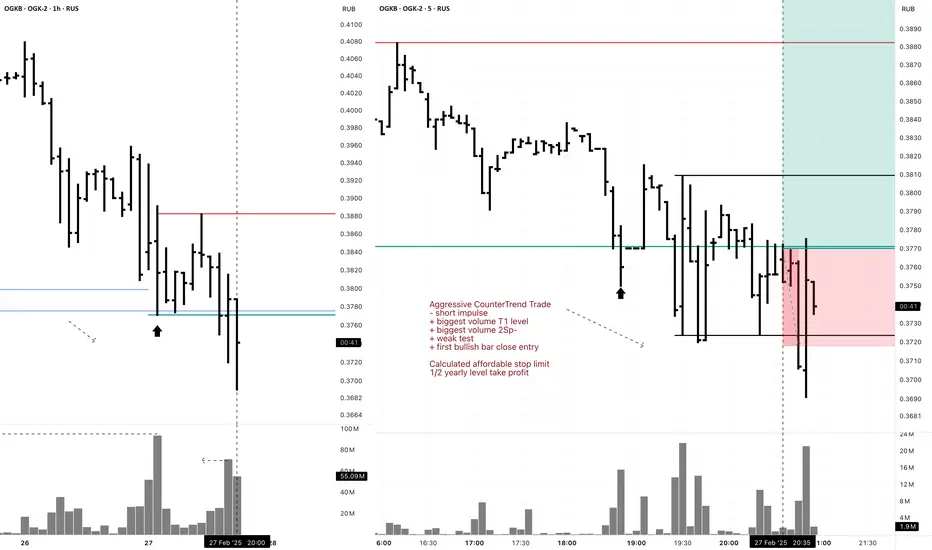
OGKB 5M Investment Aggressive CounterTrend TradeAggressive CounterTrend Trade
- short impulse
+ biggest volume T1 level
+ biggest volume 2Sp-
+ weak test
+ first bullish bar close entry
Calculated affordable stop limit
1/2 yearly level take profit at 0.459
1H Counter Trend
"- short impulse
+ biggest volume TE / T1 level
+ support level
+ volumed 2Sp-"
1D Trend
"+ long impulse
+ JOC level
+ support level
+ 1/2 correction
+ volumed manipulation"
1M Trend
"+ long impulse (in 1d 4h)
+ neutral zone"
1Y CounterTrend
"""- short impulse
+ 2Sp-
+ perforated support level"""
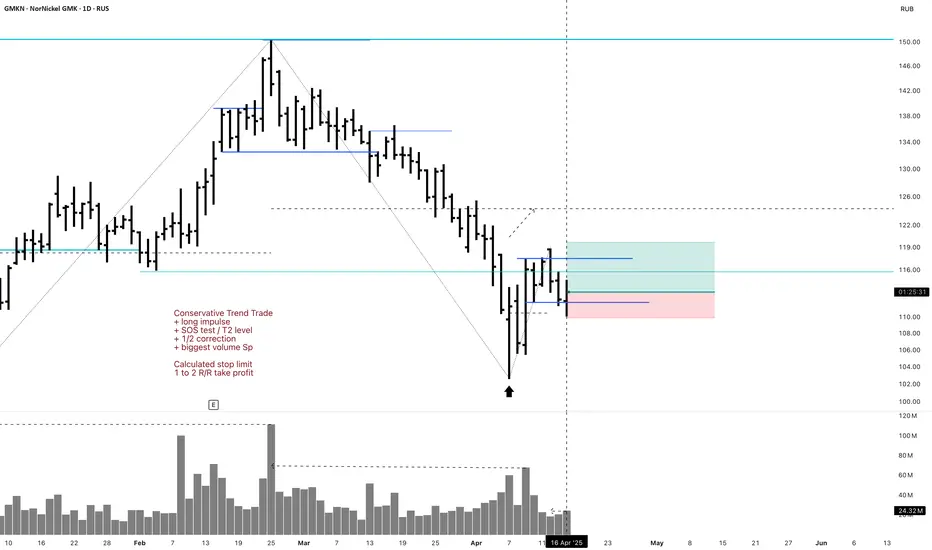
GMKN Long 1D Investment Conservative Trend TradeConservative Trend Trade
+ long impulse
+ SOS test / T2 level
+ 1/2 correction
+ biggest volume Sp
Calculated stop limit
1 to 2 R/R take profit
Monthly Trend
"+ long impulse
- SOS reaction bar level
+ 1/2 weak correction"
Yearly Trend
"+ long impulse
- below SOS
+ 1/2 correction"
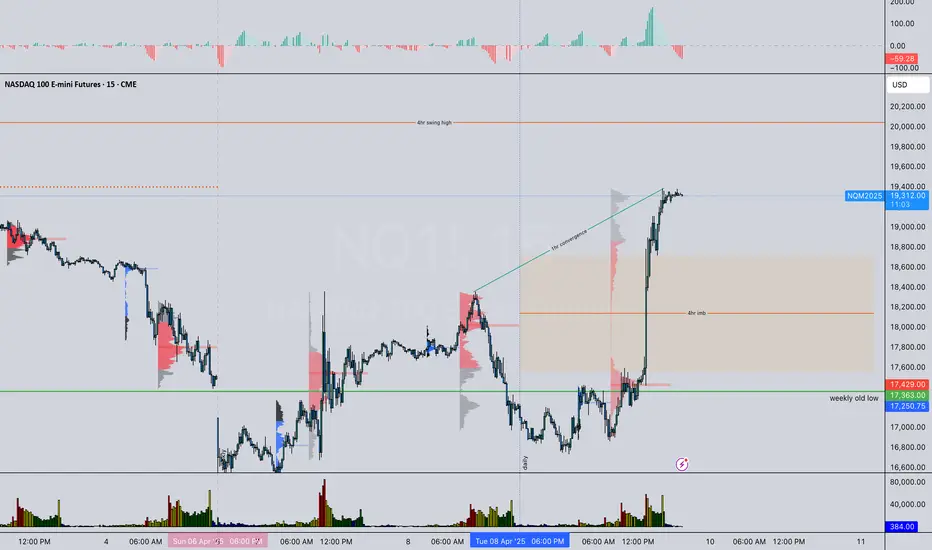
Are getting strong 4 long lol??✅ Summary of Top-Down Analysis:
🟢 Daily (Macro Bias):
Bias: Neutral → Leaning Bullish
Context:
MACD and price both made lower lows (convergence = no divergence, but momentum weakening).
Price hit strong support at 16,457.
Bullish close post-FOMC + macro catalyst (Trump’s tariff changes) = positive sentiment.
Key note: China-specific tariff at 125% could inject volatility, possibly sector-specific.
🟠 4HR:
Bias: Bullish
Confluence:
Higher high in price and MACD = bullish momentum confirmed.
Price reclaimed structure after failed low.
Approaching last week's POC → possible liquidity grab + continuation.
4HR bullish imbalance could be a key reaction zone (support).
🔴 1HR:
Bias: Bullish
Context:
Clear bullish structure + MACD higher high.
Aligned with 4HR bullish flow = continuation potential.
🔵 15min:
Bias: Bullish
Micro Context:
Structure and MACD aligned → price above previous NY POC = showing strength into next session.
May look to use NY POC or VWAP pullbacks for entry.
🎯 Gameplan Suggestions:
Scenario 1 – Continuation Entry:
Look for pullbacks into 4HR imbalance zone or 15m demand + VWAP area.
Use MACD + price action confirmation for entry (e.g., engulfing, break of lower highs).
Targets: swing high above 4HR structure + liquidity zones.
Scenario 2 – Reversal Risk:
If price shows exhaustion near last week’s POC, especially with MACD divergence on lower timeframes → consider a quick short scalp or stay flat until new structure forms.
👀 Key Levels to Watch:
🔹 16,457 = macro support
🔹 Last week’s POC = near-term resistance/liquidity
🔹 Bullish 4HR imbalance zone (mark this for entries)
🔹 Previous NY POC / VWAP area = short-term entry pullback zone
IPG 1H Swing Long Aggressive CounterTrend TradeAggressive CounterTrend Trade
- short balance
+ volumed Sp
+ weak test
+ first bullish bar close entry
Calculated affordable stop limit
1 to 2 R/R take profit
Day CounterTrend
"- short balance
+ support level
+ volumed expanding ICE level"
Month CounterTrend
"- short impulse
+ support level
+ T1 level
- before 1/2 correction"
Year Trend
"+ long impulse
- correction"

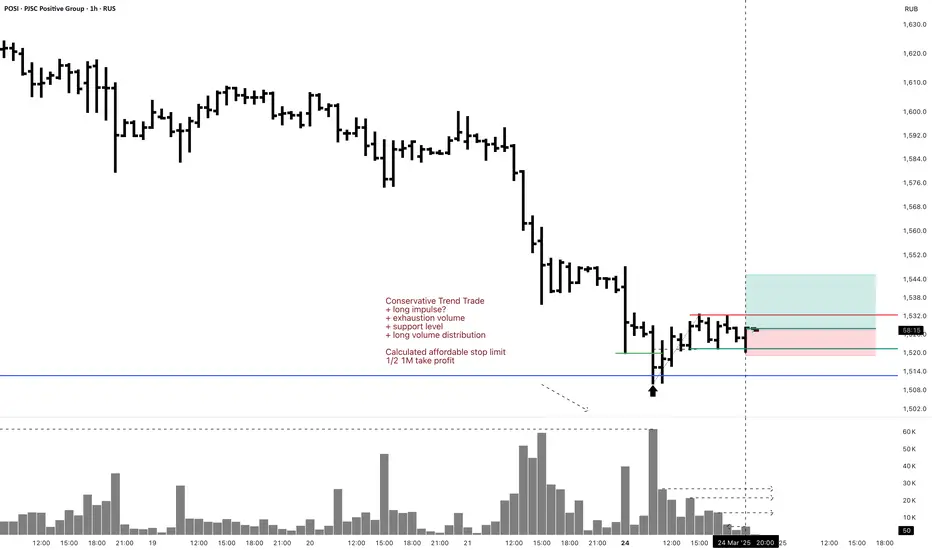
POSI 1H Investment Long Aggressive Trend TradeAggressive Trend Trade
- short impulse
+ exhaustion volume
- resistance level
+ long volume distribution
Calculated affordable stop limit
1/2 1M take profit
1D Trend
"+ long impulse
+ support level
+ T2 level?
+ 1/ 2 correction
+ weak approach"
1M Trend
"+ long impulse
+ 1/2 correction
+ biggest volume expanding T1
+ support level
+ biggest volume manipulation"
1Y Impulse
+ long impulse

POSI 1H Swing Long Conservative Trend TradeConservative Trend Trade
+ long impulse?
+ exhaustion volume
+ support level
+ long volume distribution
Calculated affordable stop limit
1/2 1M take profit
1D Trend
"+ long impulse
+ support level
+ T2 level?
+ 1/ 2 correction
+ weak approach"
1M Trend
"+ long impulse
+ 1/2 correction
+ biggest volume expanding T1
+ support level
+ biggest volume manipulation"
1Y Trend
+ long impulse
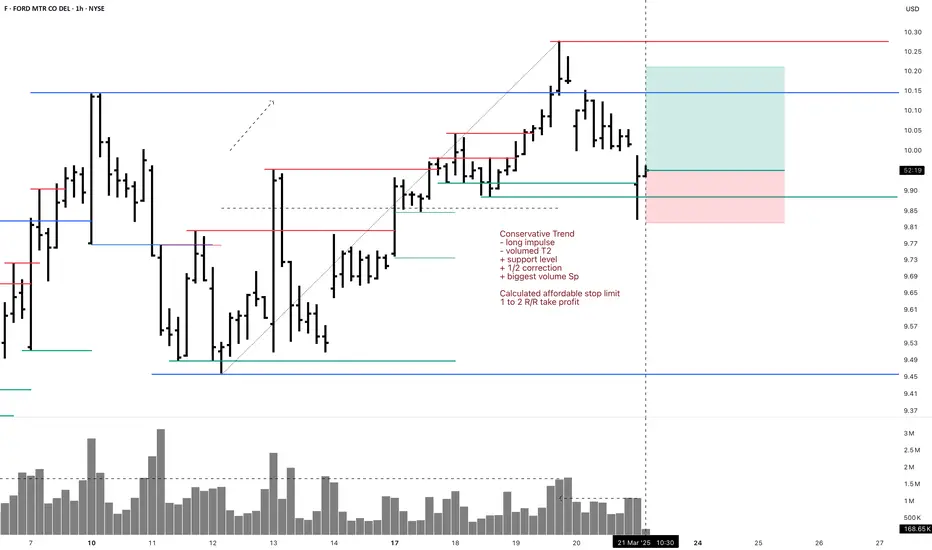
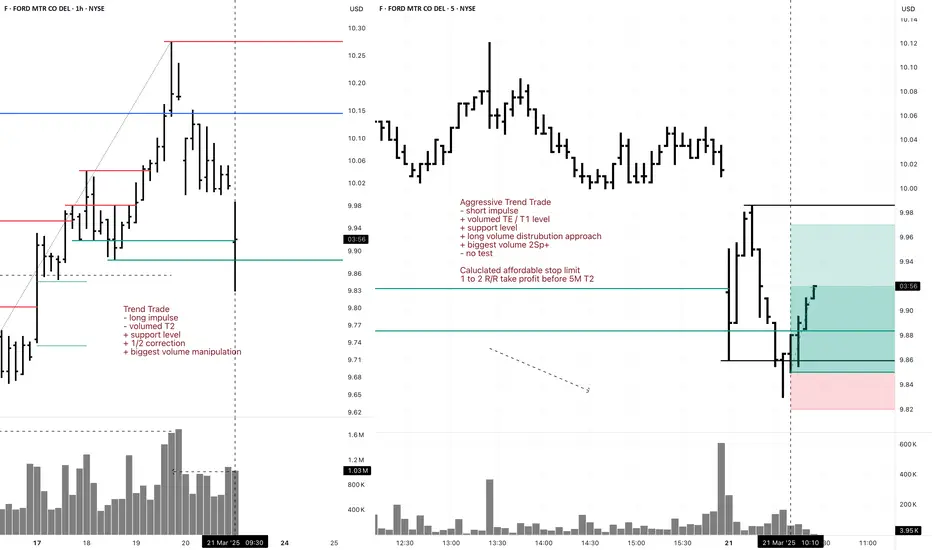
F 1H Swing Long Conservative Trend TradeConservative Trend Trade
- long impulse
- volumed T2
+ support level
+ 1/2 correction
+ biggest volume Sp
Calculated affordable stop limit
1 to 2 R/R take profit
Day Trend
"+ long impulse
+ 1/2 correction
- neutral zone
- context direction short"
Month CounterTrend
"- short impulse
+ 1/2 correction
- unvolumed T1
+ support level
+ long volume distribution
+ biggest volume manipulation"
Year Trend
"+ long impulse
+ volumed T2 level
+ volumed 2Sp+
+ 1/2 correction
+ weak test"
F 5M Daytrade Long Aggressive Trend TradeAggressive Trend Trade
- short impulse
+ volumed TE / T1 level
+ support level
+ long volume distribution approach
+ biggest volume 2Sp+
- no test
Calculated affordable stop limit
1 to 2 R/R take profit before 5M T2
Hour Trend
"- long impulse
- volumed T2
+ support level
+ 1/2 correction
+ biggest volume manipulation"
Day Trend
"+ long impulse
+ 1/2 correction
- neutral zone
- context direction short"
Month CounterTrend
"- short impulse
+ 1/2 correction
- unvolumed T1
+ support level
+ long volume distribution
+ biggest volume manipulation"
Year Trend
"+ long impulse
+ volumed T2 level
+ volumed 2Sp+
+ 1/2 correction
+ weak test"
GM 1H Long Swing Conservative CounterTrend TradeConservative CounterTrend Trade
+ long impulse
+ volumed SOS test / T2 level
+ support level
+ 1/2 correction
+ biggest volume Sp
Calculated affordable stop limit
1 to 2 R/R above 1D T1 before 1/2 1M
Daily CounterTrend
"- short balance
- unvolumed expanding T1
+ volumed 2Sp+
+ test"
Monthly Trend
"+ long impulse
- below 1/2 correction
+ SOS test level?"
Yearly Trend
"+ long balance
- neutral zone"
Will add more if 5M corrects to 1/2 or 1H doest weak test and resumes buying
