RENDER Spot Re-add PlanAlready holding Render as my biggest spot bag. Just setting clean limit orders to compound on weakness.
📍 Limit Orders (laddered):
• 3.45 → Daily FVG top (40%)
• 2.95 → Weekly VAL zone (40%)
• 2.55 → Deep HTF discount (20%)
Long term hold. Pure add-on entries.
DISCLAIMER:
I am not providing financial advice or investment signals. This post reflects my personal accumulation strategy and is shared solely for documentation purposes. I'm adding to an existing long-term position based on my own analysis and conviction. Sharing this openly helps me stay accountable and focused on my goals. If you choose to act on any of this, it's entirely at your own risk. Always do your own research and make informed decisions based on your situation.
Volume

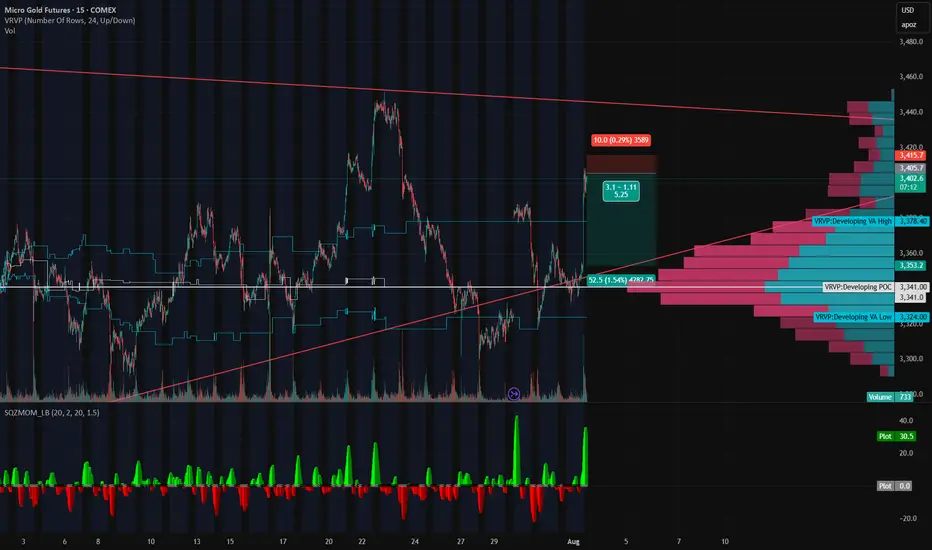
Gold’s on a Roller Coaster — and We’re Riding It Down🎢 Gold’s on a Roller Coaster — and We’re Riding It Down 🎢
Gold just snapped up like it saw Trump tweet “TARIFFS ARE BACK” — but the move smells like a knee-jerk algo pump, not real conviction. We just rejected right into a thin-volume imbalance zone and tagged the underside of a long-standing trendline.
📉 Short Setup Locked In:
💥 Entry: 3405
🛑 Stop: 3415
🎯 Target: 3353
💰 R:R ≈ 5:1
🔍 Why I'm In This Trade:
That rip? Total headline panic, not structural strength.
Low volume shelf above, with a massive POC magnet below at 3353.
We tapped the Developing VAH (3414) and got rejected — classic trap setup.
SQZMOM showing the energy is already fizzling. Green flash, no follow-through.
🧠 The Narrative:
Gold’s trying to price in volatility from every angle — Trump talk, tariffs, macro chaos — but under the hood, this pop looks unsustainable. If this is just a liquidity grab, we could see a flush back into the meat of value fast.
Grab your helmets — this roller coaster might just be heading downhill 🎢📉
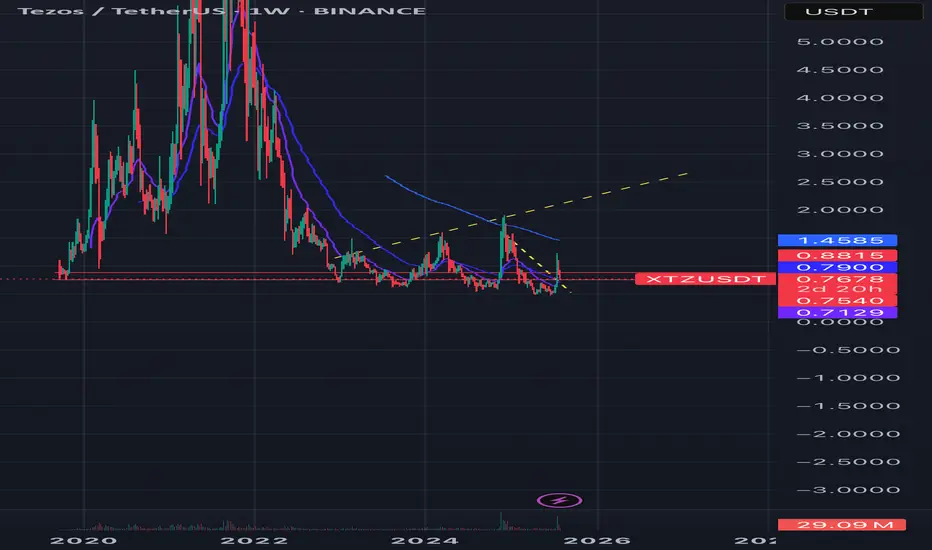
Xtz historic supportXTZ is at a historic support level here where it has consistently respected as support or resistance after recently busting over it and on higher volume seen in a long time. I’m optimistic.
Most tied up in staking it seems ~77%, so moves could happen quickly, as seen previously.
Targets and their point in timewe use the threshold breaks to determine targets AKA areas of liquidity. we also utilize pattern detection paired with the threshold breaks to validate cycles and where we are in said cycle.

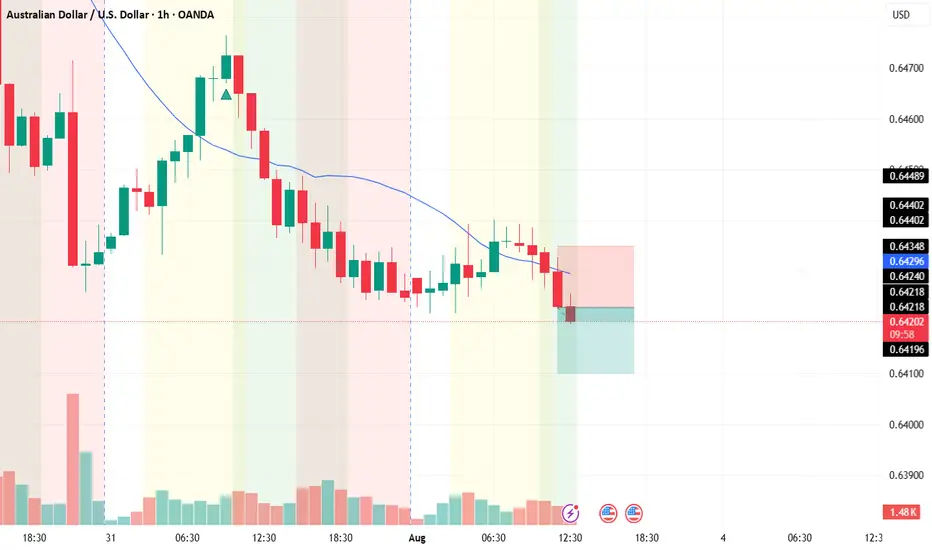
AUD/USDThis is a trade setup for AUD/USD, based on volume and trend analysis.
Entry Price: 0.64230
Stop-Loss (SL): 0.64350
Take-Profit (TP): 0.64100
The trade is intended to be executed instantly at the mentioned price, in alignment with both volume behavior and the current trend direction.
Disclaimer: This setup is shared purely for backtesting purposes and to document trade ideas. It is not financial advice. Always perform your own analysis before making any trading decisions.
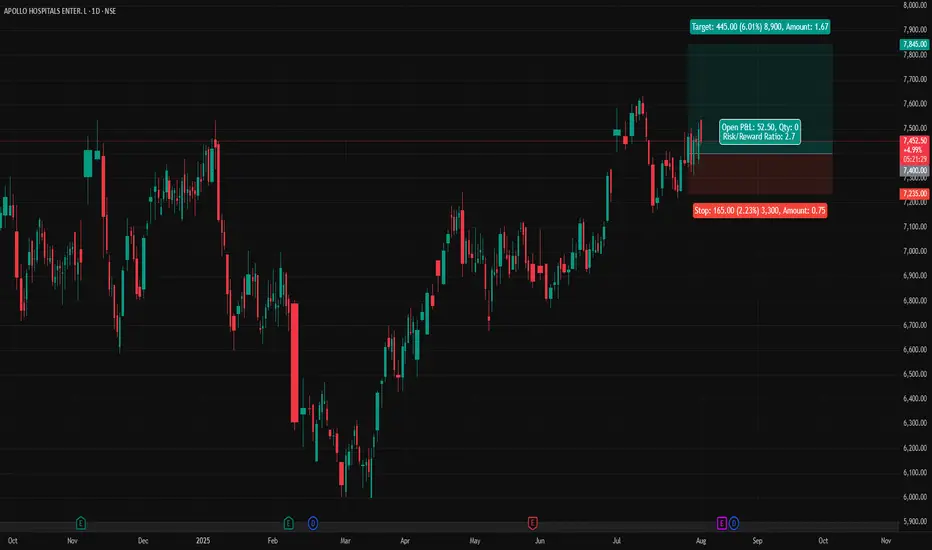
APOLLOHOSP - Apollo Hospitals (Daily chart, NSE) - Long PositionAPOLLOHOSP - Apollo Hospitals Enterprise Ltd. (Daily chart, NSE) - Long Position
Risk assessment: Medium {support structure integrity risk}
Risk/Reward ratio ~ 2.7
Current Market Price (CMP) ~ 7450
Entry limit ~ 7400 on Aug. 01, 2025
Target limit ~ 7845 (+6.01%; +445 points)
Stop order limit ~ 7235 (-2.23%; -165 points)
Disclaimer: Investments in securities markets are subject to market risks. All information presented in this group is strictly for reference and personal study purposes only and is not a recommendation and/or a solicitation to act upon under any interpretation of the letter.
LEGEND:
{curly brackets} = observation notes
= important updates
(parentheses) = information details
~ tilde/approximation = variable value
-hyphen = fixed value
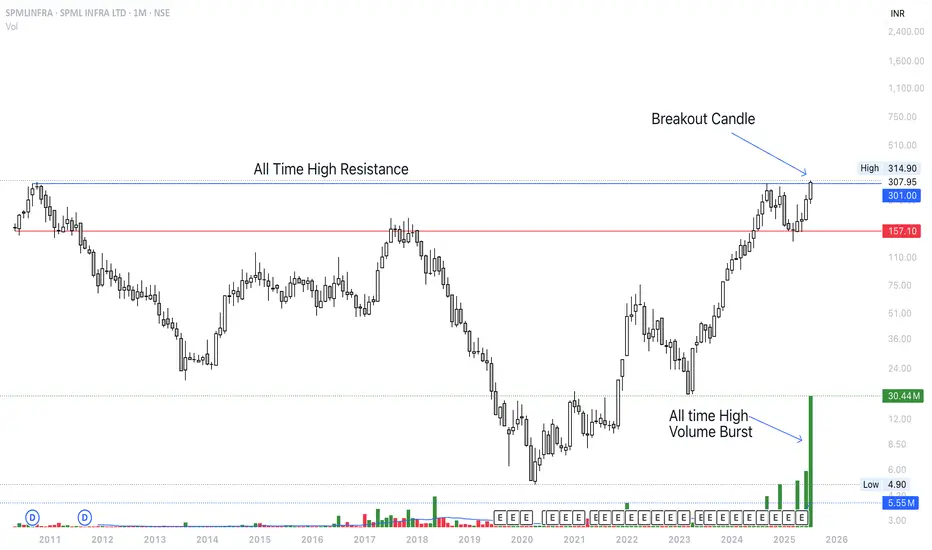
Breakout Soon <> SPMLINFRAStock is pushing above All time High resistance level. Keeping on radar. It would have been solid breakout if the Monthly closing was above 310 level. Volume also supporting the level. Recently realty sector rally also supporting.
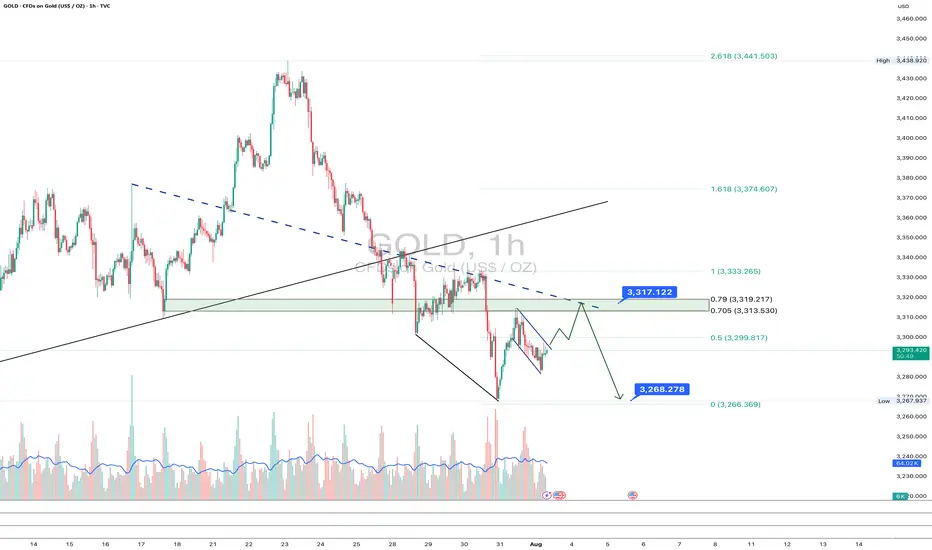
Gold: final pullback or bull trap?On the 1H chart, gold (GOLD) is forming a bullish flag after a sharp decline, which may just be a corrective move within a broader downtrend. The price is now approaching the key resistance zone around $3313–$3317 - this area holds the POC, broken trendline, and the 0.705–0.79 Fibonacci retracement from the last drop. This is the decision-making zone.
If bulls fail to push above it, we expect a move down toward $3268 - the next strong support and potential buy zone, also confirmed by Fibonacci and local demand. Stochastic divergence and slowing volume suggest a possible rebound from that level. However, if the price breaks and holds above $3317, this would indicate a local trend reversal, with targets at $3333 and $3374.
Watch the $3317 zone closely - bulls have yet to prove this is more than just a bounce.
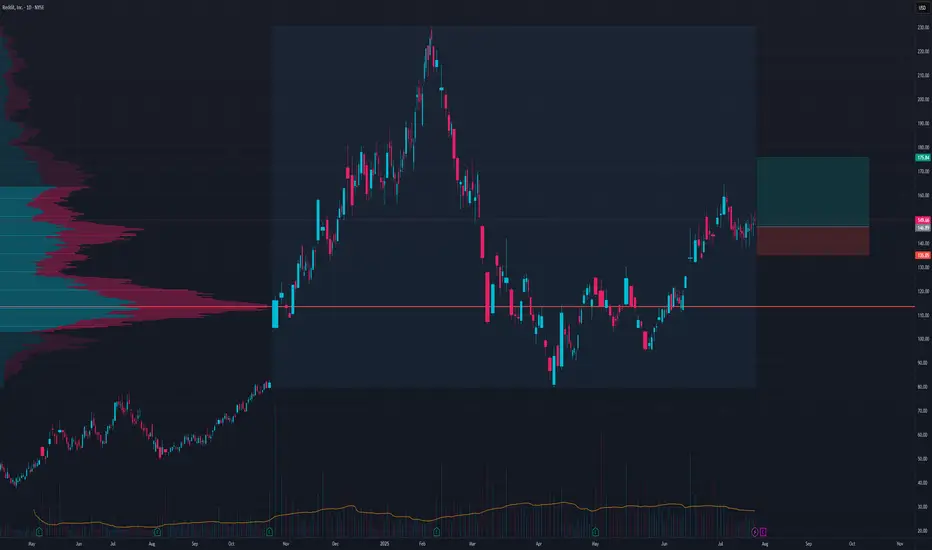
RDDT LongOn a pullback to 146 there is a 2.45 risk to reward setup
I like the volume accumulation here it seems prime to push out of this volume profile
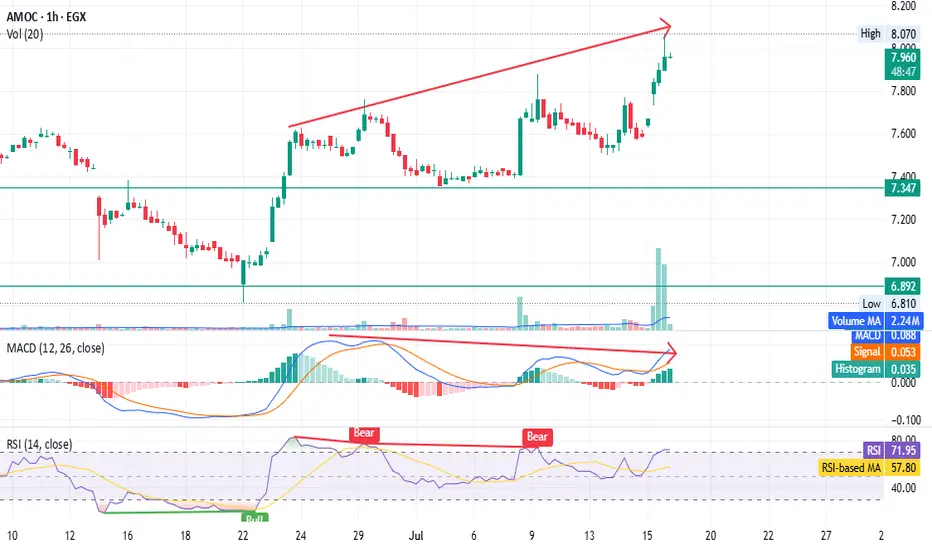
AMOC - Beware of the bear trap - only for shareholders EGX:AMOC timeframe: 1 hour
Prices continue to rise, forming a higher top than the previous one,
but MACD shows a negative divergence.
RSI indicates bearish dominance despite the price increase.
High volume with a gap, unsupported by other indicators, suggests possible distribution.
Stop loss (profit-saving) at 7.62.
This is not financial advice, just our analysis based on chart data. Consult your account manager before investing.
Thanks and good luck!
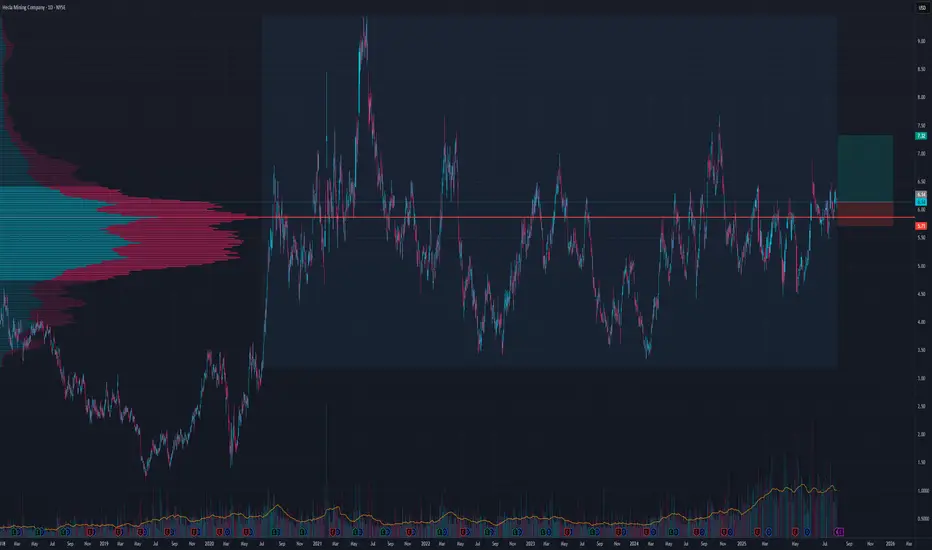
Another HL winner?I like this patter and potential push away from POC
Even tho tp could be higher and setup is still valid until 5.4 for a shorter term SL is at 5.7 and TP at 7.33 for a good risk to reward
USD/JPYThis is a trade setup for USD/JPY, based on volume and trend analysis.
Entry Price: 150.360
Stop-Loss (SL): 150.740
Take-Profit (TP): 149.963
The trade is intended to be executed instantly at the mentioned price, in alignment with both volume behavior and the current trend direction.
Disclaimer: This setup is shared purely for backtesting purposes and to document trade ideas. It is not financial advice. Always perform your own analysis before making any trading decisions.

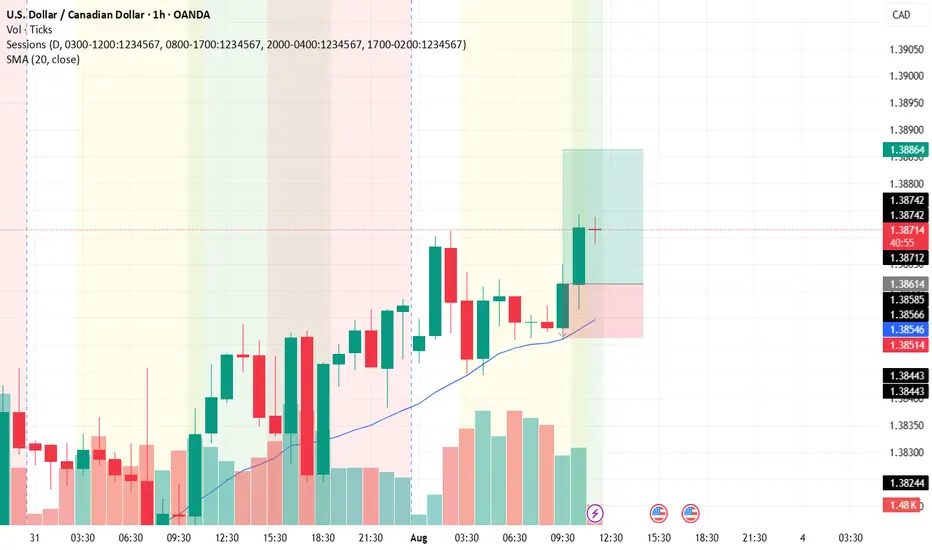
USD/CADThis is a trade setup for USD/CAD, based on volume and trend analysis.
Entry Price: 1.38614
Stop-Loss (SL): 1.38514
Take-Profit (TP): 1.38864
The trade is intended to be executed instantly at the mentioned price, in alignment with both volume behavior and the current trend direction.
Disclaimer: This setup is shared purely for backtesting purposes and to document trade ideas. It is not financial advice. Always perform your own analysis before making any trading decisions.
NZD/USDThis is a trade setup for NZD/USD, based on volume and trend analysis.
Entry Price: 0.58742
Stop-Loss (SL): 0.58892
Take-Profit (TP): 0.58582
The trade is intended to be executed instantly at the mentioned price, in alignment with both volume behavior and the current trend direction.
Disclaimer: This setup is shared purely for backtesting purposes and to document trade ideas. It is not financial advice. Always perform your own analysis before making any trading decisions.

USD/CHF
This is a trade setup for USD/CHF, based on volume and trend analysis.
Entry Price: 0.81473
Stop-Loss (SL): 0.81293
Take-Profit (TP): 0.81673
The trade is intended to be executed instantly at the mentioned price, following confirmation from both volume behavior and the current trend direction.
Disclaimer: This setup is shared purely for backtesting purposes and to document trade ideas. It is not financial advice. Always perform your own analysis before making any trading decisions.

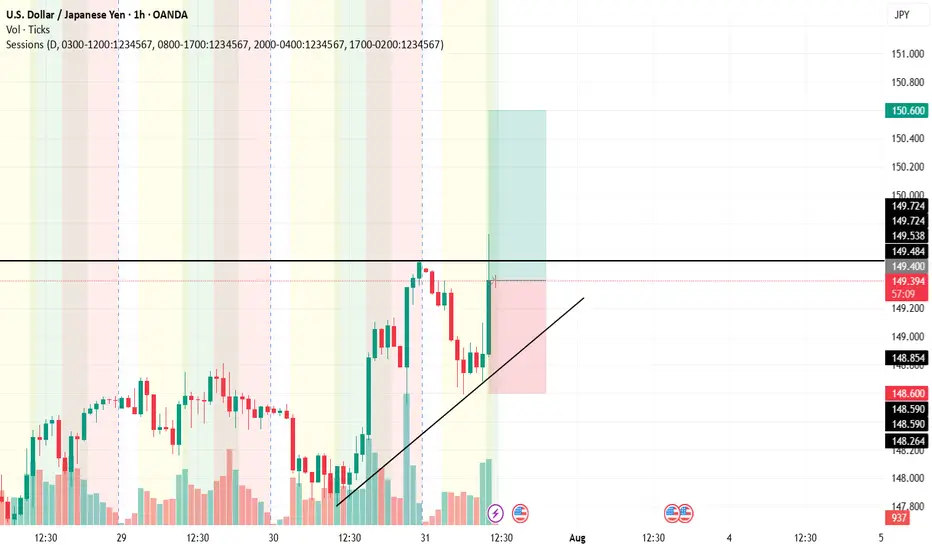
USD/JPY USD/JPY – Bullish Setup in Line with the Prevailing Trend
As the overall trend remains bullish, we are considering a potential long setup on USD/JPY. The structure suggests continued upside momentum, and we aim to close the trade by the end of the European session.
📍 Entry: 149.400
🎯 Target: 150.600
🛑 Stop-loss: 148.600
This idea aligns with current market direction and intraday trend strength. Traders should watch for supportive price action to confirm the move.
Disclaimer: This analysis is for educational purposes only and does not constitute financial advice. Always do your own research and manage risk appropriately.
AUD/USDAUD/USD – Possible Correction Scenario Based on Volume Analysis
This idea presents a potential correction in AUD/USD, based on recent volume behavior suggesting a shift in market sentiment.
Following a strong move, volume has started to decline near the recent lows, hinting at possible seller exhaustion. This may open the path for a short-term bullish correction toward higher value areas.
📍 Entry: 0.64681
🎯 Target: 0.65050
🛑 Stop-loss: 0.64428
This is a possible scenario, not a guaranteed outcome. Always monitor price action and volume for confirmation.
Disclaimer: This analysis is for educational purposes only and does not constitute financial advice. Always do your own research and manage risk appropriately.
Ask ChatGPT

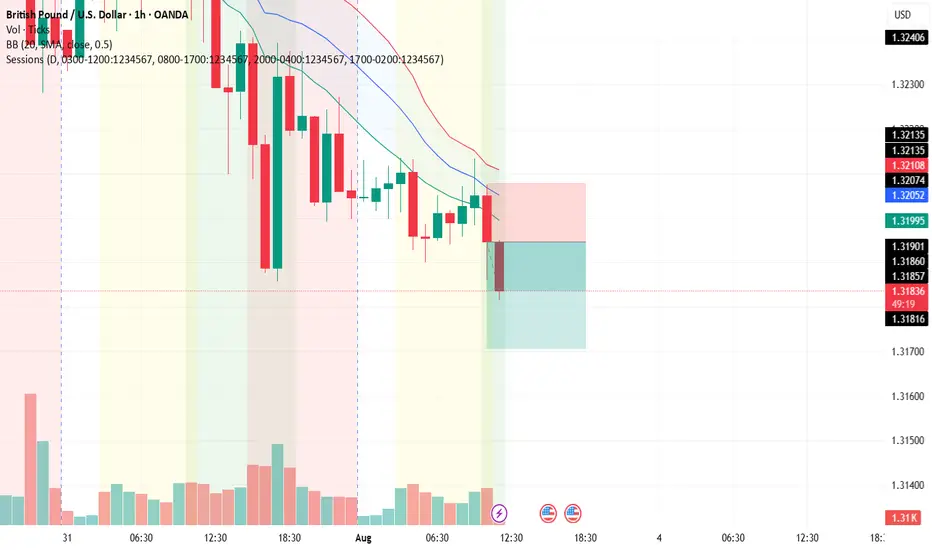
GBP/USDHello traders!
This is a trade setup for GBP/USD, based on volume and trend analysis.
Entry Price: 1.31947
Stop-Loss (SL): 1.32077
Take-Profit (TP): 1.31707
The trade is intended to be executed instantly at the mentioned price, in alignment with both volume behavior and the current trend direction.
Disclaimer: This setup is shared purely for backtesting purposes and to document trade ideas. It is not financial advice. Always perform your own analysis before making any trading decisions.
Aussie Shorts Looks Promising This is a pullback trend trade anticipating trend continuation. Entry is based on LVN (low volume node) for entry. Also looking on the footprint chart there is a high volume node with -ve delta that was traded at 0.64715.
If the sellers return to defend that price then this pullback should give some strong rejection once we pierce the entry zone and send bulls packing.
TP1 - First swing low
TP2 - Value area low of the range, which also is in confluence with the ExoFade peak on the 1HR timeframe. ExoFade peaks always gets taken out in a strong trend, that's why i love using them as price targets for exits. ExoFade is free on Tradingview for those curious about it. Just search for it.

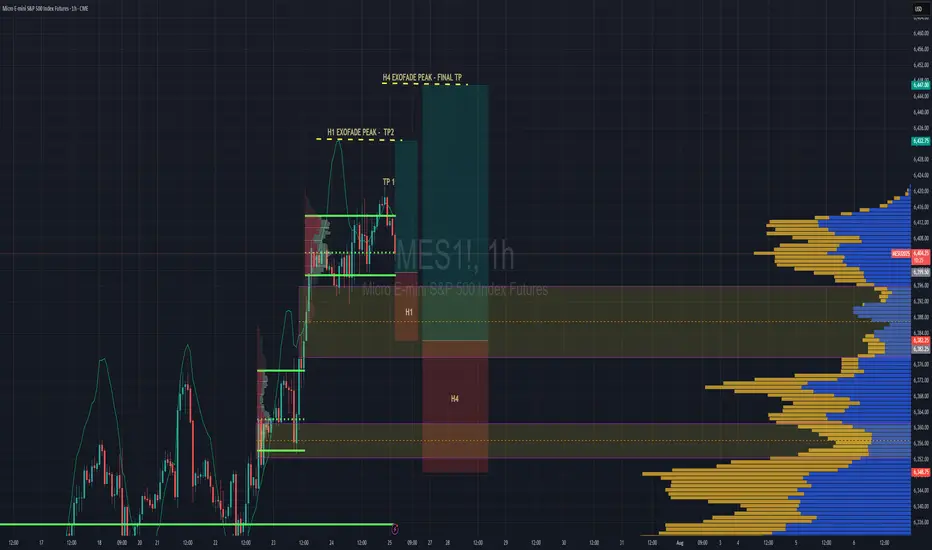
S&P 500 Intraday & Swing Entries H1 entry is close to getting activated for intraday.
If you want a swing trade then wait for H4 entry (you might be waiting a while obviously)
Reason for entries - We have broken out of Balance since July 25th and currently in a trend phase until we establish a new value area, or return to the one we broke out from.
So since Trend and Momentum is UP, then we should find Low Volume Areas to enter in the direction of the trend for a classic pullback entry trade.

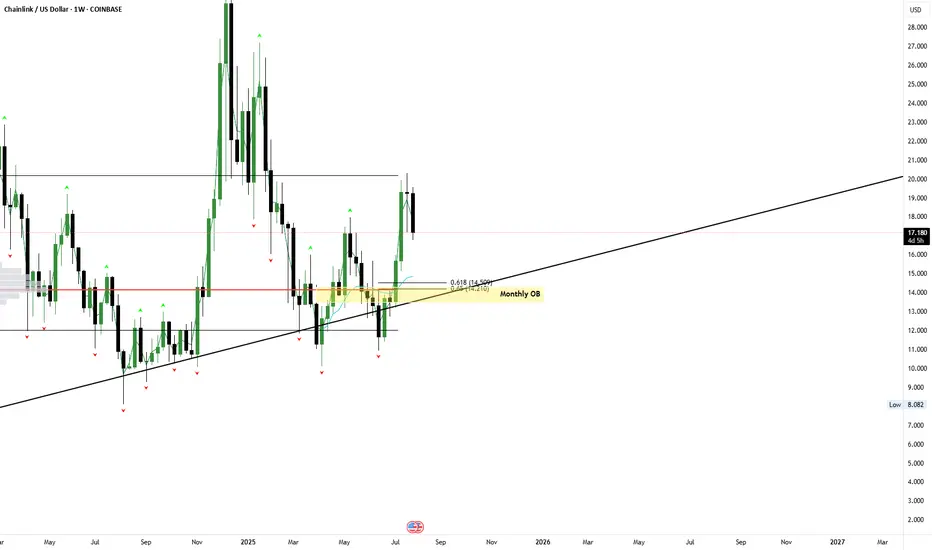
$LINK – VAH RejectionKeeping an eye on this one. Watching the rejection off VAH — I’d consider laddering in around the POC and VAL. We've also got confluence with an anchored VWAP, GP, and a monthly order block in play.
MSTR Holding VWAP Support – Reversal Attempt but Earnings AheadMSTR bounced nearly 2% today after testing anchored VWAP support near $390. This recovery comes after a steady pullback from the recent $460 high. Price is holding above the yellow VWAP and just above the green zone, signaling possible short-term support.
However, volume remains light (3.72M vs. 11.47M average), indicating cautious buying — and earnings are scheduled for tomorrow, which introduces added volatility risk. A close above $410 post-earnings would strengthen the bullish case.
Until then, this remains a speculative long setup with event risk.
Indicators used:
Anchored VWAP (support zone: $390–395)
Volume vs. Volume MA (light = indecision)
Earnings date = risk trigger
Entry idea: Only after earnings reaction; ideally above $410
Target: $430–440
Stop: Below $388 or earnings miss
