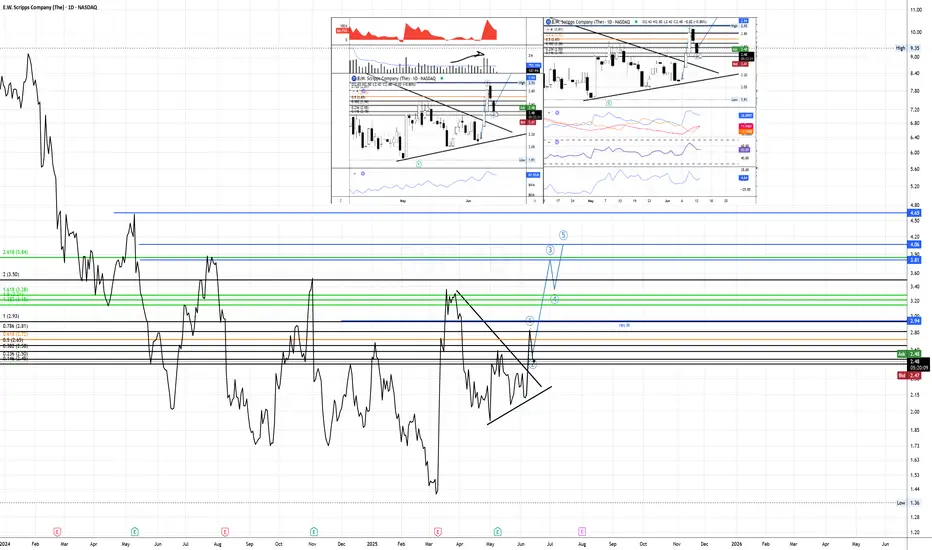
$SSP Low volume on Wave 2, momentum risingFirstly, on the line chart is possible to watch the possible targets - blue lines - which one of it is almost as the same level as 2,618.
Fibonacci measured from the breakout to monthly resistance.
res M = monthly resistance
During the Wave 2, the two candles from last two days showed low volume as usual to happen during formation of W2, and it is possible to see that price at the breakout and after it was above average which can be read as high interest from buyers.
Confirming the volume, the EFI even though is decreasing still show strength,OBV follow the price trend but looks like buyers are entering again.
When it comes to momentum is possible to see that RSI did not crossed the equilibrium even after two bearish days, as ROC being a leading indicator which already changed direction . ADX is showing some strength for the trend direction confirmed by as DMI+ is still above DMI-
DTC = 1,36
Volume
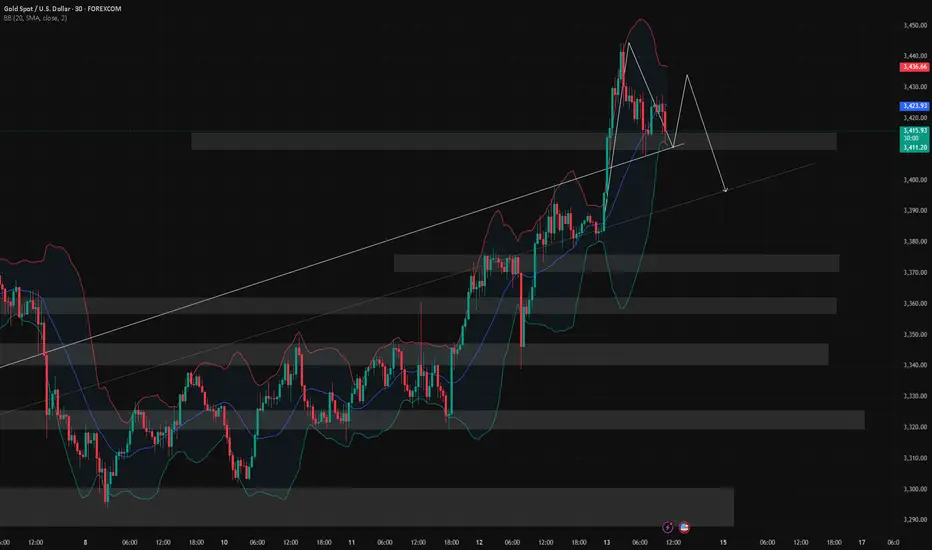
Watch Out for Weekly-Level ResistanceAs news of Israel's strike on Iran’s nuclear facility continues to spread, a surge in risk-off sentiment has driven noticeable gains across safe-haven assets. The escalation of tensions in the Middle East has clearly become a key trigger for current market sentiment. Should the conflict intensify further, oil and other safe-haven assets may see continued upside; conversely, if tensions ease, the retreat of risk aversion could lead to price corrections.
From a technical perspective, gold is currently facing downward pressure from the weekly trendline. If geopolitical tensions persist, gold may potentially rally toward the 3500–3550 range. However, without stronger fundamental support, a significant correction could follow once that level is reached.
On the intraday chart, the price has now broken below the middle Bollinger Band on the 30-minute timeframe and is near lower band support around 3413. MACD and moving average alignment suggest there may still be room to test the 3396–3388 trend support zone. The 1-hour chart remains in a consolidation phase, and while a short-term rebound is possible, selling at higher levels appears to be the safer strategy for today.
As it is Friday and given the geopolitical uncertainties, the potential for weekend risk is significantly higher. It is recommended to reduce exposure before the market closes. If you choose to hold positions over the weekend, be sure to set appropriate stop-losses to mitigate unexpected developments.
EURUSD Long-Term Breakout Setup? Wyckoff + High Volume Breakout📍 Chart: EURUSD — Monthly
📈 Tools Used: Wyckoff Logic, Volume Profile, Candle Volume Analysis, Trendline Structure
—
🔍 Market Context
Since 2015, EURUSD has been ranging between ~1.05 and ~1.15, forming a broad horizontal consolidation zone. This structure appears to resemble a potential long-term accumulation phase , according to Wyckoff theory.
Recently, we've seen a breakout of a multi-year descending trendline , accompanied by a candle with volume significantly above the historical monthly average . This is not a minor signal — it could indicate strong institutional interest and a possible Change of Character (ChoCh) .
—
📊 Volume Profile Observations
- Volume has been heavily concentrated around the 1.13–1.14 region, suggesting this may act as a springboard for higher prices.
- The breakout candle didn’t yet escape the overall range, but its volume and momentum show a clear deviation from previous attempts .
—
📐 Technical Structure
- ✅ Break of descending trendline (in place since 2008 highs)
- 🔺 Monthly close above trendline with strong volume
- 🟧 Price still within the upper half of the 2015–2024 range and pushing
—
🧠 Wyckoff Interpretation
This could be a Phase D transition — where price begins testing the upper boundary of the accumulation. If a breakout above 1.20–1.22 occurs with confirmation, we may see Phase E : the mark-up.
In this case, a major macro trend shift may be underway .
—
📌 Conclusion
EURUSD may be in the early stages of a long-term bullish reversal. Volume, structure, and context all support this hypothesis — though confirmation would come only with a decisive breakout from the range.
Many trades and allocations oportunities on the way.
Not financial advice. Educational use only.
—
🧭 What to watch next:
- 🔹 Monthly close above 1.16 (high volume candle)
- 🔹 Volume confirmation in breakout
- 🔹 Retest of volume cluster around close of high volume candle (1.13-1.14)

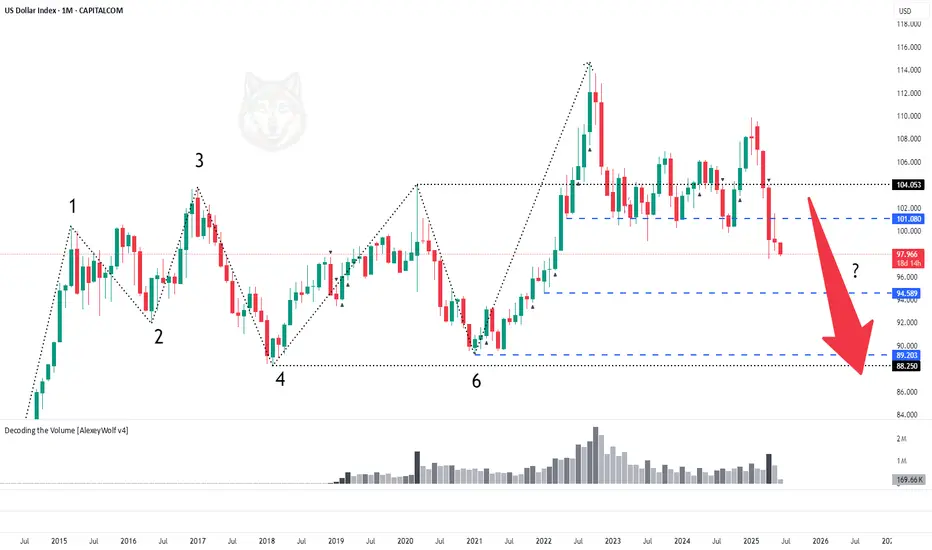
DXY. Midterm Analysis of the US Dollar IndexHey traders and investors!
📍 Context
On the monthly timeframe, the market was in a range. The price broke above the upper boundary and was long supported around the 101.080 level. This level was repeatedly tested by sellers and now appears to have been broken.
📊 Monthly targets: 89.20 and 88.300.
🔎 Analysis
Why might the downward movement continue?
Daily TF
On the daily chart, we can see that on the day buyers returned to the 101.080 level, the main volume was accumulated in a buyer candle right at and slightly above the level. This suggests the level was defended by sellers. This indicates they are currently in control, and the decline may continue. Let’s look at the nearest potential buyer activity levels.
11-day TF
The price has once again broken downward out of the range. Below, there is a small consolidation area formed during the previous upward movement. Its boundaries are: upper boundary — 97.385, lower boundary — 94.589.
🎯 Trade Idea: Rebounds from the upper boundary at 97.385 are possible, but overall the priority remains with a move into this range and towards the 95.00–94.589 zone.
This analysis is based on the Initiative Analysis concept (IA).
Wishing you profitable trades!
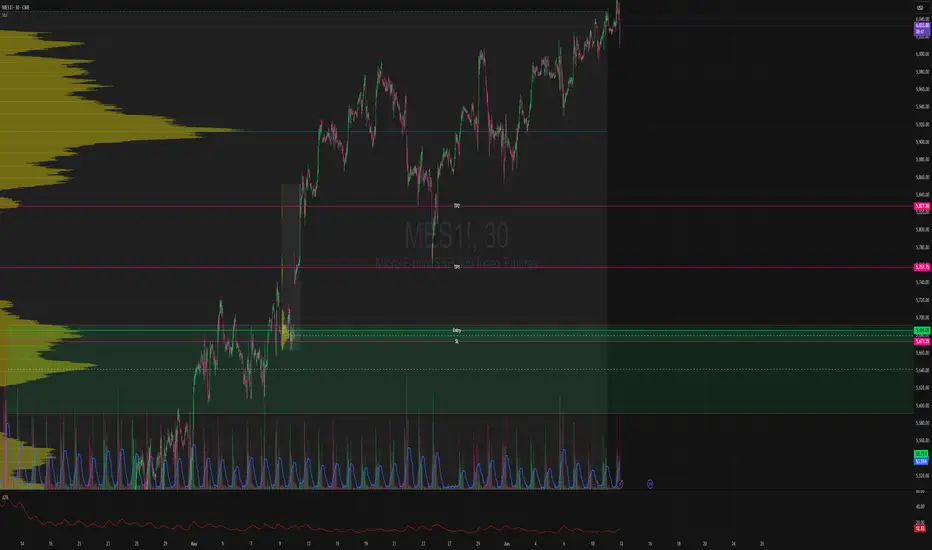
MES Long - HVN, Gap, FVG, Long trade for MES based on High Volume Node with refined Entry in lower timeframe.
HVN on higher timeframe (daily)
HVN on lower timeframe (m30)
Gap followed by huge FVG
Expected reaction for price to bounce to the upside.
TP2 rather a swing trade exit.
TP1 more of a intraday trade exit.
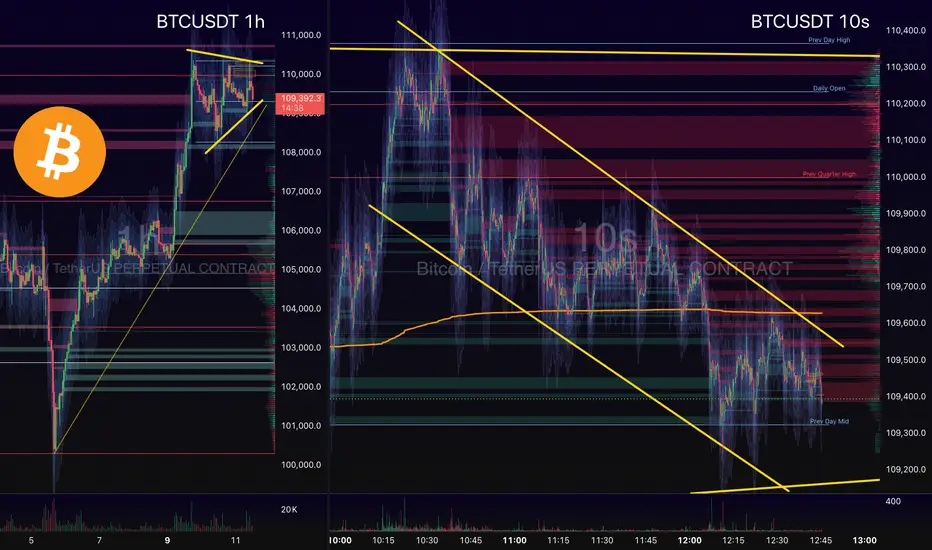
Layout TestHello World
HTF - 1h timeframe on left
LTF - 10s timeframe on right
FVG zones and Volume Profile
Key Levels
Hero starts heroingBreakout of inverted head and shoulder pattern in weekly timeframe, with big green candle and above average volume.

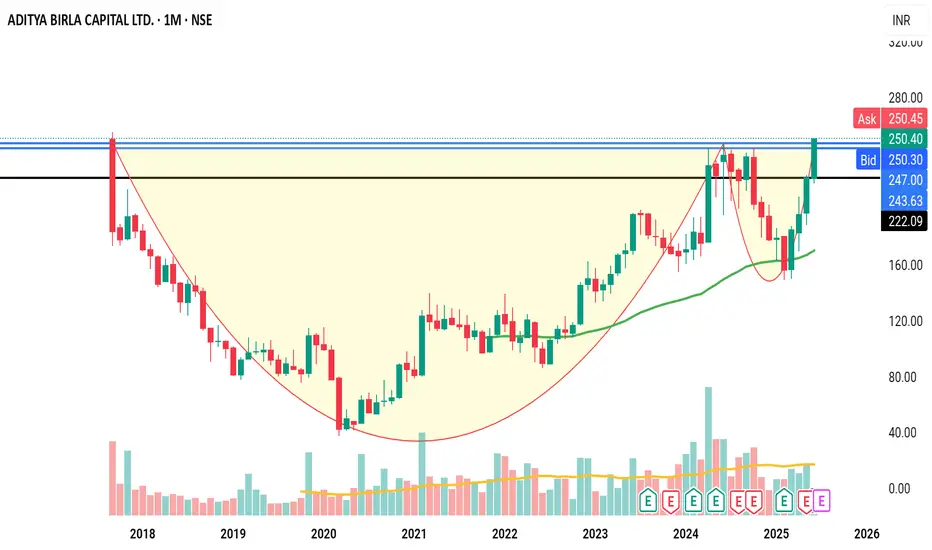
Time to pour coffee in the cupBreakout of cup and handle pattern with huge green candles and great volume on monthly timeframe. Breakout in monthly timeframe assures the sustainability post breakout.
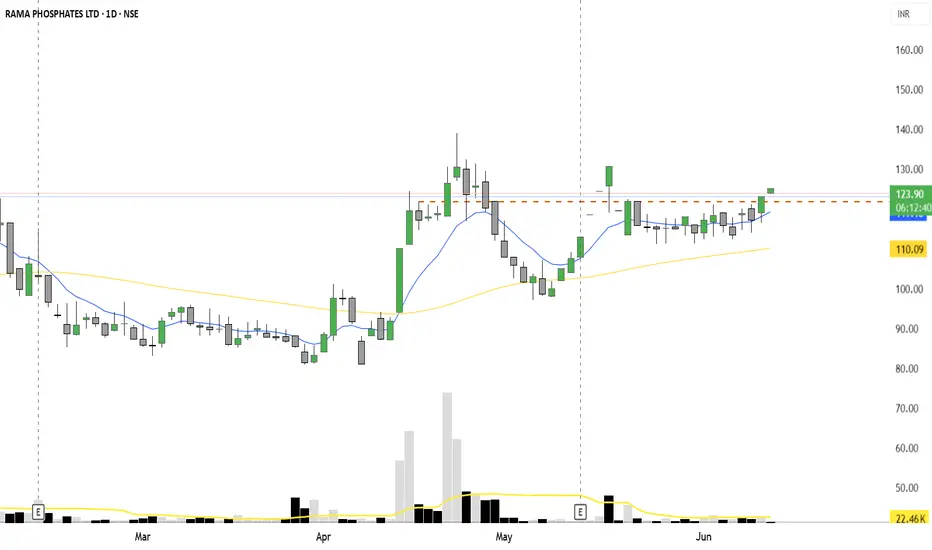
Swing Trade Plan: Rama Phosphates Ltd“Rama Phosphates Ltd is showing a technically strong breakout backed by volume and supported by a fundamentally improving outlook. The current level offers a favorable risk-reward swing opportunity for a 5–10 day holding period.”
Technical Overview:
Current Price: ₹123.03
20 EMA: ₹117.96 (Price above 20 and 50 EMA = short term and medium term indicator)
Breakout after facing a consolidation zone (₹113–₹119 range) with Strong bullish candle and volume confirmation.
📌 Fundamental View:
The company is fundamentally stable with growth potential in the fertilizer sector, especially during monsoon-driven demand spikes. Technical strength now aligns with mid-term fundamental value.
Company P/E ratio is attractive debt free or low debt which is positive sign for small cap. company's quarterly performance is good. company gives regular dividends which adds investors confidence.
📊 Trade Levels:
Buy Zone 121–123 Breakout confirmation entry
Stop Loss 116 Below 20 EMA and recent support zone
Target 1 130 Previous swing high
Target 2 138–140
Risk–Reward ~1:2.5
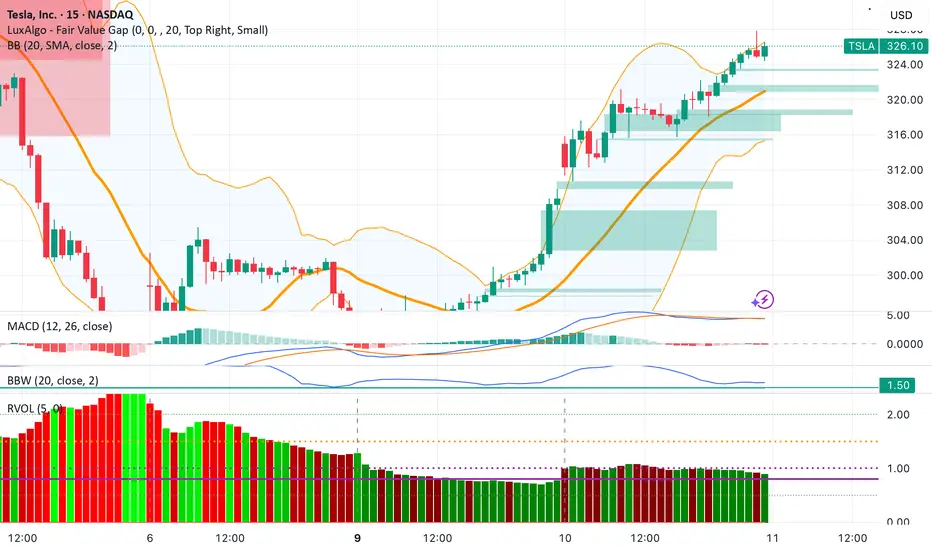
LONG entry @ $316.05 | 09:55am + LONG exit @ $321.05 | 11:20amToday goes to show what happens when you follow structure, and let mat and probability take care of the outcome. An exceptional day, remember... consistent green days are a reflection of discipline, not luck.
Some more pertinent details re price action today. I hit an algo entry at 9:55, MM's did a hard shake out of the weak hands, dropped the price significantly but there was no strong bearish FVG even though price dropped 3 points which gave me conviction to hold the position which paid off very well. There was no significant short move and the price rallied to a weekly high.
Polyanonymous.
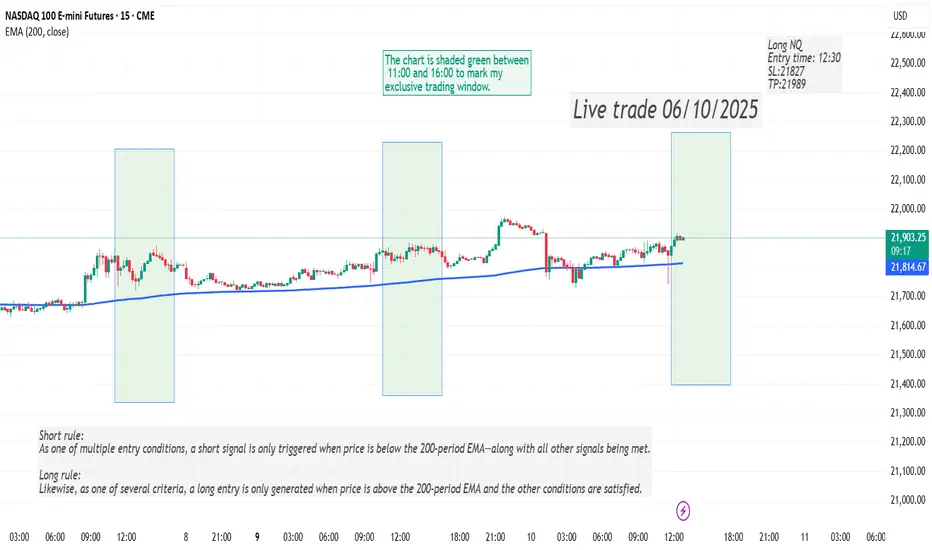
Live trade 06/10/2025Here is what one of my strategy traded today. I have 5 trading strategies in NQ and ES.
Today's trade was made based on the NQ DVD strategy where I look at the cumulative daily volume, an indicator that I developed. The Cumulative daily volume is calculated based on the direction of each candle and it resets on daily basis. For more info, please see my channel.
For this specific trade, the both TP and SL are calculated based on a coefficient of ATR. If none of them are met, then I close the trade by 16PM EST.
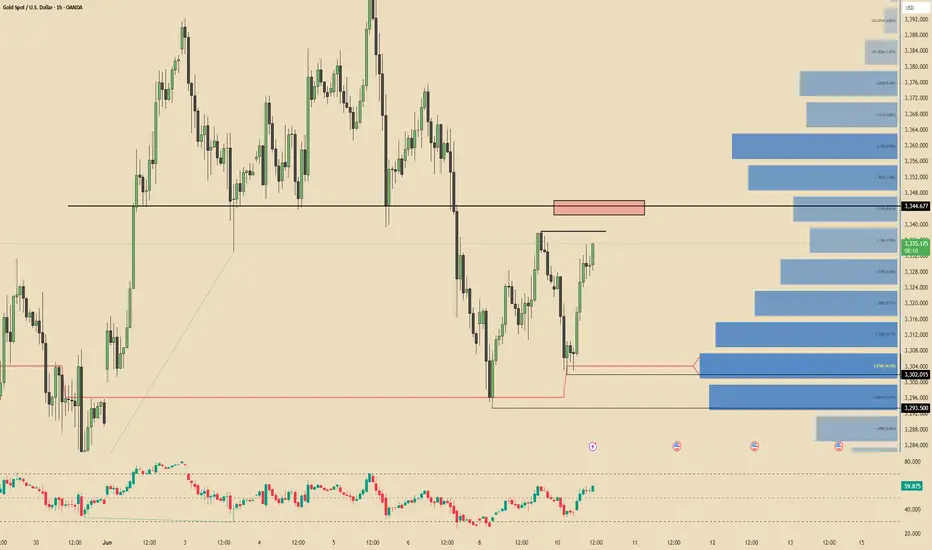
XAUUSD 10/06/2025Personally, my sentiment for gold is still bearish, therefore im'm still looking for sells. Waiting on a sweep of yesterday highs , liquidity is defenitely resting up there, around 3342.5 - 3346.5, taking shorts in a area of low volume as shown by the delta.
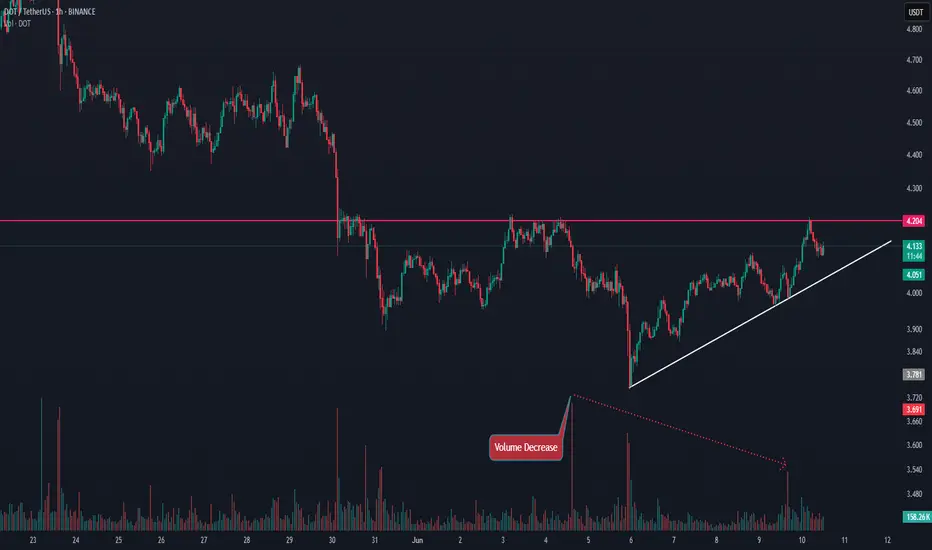
DOTUSDT|1H ANALYSIS🔍 In the 1-hour timeframe, DOT is currently holding above a valid ascending trendline 🔻 which has acted as support multiple times and prevented further downside 🛡️📉
This suggests that buyers are stepping in at lower levels, showing accumulation interest 🧲💰
👁️🗨️ Now, the price is approaching a key resistance zone around 4.204 🚧🔥
This level has previously rejected price action multiple times and is now being tested again! 😤📍
🛎️ Keep an eye on volume, confirmation candles, and beware of fake outs❗🔍
Monitor the chart closely, as market conditions can shift quickly ⏳⚠️
📅 Analysis Date:
📢 Drop your thoughts in the comments – I’d love to hear your outlook on DOT 🤝💬
If you enjoyed this analysis, don’t forget to like and follow for more updates ❤️🙌
#DOT #Polkadot #CryptoAnalysis #TechnicalAnalysis #TradingView #CryptoSignals #TA #Bitcoin #Altcoins
Precision Wires India Ltd: Breakout + Fundamental Bullish SetupTechnical Analysis (Daily Timeframe)
Breakout Pattern: consolidation breakout with Strong bullish DOJI candle above ₹185–₹187
Volume Confirmation: with a spike in volume (767.6K vs avg 571.2K)✅ Yes
Trend: Strong uptrend; Higher Highs & Higher Lows
Bullish momentum intact Price above 20 EMA & 50 EMA
FUNDAMENTALS ANALYSIS : Company fundamentals are fully strong, company low debt and high reserves make it fundamentally strong
PROFIT & LOSS:
Company revenue increased YOY
Company net profit good
Profit Margin improved from 3.9% to 4.2% that is the good sign.
🔼 Steady revenue growth with increasing margins shows operational efficiency and cost management.
Fundamental Summary
Parameter Verdict
Earnings Growth : Consistent YoY
Financial Health : Excellent
Promoter Holding: Stable & high
Business Model: Stable & scalable
Trade conclusion:
Strong volume Breakout from Consolidation
Earning Growth and ROCE >15%
Debt free company with high promoters confidence.
Good Sector
📢 Disclaimer: Not investment advice. Do your own research (DYOR). This idea is shared for educational and tracking purposes.

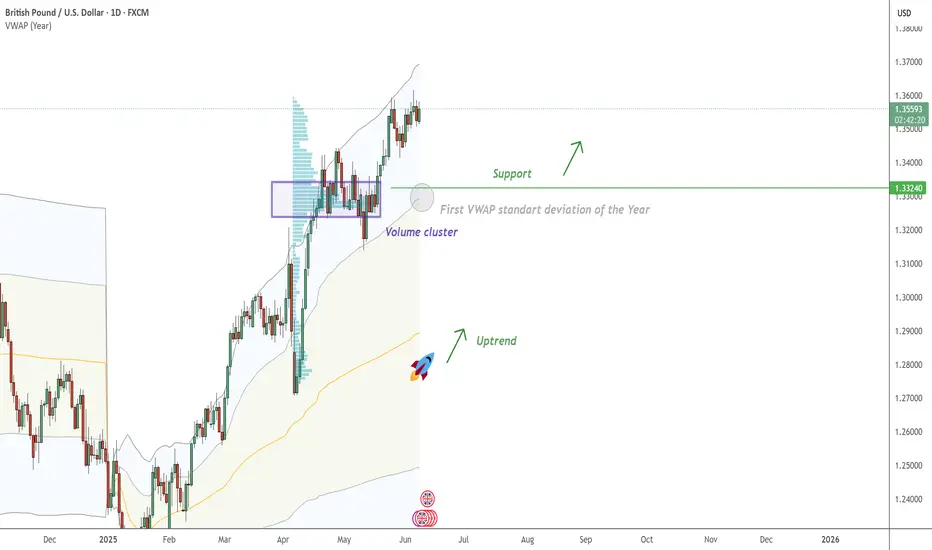
GBP/USD - confirmation with VWAP On GBP/USD , it's nice to see a strong buying reaction at the price of 1.33240 .
There's a significant accumulation of contracts in this area, indicating strong buyer interest. I believe that buyers who entered at this level will defend their long positions. If the price returns to this area, strong buyers will likely push the market up again.
VWAP + Uptrend and High volume cluster are the main reasons for my decision to go long on this trade.
Happy trading
Dale
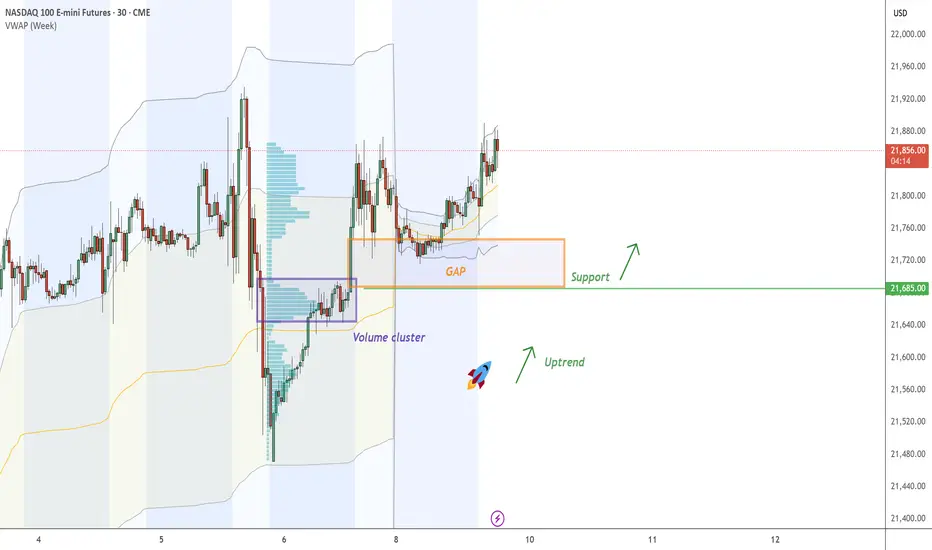
NQ - (FVG) - Fair Value GAPOn NQ , it's nice to see a strong buying reaction at the price of 21685 .
There's a significant accumulation of contracts in this area, indicating strong buyer interest. I believe that buyers who entered at this level will defend their long positions. If the price returns to this area, strong buyers will likely push the market up again.
(FVG) - Fair Value GAP and high volume cluster are the main reasons for my decision to go long on this trade.
Happy trading
Dale
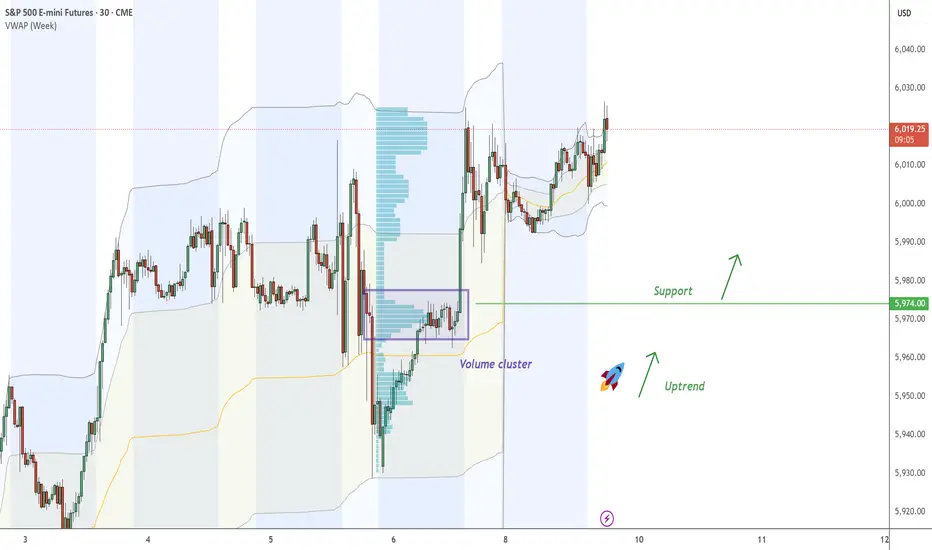
ES - continue with the UptrendOn ES , it's nice to see a strong buying reaction at the price of 5974.00 .
There's a significant accumulation of contracts in this area, indicating strong buyer interest. I believe that buyers who entered at this level will defend their long positions. If the price returns to this area, strong buyers will likely push the market up again.
Uptrend and high volume cluster are the main reasons for my decision to go long on this trade.
Happy trading
Dale
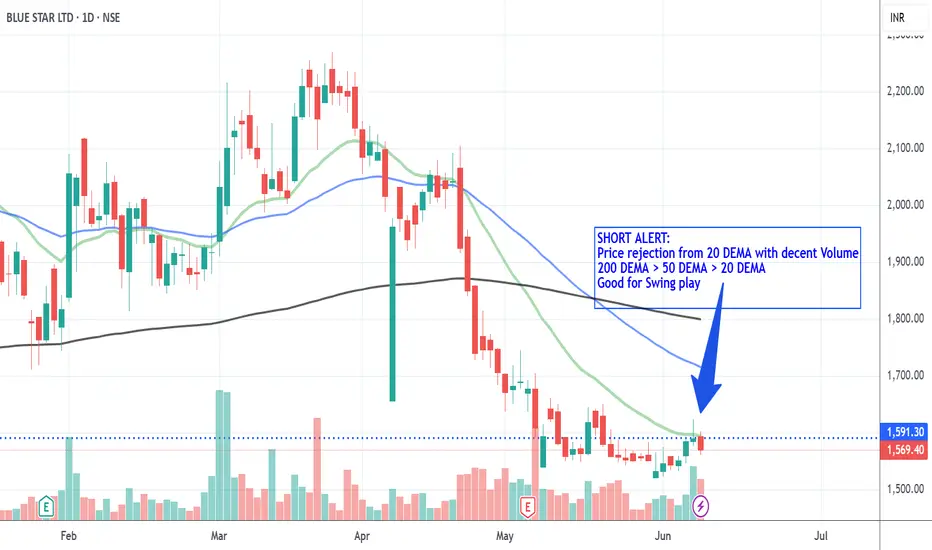
BlueStar_ShortSHORT ALERT:
Price rejection from Resistance & 20 DEMA with decent Volume
200 DEMA > 50 DEMA > 20 DEMA
Good for Swing play
Disc: Educational Purpose Only
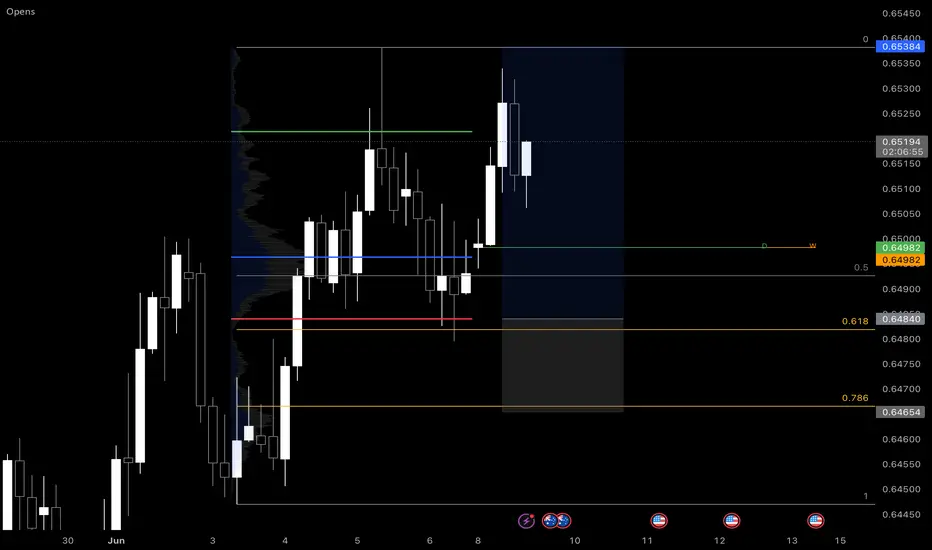
Pinex-Capital Trade IdeaThe chart shows a bullish daily structure with a higher volume range and positive momentum. The first long idea is based on a pullback to the value area high or the 0.5 Fibonacci zone around 0.6498. Should the market test this area and show buyers there, this would be an opportunity for a long entry with a target in the area of the recent high at 0.6538. The stop can be placed slightly below the 0.618 level at 0.6484.
A second long opportunity arises on a breakout above the recent high at 0.6538. If the price breaks above this zone with volume and stabilizes there, a procyclical long can be entered with a target towards 0.6560+ (next psychological level). The stop should be placed just below the breakout level.
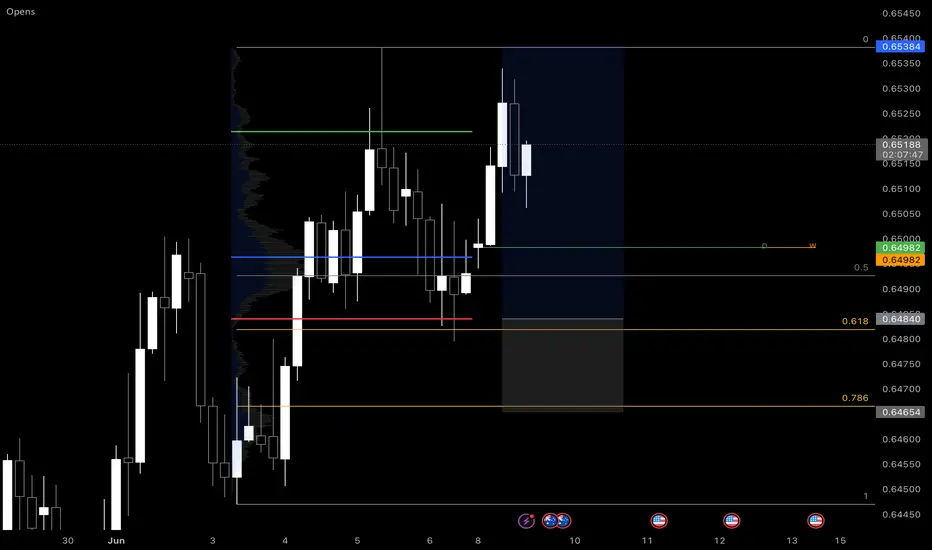
Pinex-Capital Trade IdeaThe second chart shows a bullish daily structure with a higher volume range and positive momentum. The first long idea is based on a pullback to the value area high or the 0.5 Fibonacci zone around 0.6498. Should the market test this area and show buyers there, this would be an opportunity for a long entry with a target in the area of the recent high at 0.6538. The stop can be placed slightly below the 0.618 level at 0.6484.
A second long opportunity arises on a breakout above the recent high at 0.6538. If the price breaks above this zone with volume and stabilizes there, a procyclical long can be entered with a target towards 0.6560+ (next psychological level). The stop should be placed just below the breakout level.
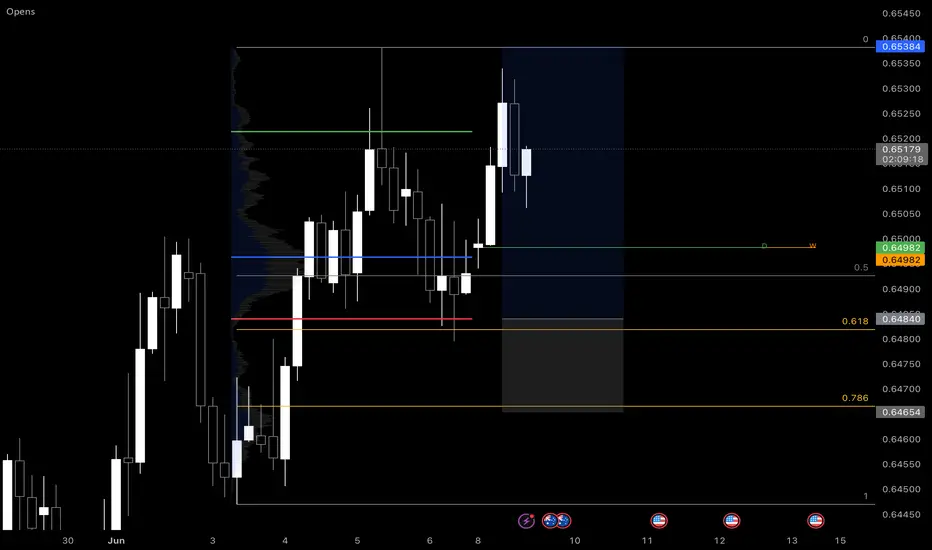
Pines-Capital Trade IdeaThe second chart shows a bullish daily structure with a higher volume range and positive momentum. The first long idea is based on a pullback to the value area high or the 0.5 Fibonacci zone around 0.6498. Should the market test this area and show buyers there, this would be an opportunity for a long entry with a target in the area of the recent high at 0.6538. The stop can be placed slightly below the 0.618 level at 0.6484.
A second long opportunity arises on a breakout above the recent high at 0.6538. If the price breaks above this zone with volume and stabilizes there, a procyclical long can be entered with a target towards 0.6560+ (next psychological level). The stop should be placed just below the breakout level.

Pines-Capital Trade IdeaThe chart shows a bullish daily structure with a higher volume range and positive momentum. The first long idea is based on a pullback to the value area high or the 0.5 Fibonacci zone around 0.6498. Should the market test this area and show buyers there, this would be an opportunity for a long entry with a target in the area of the recent high at 0.6538. The stop can be placed slightly below the 0.618 level at 0.6484.
A second long opportunity arises on a breakout above the recent high at 0.6538. If the price breaks above this zone with volume and stabilizes there, a procyclical long can be entered with a target towards 0.6560+ (next psychological level). The stop should be placed just below the breakout level.
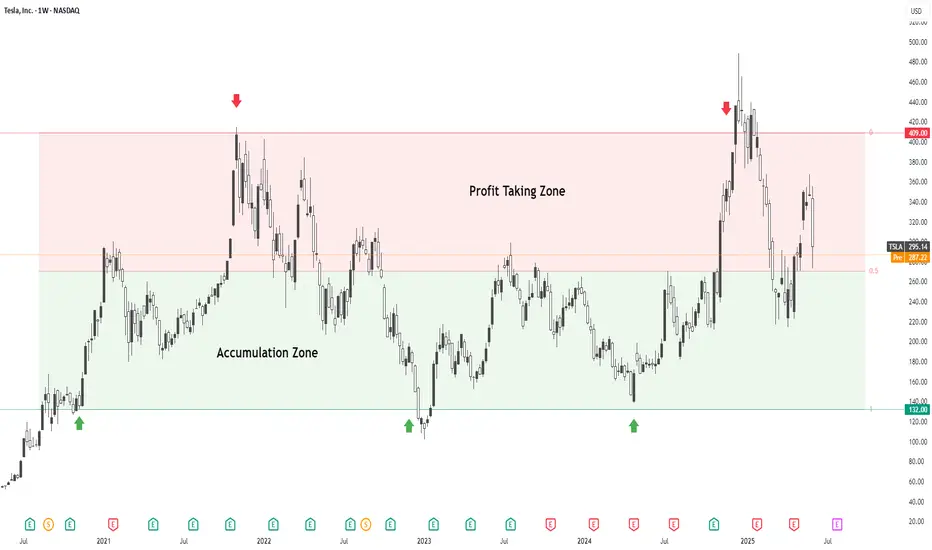
TSLA – Are You Buying Cheap or Buying Expensive?Tesla (TSLA) continues to trade within a long-standing macro range, well-defined by two behavioral zones:
🟩 Value Zone – Accumulation ($132 to $270.50):
This is where smart money tends to accumulate over time. Historically, moves from this zone lead to long-term rallies. Price spent multiple weeks here during major drawdowns — offering long-term entries at discounted value.
🟥 Premium Zone – Profit Taking ($270.50 to $409):
Above the midpoint ($270.50), price enters what can be considered the “expensive” territory. Historically, this area has acted as a supply zone, with frequent distribution and sharp reversals.
TSLA is currently sitting just above the midpoint, testing that equilibrium. Whether it consolidates for another leg higher or fails here could define the next swing move.
So ask yourself:
Are you buying value, or chasing premium?