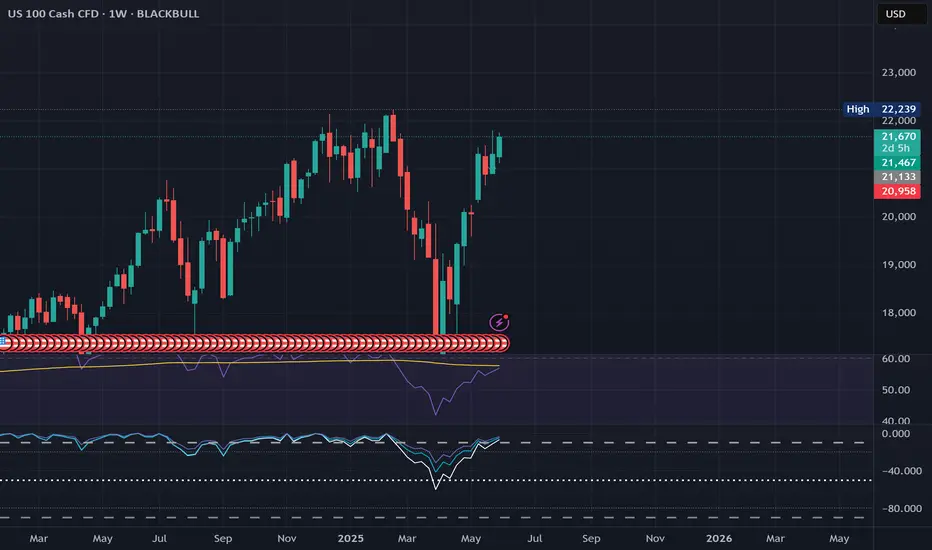
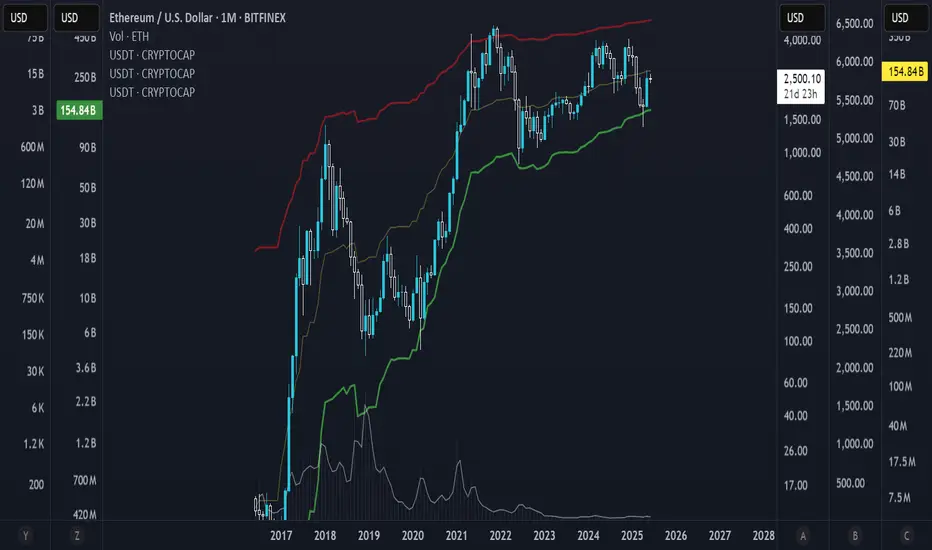
Liquidity BandsI start using the stablecoins mcap as channels, that way you see when the market is overpriced compared to the actual volume of inflows.
It basically envelopes the coin's pricing relative to the actually available liquidity.
"Liquidity Bands", if you will
Volume
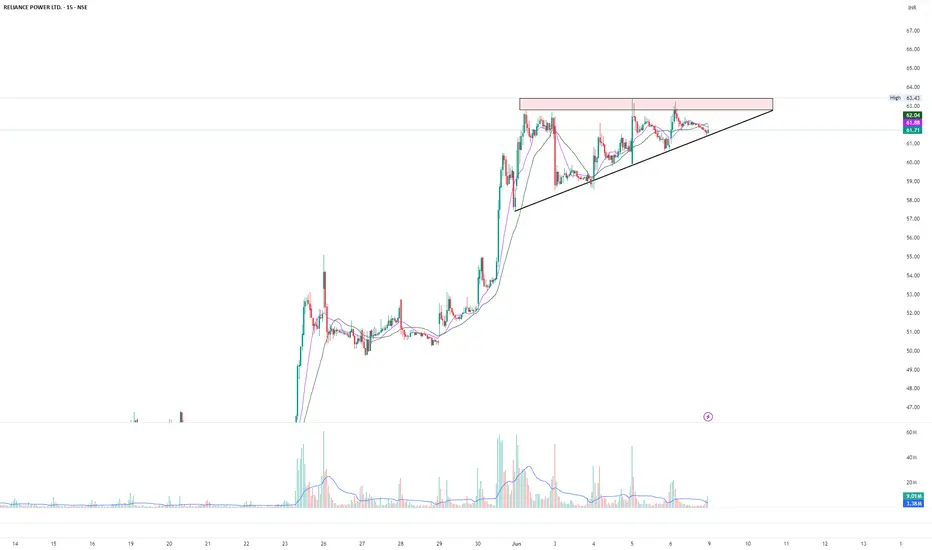
Ascending triangle in RPOWEROn short term chart, Rpower has created ascending triangle. This is after stock has moved up with a higher relative volume. This triangle suggests consolidation of upmove and further movement is highly probable.
As you can see, volume on up bars is huge as compared to down bars. This suggests higher interest in stock.
Breakout of 63.43 can give further upside.
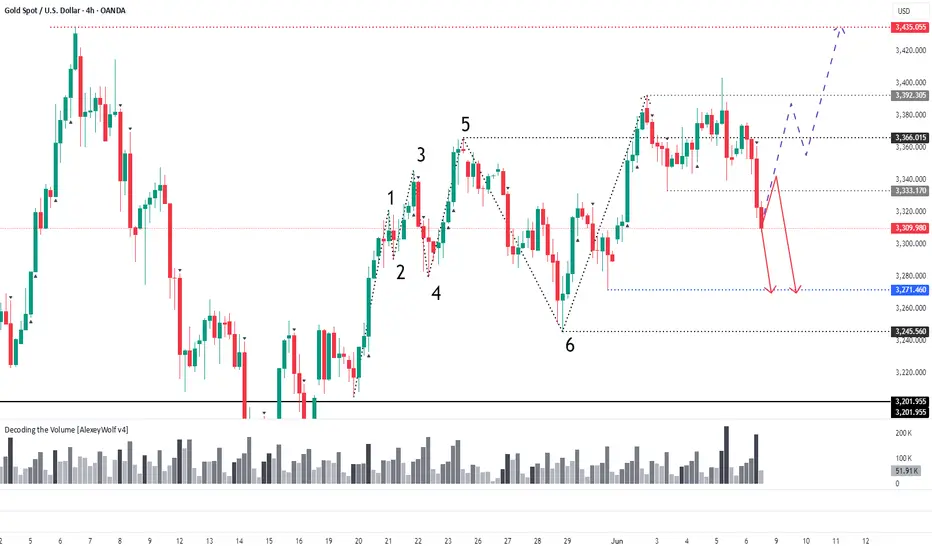
GOLD 4HLocal range near top of broader sideways (gray lines = local range).
Seller broke down from it.
Price now in buyer zone — possible buyer reaction. Just below: a gap.
Seller targets: 3271, 3245.
Conservative shorts: watch for buyer activity + seller defending local range breakout (3333).
Note: buyer initiative still active on daily TF (!).
For longs, better to wait near 3245–3271 and look for bullish patterns.
This analysis is based on the Initiative Analysis concept (IA).
Wishing you profitable trades!
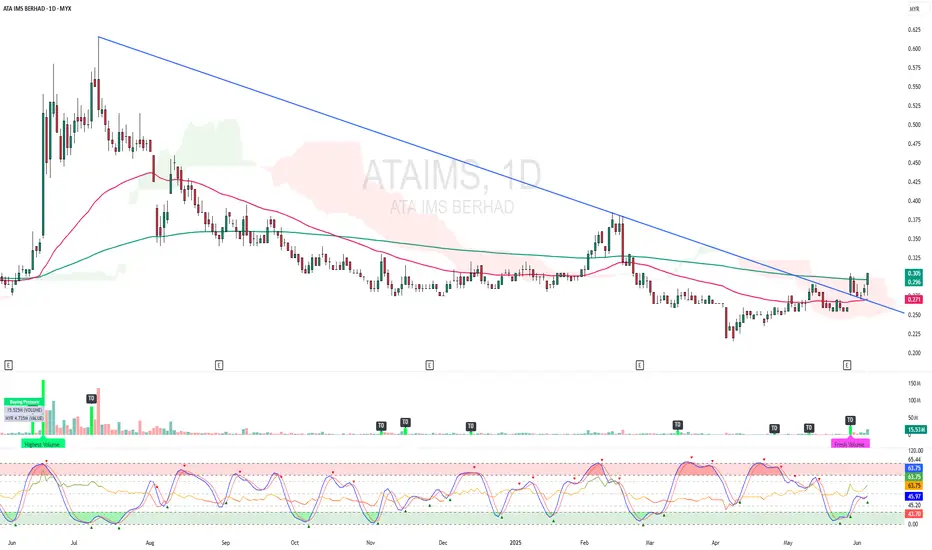
ATAIMS - BREAKOUT EMA 200 and CLOUD !ATAIMS - CURRENT PRICE : RM0.305
ATAIMS is bullish as the price is above EMA 50 and 200. The stock broke above EMA 200 and ICHIMOKU CLOUD on last FRIDAY (06 JUNE 2025) with high volume. Supported by technical reading in RSI heading upward, the stock may continue to move higher in the upcoming session.
ENTRY PRICE : RM0.300 - RM0.305
TARGET PRICE : RM0.340 and RM0.370
SUPPORT : RM0.270
Bitcoin to 120k or 150k next?The last setup on BITSTAMP:BTCUSD played out exactly as predicted. ()
As of today, June 8, 2025, Bitcoin is trading around $105,000 - $106,000 USD.
And it's been retesting the zone for quite a long time and it's time it broke out! It's less likely to reverse now (Still a possibility tho).
Predictions for Bitcoin's future price is wide, as many analysts are quite bullish:
Year-End 2025: Some experts are eyeing $150,000 USD and more by the end of 2025, citing factors like global liquidity expansion and continued institutional interest.
Do you think it's a possibility?

ETHEREUM is stacking up to fly! BINANCE:ETHUSDT ETHEREUM got a lot going for it right now. It's the backbone of a huge chunk of the crypto world, especially with all the DeFi and NFT stuff happening. Plus, there's always talk about big upgrades that could make it even better.
Right now, Ethereum's trading around $2,500, but some experts expect that it could climb way higher, maybe even past $8,000, if everything goes right.
That aside, I personally think $5,000 is achievable and to happen soon. It clearly broke out of the months long downtrend channel and with momentum. There's a lot of hate for ETH just for being expensive. But, let's be real, is not the 2nd biggest player in the market for nothing.
Let me know what you think? Open to counter ideas!
BINANCE:ETHUSDT

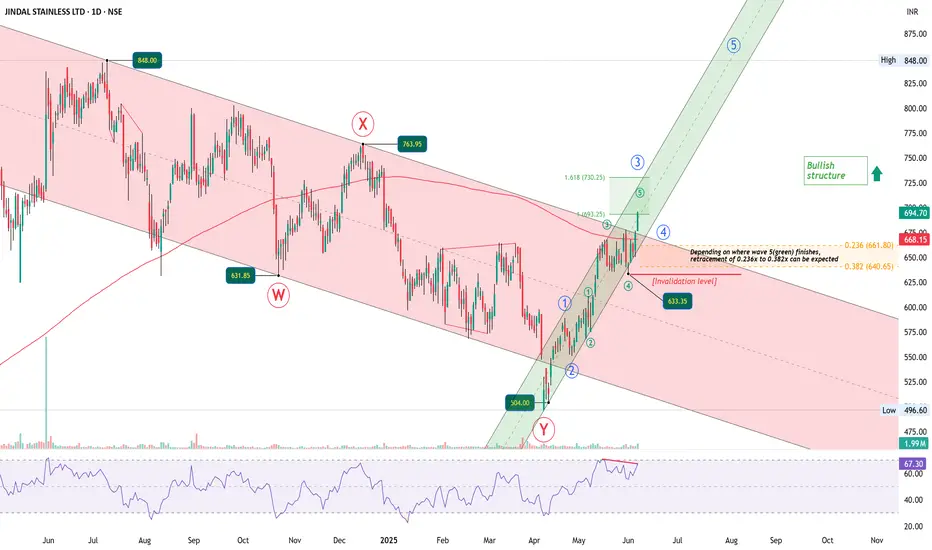
JINDAL STAINLESS Breaks the Channel – What’s Next?After completing a long WXY correction, Jindal Stainless has flipped into a strong uptrend. The price broke above the downtrend channel and also reclaimed the 200-day moving average — confirming strength.
The rally from 504 has unfolded as a nested 1-2, 1-2 impulse, and the wave 5 has now entered its 1 to 1.618 projection zone. We’re likely entering a blue Wave 4 pullback, especially as:
RSI shows bearish divergence
The rally looks stretched short-term
A healthy retracement toward the 661–640 zone can follow.
As long as 633.35 holds, this bullish structure remains intact.
Trend : Bullish
Retracement zone : 661.80 – 640.65
Invalidation : Below 633.35
This is a dynamic setup. Chart will be updated as price action unfolds
Disclaimer: This analysis is for educational purposes only and does not constitute investment advice. Please do your own research (DYOR) before making any trading decisions.
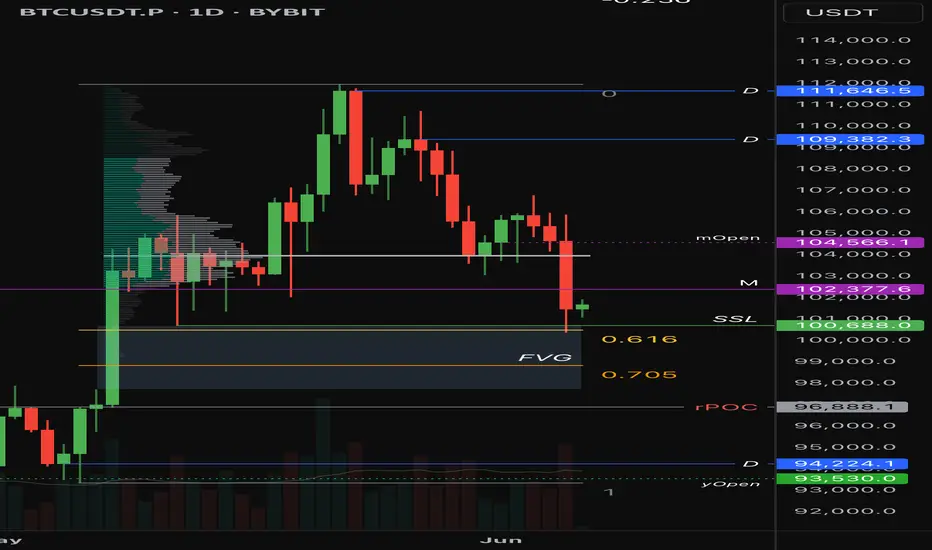
BITCOIN - HTF.HTF analysis on Bitcoin:
Anyone with eyes can read the Monthly structure and bias as being bullish, April swept the prev ATH at 108K, tapping the 111K levels, before selling off sharply (to be expected, price must come down, to go up, after all!). - Monthly context shows we need to do just that, and this week, we did!
I had the target as the Weekly Bullish FVG residing at 100K, and expected the reaction we have seen, however, now is where it gets interesting - as we can see on the Daily (TF of the chart in this example), we can see that price ran a daily ITL as well as 4H liquidity levels, on its way into the W FVG (happened on Thurs, not Fri, which was interesting considering the RFN on friday), and has since shown bullish displacement back to the upside.
Current Daily targets are 105-108K levels, if Bulls can recapture this area, we can expect some form of consolidation before another leg up. The ETF's (in my opinion) were the institutions and their 'Trojan Horse's' - so the higher we go, the more we can expect sell offs in the form of profit taking via institutional profit taking.
Conclusion - BULLISH BIAS, WITH THE HTF TARGETS BEING DAILY HIGHS, AND THE OVERALL MONTHLY TARGET OF A NEW ATH - 125K is the next logical HTF target based off a trend-based Fib extension.

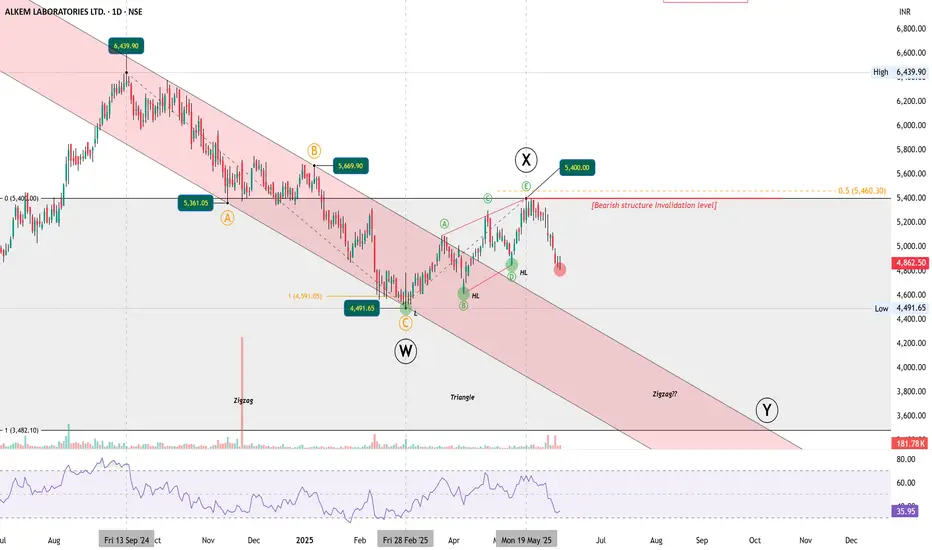
Bearish Structure Still in Control, But a Twist is PossibleALKEM continues to respect its larger downward channel, forming what looks like a classic W-X-Y corrective structure.
Wave W unfolded as a zigzag .
Wave X developed as a contracting triangle , ending near ₹5400.
The current drop appears to be the start of Wave Y , possibly forming another zigzag.
As long as price stays below ₹5460 (the 0.5 retracement of the entire W-Y structure), the bearish setup remains valid.
The RSI breakdown below 40 adds strength to the bearish bias. The projected Wave Y could extend toward the ₹3450 zone if symmetry with Wave W plays out.
Alternate Bullish Scenario :
While bearish remains the primary view, there's a low-probability bullish alternate :
If the move from the February lows to ₹5400 was actually a leading diagonal, then the current fall could be a Wave 2 correction. A sharp reversal from above ₹4491 might trigger a bullish breakout toward new highs.
Chart will be updated as price action evolves.
Disclaimer: This analysis is for educational purposes only and does not constitute investment advice. Please do your own research (DYOR) before making any trading decisions.
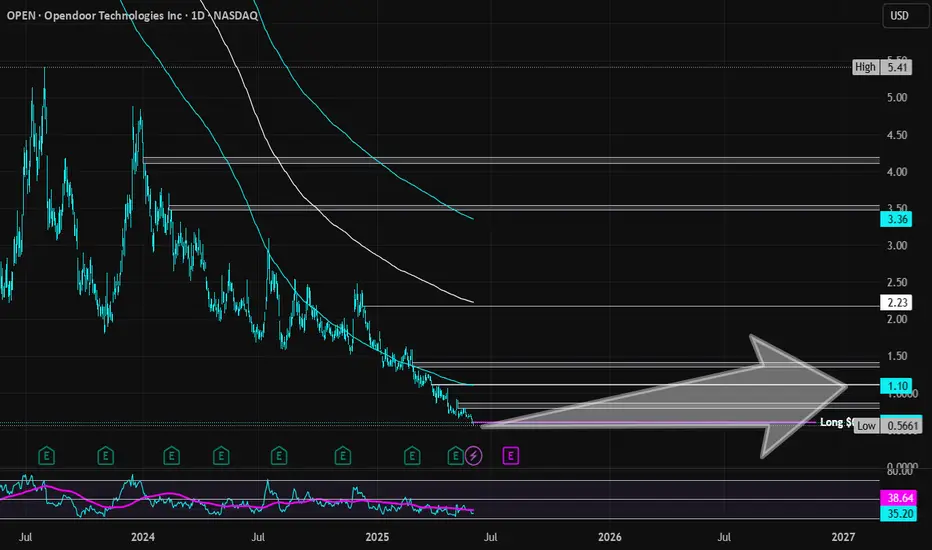
Opendoor Technologies | OPEN | Long at $0.60Opendoor Technologies $NASDAQ:OPEN. This is purely a swing trade for a company that has been posting declining earnings and revenue since 2022 and does not anticipate becoming profitable in the next 3 years. Since the stock is now under $1, it's at-risk of being delisted from the Nasdaq. I am entering this play because there is a chance the recent price hit near $0.50 may be a temporary bottom and there is enough short interest (near 18%) for a spike near its book value of $1.00. Quick ratio is 0.75 (i.e. company may have difficulty meeting its short-term obligations without selling inventory or acquiring additional financing). While the company may be forced to do a split (a major risk for this purchase), I can see other eyes viewing this as a potential "quick play" for a reversal near its book value.
At $0.60, NASDAQ:OPEN is in a personal buy zone for a swing trade.
Targets:
$0.87 (+45%)
$1.00 (+66.7%)
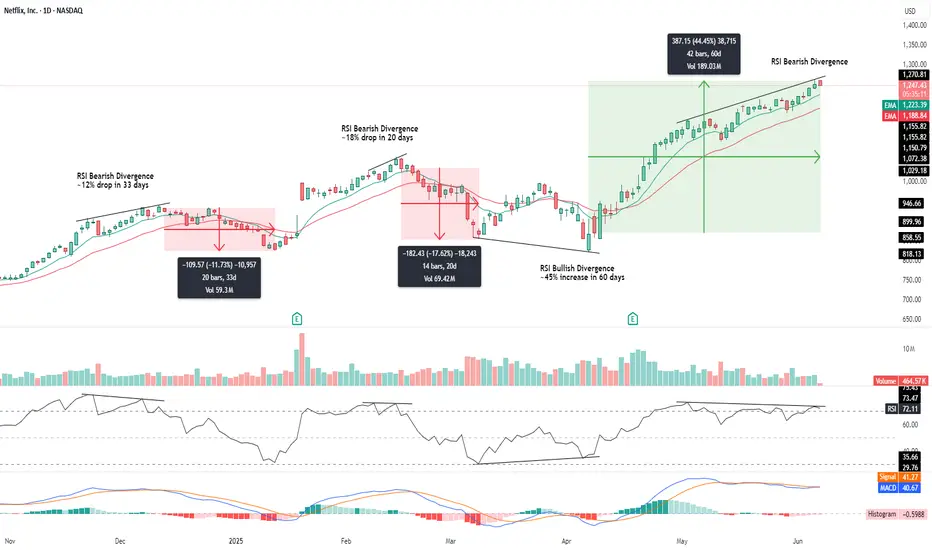
Netflix (NFLX) RSI Bearish Divergence Setting Up Major Rever📈 Summary:
Netflix has rallied +44% in just 60 days, entering a steep, parabolic move. However, technical exhaustion signs are now flashing across multiple indicators — suggesting a potential near-term top may be forming.
🔍 Key Technical Observations:
1. Bearish RSI Divergence
The RSI is making lower highs (~73) while price makes higher highs → classic bearish divergence.
Similar divergences in December and February led to drops of –12% and –18% , respectively.
2. Parabolic Move + Rising Wedge
Price has broken out of an orderly channel and is now moving parabolically , a pattern typically unsustainable.
The current structure resembles a rising wedge , often a reversal formation .
3. Volume Weakness
Volume has been declining throughout the recent push , signaling weak demand behind the rally.
No climactic buying — this raises the risk of a sharp drop if momentum fades .
4. MACD Losing Momentum
MACD histogram has flipped slightly negative.
A potential bearish crossover is brewing.
🧭 Strategy Outlook
🚨 Aggressive traders could look for short opportunities below $1,240 , where support may break.
🧠 Options traders might consider a bear call spread once a daily close confirms the wedge breakdown.
📌 Key Levels
Support to watch: $1,240 (break = confirmation)
Next support zone: $1,190–1,155 (EMA cluster)
Critical RSI trigger: break below 65 confirms bearish divergence playing out
🧩 Final Thoughts
The RSI divergence, parabolic structure , and volume behavior all align for a potential pullback . While the trend is still technically intact, risk-reward favors preparing for a reversal , especially with prior divergences leading to significant downside.
$STX / USDT (4H) – Golden pocket re-entryCOINBASE:STXUSD is testing the 0.618 Fib retracement ($0.65)
A zone where smart money often re-enters after corrections.
Confluence:
🔹 TD9 buy
🔹 RSI divergence
🔹 Fading momentum
🔹 Volume pickup near support = early demand?
Reclaim $0.72 could trigger a relief rally to $0.78–$0.80
Break $0.65 opens $0.56 and $0.47.


XRP/USDT at Key Support | Trendline Pressure Builds
ABT is currently testing a strong horizontal support zone around 2.08–2.15 USDT after rejecting from the descending trendline.
This area has held multiple times in the past, showing strong buying interest. If the support holds and price breaks above the yellow trendline, we could see a short-term bullish move toward the 2.30–2.45 resistance zone.
RSI is recovering from oversold levels, signaling potential for a reversal, but volume confirmation is still weak.
⚠️ Key levels to watch:
Support: 2.08–2.15
Resistance: 2.30 and 2.45
Breakout zone: Above descending trendline
I'm waiting for a clear breakout with strong volume before considering long positions.

REVERSE HEAD AND SHOULDER PATTERNSCrude oil looks good can go long with Stoploss. Bigbreakout expected

Consolidation Breakout forming on Dhampur Sugar1. Stock is consolidating below 151 resistance, forming higher lows with a bullish structure.
a breakout required above 151 with strong volume to a fresh bullish move.
2. price action shows a volatility contraction.
3. moving averages sloping up trend intact. wait for volume breakout and bullish close.
4. volume has since declined but remains stable, showing healthy consolidation.

Btc ran stopsQuick wick as a swing fail pattern and poked into the fair value gap inefficiency, looks like we might get a retest and we’ll see how it goes. We might get 150k BTC before GTA 6
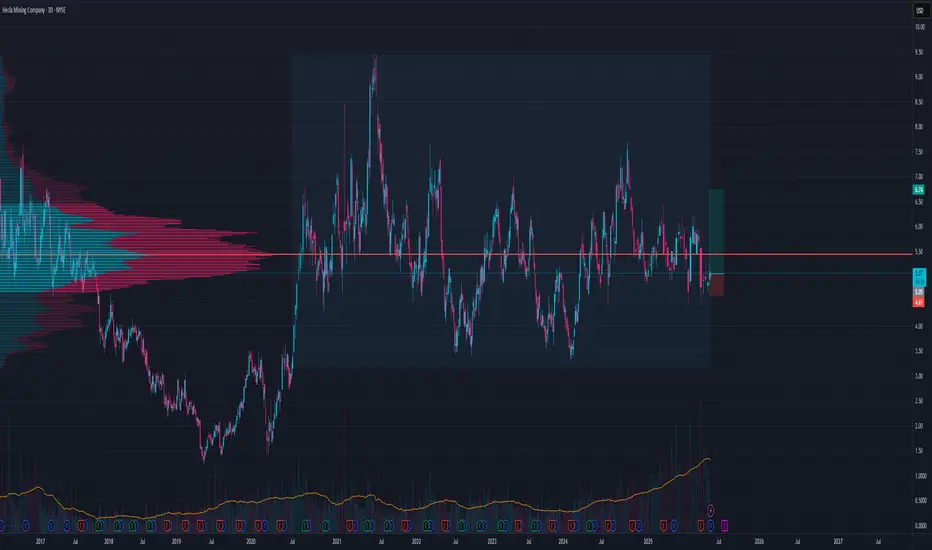
Silver Mining LongNot the best Silver Mining Company but the setup and risk/reward is good
TP1 6.19
TP2 6.46
TP3 6.72
SL 4.61
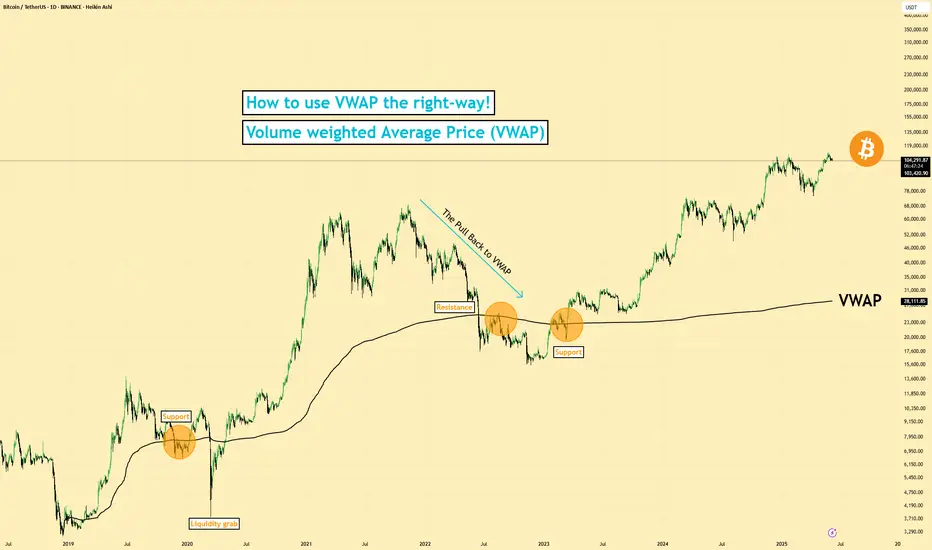
How to use VWAP the right-way on TradingView
1️⃣ What Is VWAP (Volume Weighted Average Price)?
VWAP stands for Volume Weighted Average Price. It's a tool that shows the average price an asset has traded at throughout the day, adjusted for volume. That means it gives more weight to prices with high trading volume.
✅ It helps traders and investors see if the current price is above or below the average price paid.
✅ It’s often used by institutional traders, such as mutual funds and pension funds, to enter and exit positions without causing major price moves.
VWAP = (Sum of Price * Volume) / Total Volume
2️⃣ Why VWAP Matters
I (Traders) often use VWAP as a dynamic support or resistance zone.
- Price below VWAP: considered undervalued by some 👉 may act as support
- Price above VWAP: considered overvalued 👉 may act as resistance
It acts like a magnet for price, especially in trending markets.
VWAP is also used as a benchmark for large players want to buy below VWAP or sell above it.
3️⃣ Anchored VWAP (AVWAP)
Anchored VWAP is a more advanced version of VWAP. Instead of starting at the market open, you anchor it to a specific candle (pivot high or low).
🔍 Why use it:
- Lets you analyze the average price from key market turning points
- Helps spot institutional interest near pivots
- More accurate for swing trading
When you anchor VWAP to a major high or low, it gives you clean zones where smart money might enter or exit.
4️⃣ How I Use Anchored VWAP
I personally anchor VWAP from:
- Major pivot highs/lows
- Breakout points
- Strong reversal candles
Then I watch how price interacts with it.
✅ Works well on 30m and 4H charts for intraday or swing setups
✅ Can be combined with fixed range volume profile for extra confluence
If you haven’t read my guide on fixed range volume profile, scroll below — it’s linked there.
5️⃣ Common Uses
✔️ Support and resistance zone in trending markets
✔️ Institutional entry/exit level benchmark
✔️ Reversion-to-mean setups
VWAP is used across timeframes. I use higher timeframes like 4H to spot trend zones, then zoom into 30m or 15m for entries.
Setting and more information
VWAP Explained by TradingView: tradingview.sweetlogin.com
Anchored VWAP Explained by TradingView: tradingview.sweetlogin.com
6️⃣ VWAP Limitations
⚠️ VWAP doesn’t work well in all cases:
- In sideways/choppy markets, it can lose value
- It is not an exact entry/exit signal, but rather a dynamic zone
- In FX markets, it’s unreliable due to lack of centralized volume data
Also, treat VWAP as a zone, not a line. Large players fill big orders in that area, expect false moves or liquidity grabs.
7️⃣ Mistakes to Avoid
❌ Entering blindly on VWAP touches
❌ Using VWAP without confirmation from price action or volume
❌ Assuming it always gives perfect levels
It works best when combined with other tools, such as market structure, support/resistance, and volume profile.
8️⃣ Final Thoughts
VWAP is a powerful tool to see where price is relative to volume-based value. Anchoring VWAP to key levels adds precision and insight.
Used properly, it helps:
- Spot where institutions might be active
- Confirm high-probability zones
- Improve entries/exits when paired with other tools
Examples are provided below to show how VWAP works in real-time setups. This guide is educational and for learning purposes only.
VWAP Zone and a Example trade CRYPTOCAP:BTC
Example Stock Market NASDAQ:AAPL
Example Resistance NASDAQ:MSTR
VWAP (Volume Weighted Average Price) helps traders see the average price weighted by volume. It's commonly used by institutions to identify good entry/exit zones. Anchored VWAP takes this further by starting from key points like pivot highs/lows for more accuracy. It's most useful in trending markets and works best when combined with tools like fixed range volume profile or support/resistance. While powerful, VWAP isn’t perfect it should be used as a dynamic zone, not a fixed level, and always with other confirmations.
Disclaimer: This is not financial advice. Always do your own research. This content may include enhancements made using AI.
Update on $Zeus This play played out perfectly. TP Smashed. Locked in 60% profits and letting 40% ride. With official IP just acquired and a bull market on the horizon in the crypto world, this could be major..
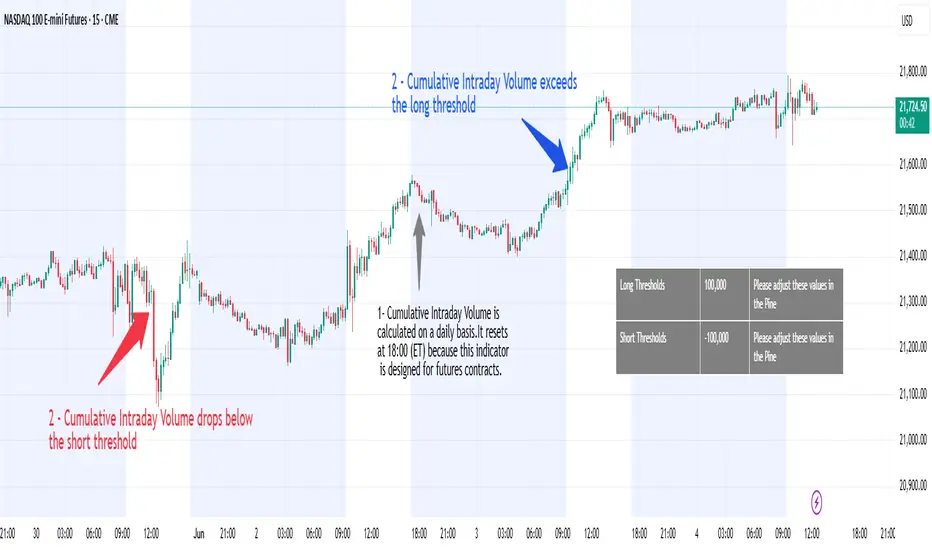
Volume Speaks Louder: My Custom Volume Indicator for Futures
My Indicator Philosophy: Think Complex, Model Simple
In my first “Modeling 101” class as an undergrad, I learned a mantra that’s stuck with me ever since: “Think complex, but model simple.” In other words, you can imagine all the complexities of a system, but your actual model doesn’t have to be a giant non-convex, nonlinear neural network or LLM—sometimes a straightforward, rule-based approach is all you need.
With that principle in mind, and given my passion for trading, I set out to invent an indicator that was both unique and useful. I knew countless indicators already existed, each reflecting its creator’s priorities—but none captured my goal: seeing what traders themselves are thinking in real time . After all, news is one driver of the market, but you can’t control or predict news. What you can observe is how traders react—especially intraday—so I wanted a simple way to gauge that reaction.
Why intraday volume ? Most retail traders (myself included) focus on shorter timeframes. When they decide to jump into a trade, they’re thinking within the boundaries of a single trading day. They rarely carry yesterday’s logic into today—everything “resets” overnight. If I wanted to see what intraday traders were thinking, I needed something that also resets daily. Price alone didn’t do it, because price continuously moves and never truly “starts over” each morning. Volume, however, does reset at the close. And volume behaves like buying/selling pressure—except that raw volume numbers are always positive, so they don’t tell you who is winning: buyers or sellers?
To turn volume into a “signed” metric, I simply use the candle’s color as a sign function. In Pine Script, that looks like:
isGreenBar = close >= open
isRedBar = close < open
if (not na(priceAtStartHour))
summedVolume += isGreenBar ? volume : -volume
This way, green candles add volume and red candles subtract volume, giving me positive values when buying pressure dominates and negative values when selling pressure dominates. By summing those signed volumes throughout the day, I get a single metric—let’s call it SummedVolume—that truly reflects intraday sentiment.
Because I focus on futures markets (which have a session close at 18:00 ET), SummedVolume needs to reset exactly at session close. In Pine, that reset is as simple as:
if (isStartOfSession())
priceAtStartHour := close
summedVolume := 0.0
Once that bar (6 PM ET) appears, everything zeroes out and a fresh count begins.
SummedVolume isn’t just descriptive—it generates actionable signals. When SummedVolume rises above a user-defined Long Threshold, that suggests intraday buying pressure is strong enough to consider a long entry. Conversely, when SummedVolume falls below a Short Threshold, that points to below-the-surface selling pressure, flagging a potential short. You can fine-tune those thresholds however you like, but the core idea remains:
• Positive SummedVolume ⇒ net buying pressure (bullish)
• Negative SummedVolume ⇒ net selling pressure (bearish)
Why do I think it works: Retail/intraday traders think in discrete days. They reset their mindset at the close. Volume naturally resets at session close, so by signing volume with candle color, I capture whether intraday participants are predominantly buying or selling—right now.
Once again: “Think complex, model simple.” My Daily Volume Delta (DVD) indicator may look deceptively simple, but five years of backtesting have proven its edge. It’s a standalone gauge of intraday sentiment, and it can easily be combined with other signals—moving averages, volatility bands, whatever you like—to amplify your strategy. So if you want a fresh lens on intraday momentum, give SummedVolume a try.
Beautiful Market Maker on the Nasdaq this early morning.This will be an entire move downward that no one is picking up on right now. With price in the perfect sell position, we're looking to collect on the spread between greed and far like a true market maker