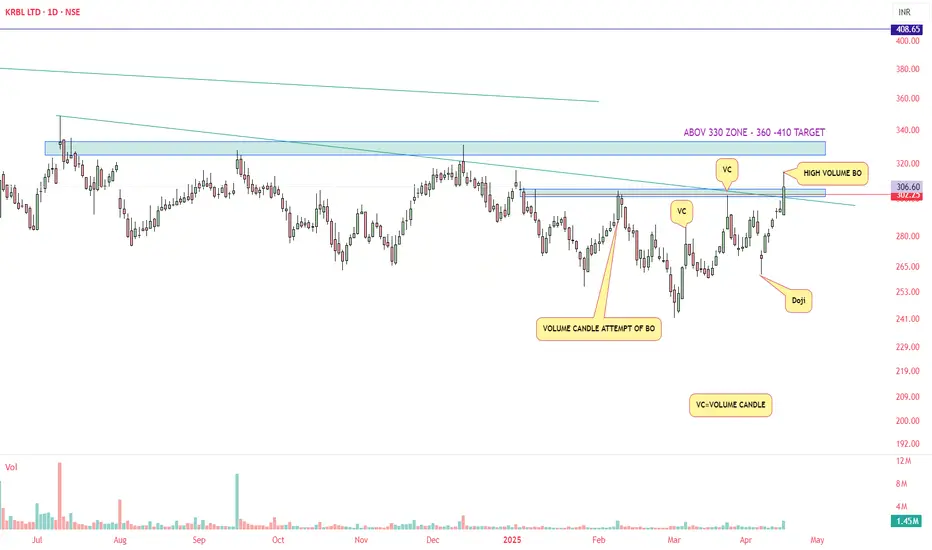
KRBL DAILY TIME FRAME VOLUME AND SUPPLY DEMAND ZONEHere, in chart I have tried to explain the supply zone, where we observe a volume based Breakout. above this zone there is one major zone of 332 above which we may reach the final destination of 408-410.
KRBL is leading manufacturer in Basmati Rice (Famous name is India Gate Basmati Rice) after its competitor LT Foods (DAWAAT).
Volume
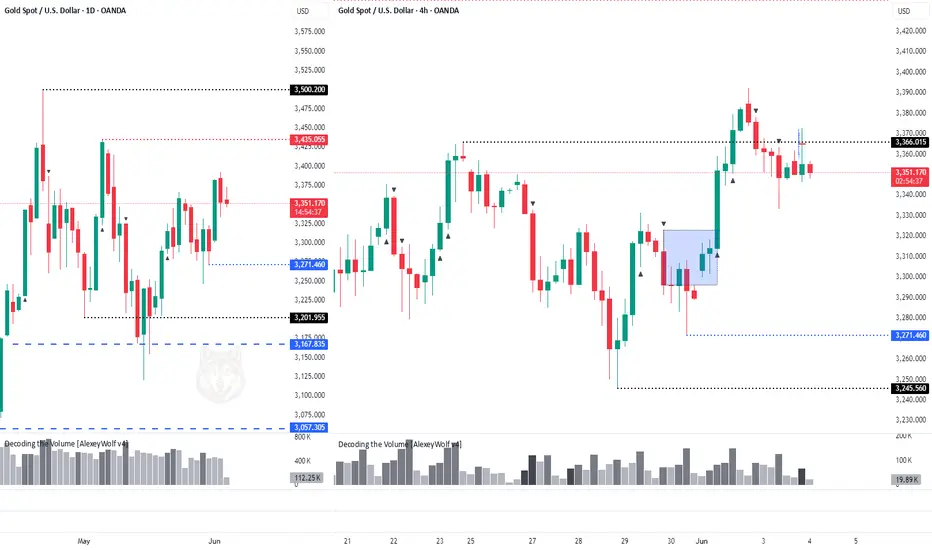
GOLD — Daily & 4H Timeframes📍 GOLD — Daily & 4H Timeframes
On the daily timeframe, gold is targeting the 3435 level.
On the 4-hour chart, buyers attempted to break out of the sideways range, but the price was pulled back inside.
A second attempt also failed — only the wick extended beyond the range, where the key volume is located.
It’s likely that the price will test the buyer zone again (blue rectangle on the chart), which also contains a price gap.
The boundaries of the sideways ranges are marked with black lines.
This analysis is based on the Initiative Analysis concept (IA).
Wishing you profitable trades!
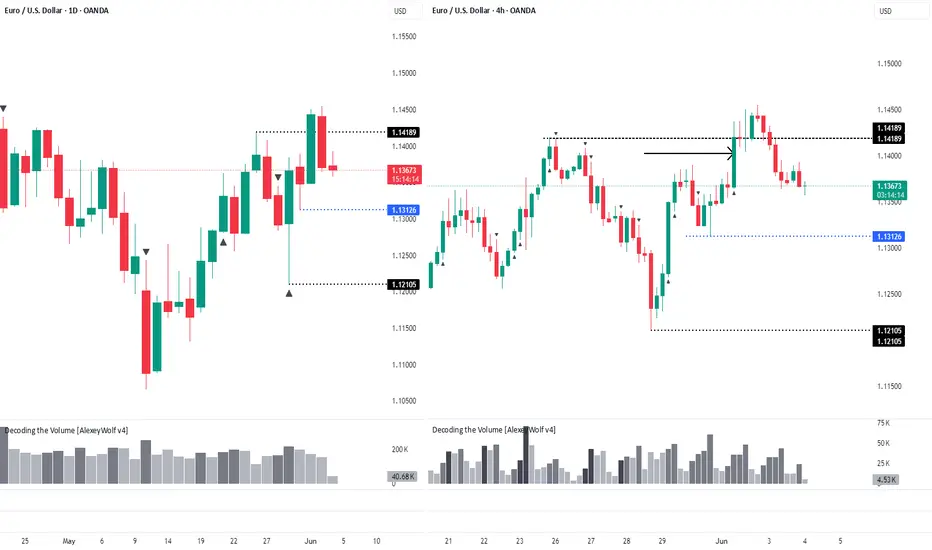
EURUSD — Daily & 4H TimeframesThe correction continues on EURUSD.
Both the daily and 4H timeframes show sideways ranges, with seller initiative in control. The boundaries of the sideways ranges are marked with black lines.
However, sellers appear weak — the price has been stuck for several hours inside a buyer attack bar near the upper boundary of the range. Now, sellers are attempting to absorb this buyer bar.
If considering long setups, it's safer to look for patterns near the daily level of 1.13126, or from the lower boundary of the 4H range.
Another option is to wait for a confirmed breakout above the range.
Searching for buys in the upper part of the current range is risky.
This analysis is based on the Initiative Analysis concept (IA).
Wishing you profitable trades!
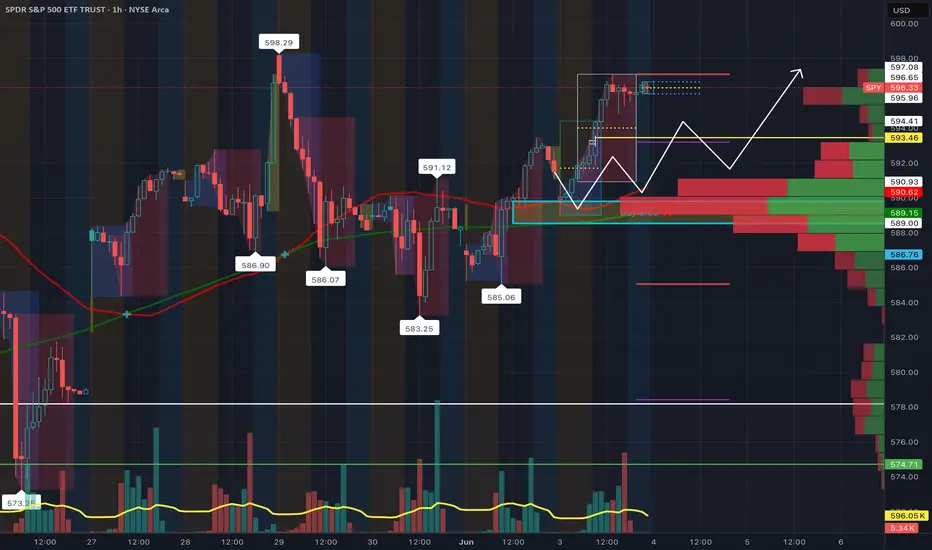
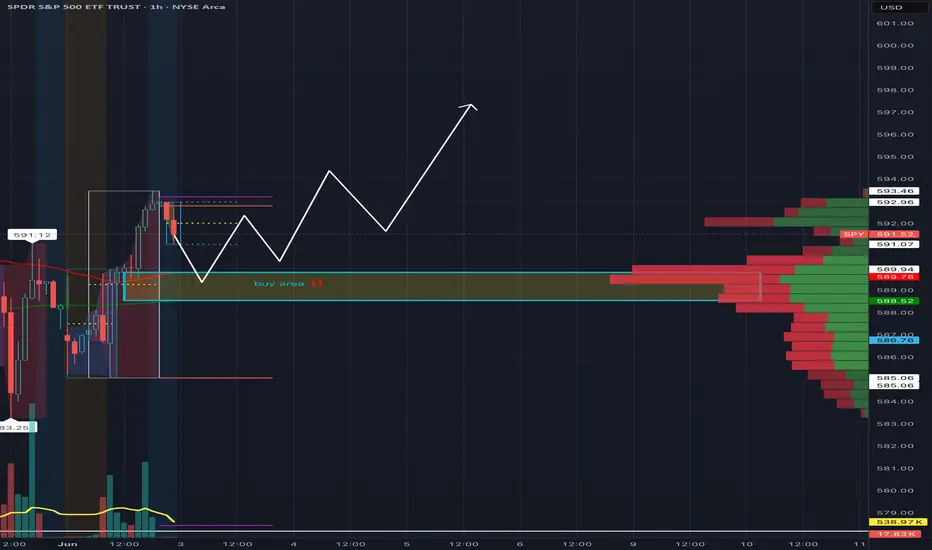
SPY Inverse Head & Shoulders Played Out Clean – Bounce from Buy Just wanted to follow up on the AMEX:SPY idea I published yesterday — this played out exactly as expected 👇🏾
We got that clean pullback right into the 588.50–589.90 buy zone, which aligned perfectly with high-volume support. From there, price reversed and gave us that upside move back toward 593+.
Even more validating: the pattern that formed was a textbook inverse head and shoulders
🔹 Left Shoulder → formed near 586
🔹 Head → at the deeper 585 level
🔹 Right Shoulder → bounced cleanly off the buy zone
🔹 Neckline Break → confirmed the move above 591.12
This is why I always say: have your levels ready and wait for confirmation. No chasing, just execution.
🔑 Buy zone held
📊 Volume-backed support
📈 Continuation in progress
Will continue monitoring for follow-through above 593.46. If bulls hold control, next resistance is near 596–597.
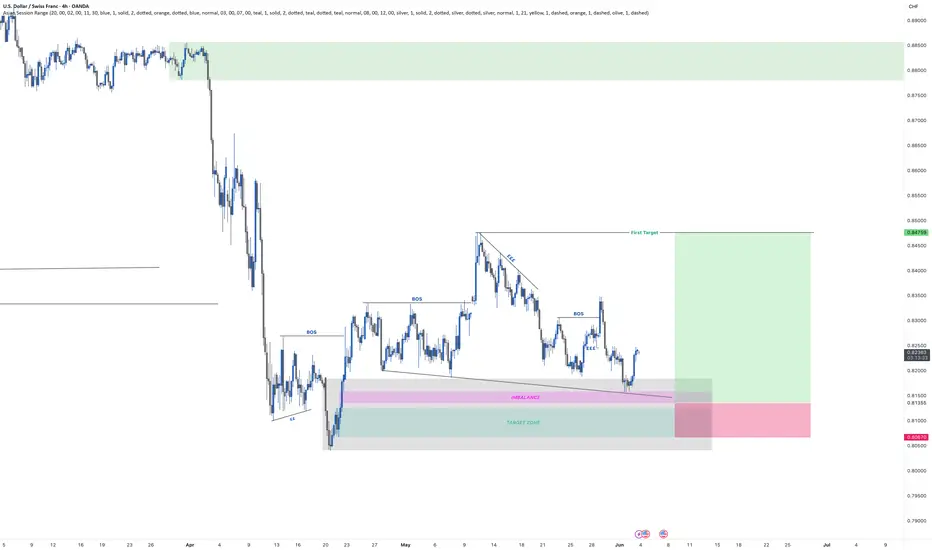
USDCAD - Longkeeping close tabs on this one.
Price is showing signs of reversing after breaking the previous lows on the higher timeframe.
Unsure yet as to whether I will trade it. But its certainly one to watch
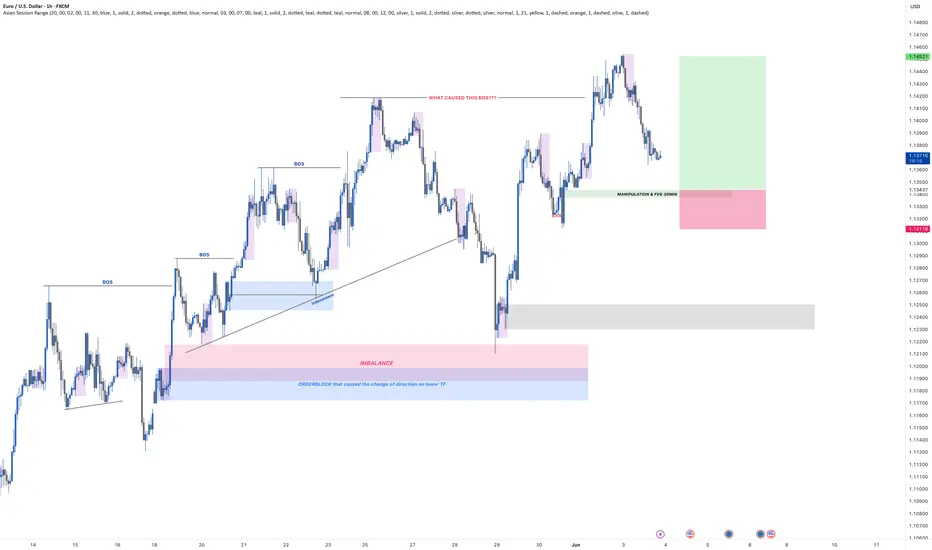
EURUSD - LONGLooking at the EURUSD most recent BOS
MAIN Entry
- There was a manipulation on the lower TF in which the FVG (fair value gap) was caused.
- it is also the origin of where price cause the price the break previous structure.
Secondary ENTRY
- Secondary entry will be down at the grey box.
- Will cover this if the first position fails
$WIF/USDT POTENTIAL PUMP INCOMING? Chart Overview
- Bullish Bat Pattern, suggesting potential reversal near completion point D.
- Price recently completed the pattern, currently near trendline and 0.618 Fib retracement zone.
- (OBV) broke out of consolidation, hinting potential volume shift.
Demand Zone / Support
- Demand Zone : $0.30–$0.41 (green box ).
- Key Trendline Support : Rising trendline from May remains intact.
Supply Zone / Resistance
Supply Zone : $1.18 – $1.38 (purple box).
This area aligns with the high volume node on the right-side volume profile.
Strong rejection likely if price approaches without major breakout.
Volume Profile
High Volume Node (HVN): $1.06 - $1.15 , confirming strong interest/previous consolidation.
Low Volume Node (LVN): $0.80 – $0.95 , suggesting potential fast moves up/down.
Fair Value Gaps (FVG)
First FVG: ~$0.96 – $0.98
Second FVG: ~$0.89 - $0.92
These are targets if price moves upward.
Fibonacci Levels
- 0.618 retracement (~$0.85) aligns near trendline — major confluence.
- 0.786 retracement (~$0.71) rests below trend line.
Bullish Scenario
- Price holds above 0.618 Fib (~$0.85) and bullish trendline.
- Breaks above to fill FVG and move toward $1+.
- OBV breakout supports accumulation and incoming demand.
Bearish Scenario
- Price breaks below $0.65 and loses trendline.
- Bearish invalidation of Bat pattern, opening room to drop to:
- Fib Lev 1 or deeper into the $0.50–$0.40 zone.
- Volume fades on OBV
Risks
- Trendline Break : Potential aggressive sell-off.
- Volume Drop : If OBV rally fails, buyers dry up.
- Macro/Sentiment : WIF is meme-sensitive.
Summary
Bullish Bat completion with price testing a high-confluence zone (trendline + 0.618 Fib).
Many upside targets with FVGs.
If Price breaks below trend line and 0.65, bullish/long predictions will be invalid.

What is a Bearish Breakaway and How To Spot One!This Educational Idea consists of:
- What a Bearish Breakaway Candlestick Pattern is
- How its Formed
- Added Confirmations
The example comes to us from EURGBP over the evening hours!
Since I was late to turn it into a Trade Idea, perfect opportunity for a Learning Curve!
Hope you enjoy and find value!

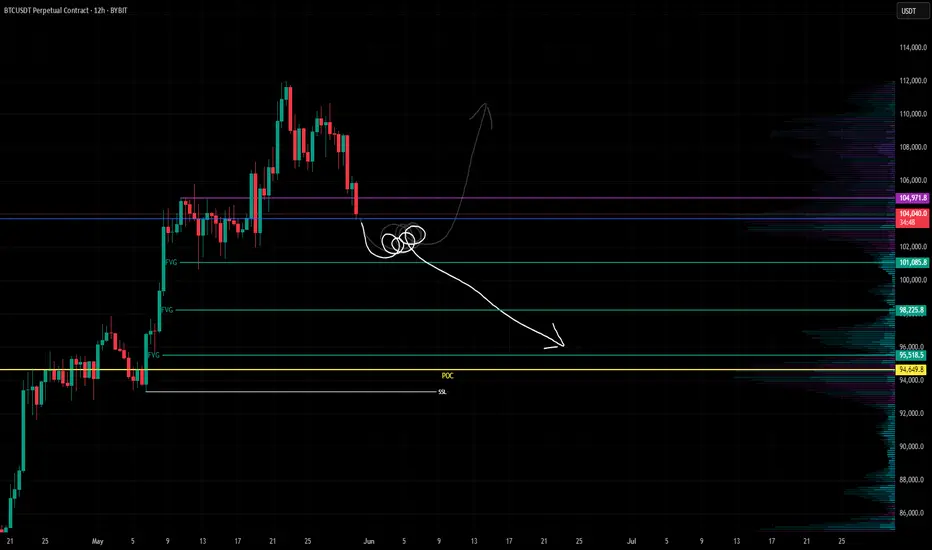
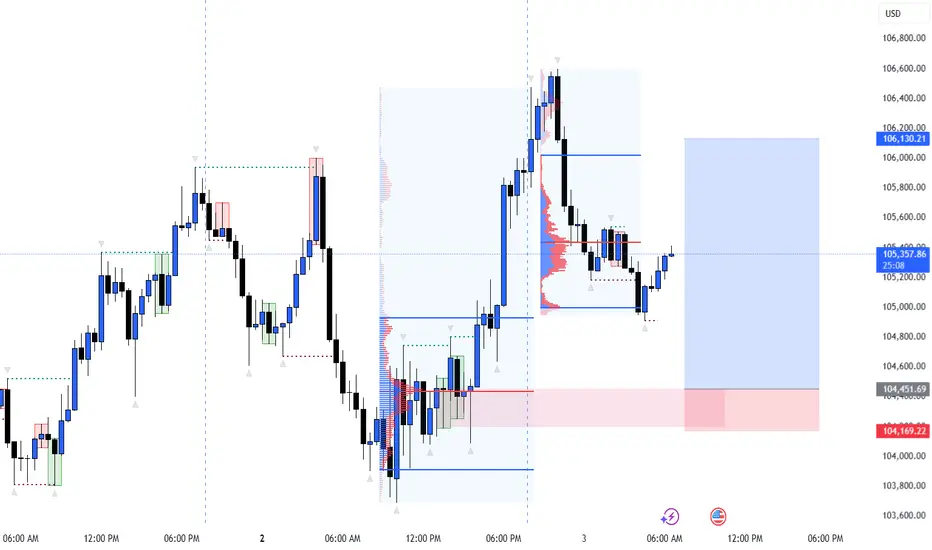
BTCUSD IS BULLISH BUT TRUMP MIGHT SPOIL IT, BEWARE!🧠 Context:
We’re looking at BTCUSD after a textbook liquidity sweep, demand zone reaction, and clear structure shift. This chart beautifully displays institutional order flow, giving us a high-probability long setup.
🔍 Detailed Breakdown:
✅ 1. Liquidity Sweep & Demand Reaction:
Price made a sharp move downward into a previous demand zone (marked red).
The move into 104,169–104,451 region swept sell-side liquidity resting below previous lows.
The strong bullish engulfing candle from that zone confirms mitigation of a bullish order block.
🔁 2. Break of Structure (BoS):
Post-demand tap, BTC broke above a minor supply structure, forming a higher high.
This is our confirmation of a short-term bullish market structure shift.
🎯 3. Entry Setup:
Price retraced slightly after the break of structure and appears to be forming a higher low.
Current price is around 105,309, a potential entry for longs.
🧱 4. Target Zones:
TP1: 105,800 – fill inefficiency zone
TP2: 106,130.21 – supply zone / previous high
SL: Below demand zone (~104,150) — below OB and liquidity sweep
🧊 5. Volume Profile Insight:
High volume node concentrated at the lower consolidation, signaling accumulation.
Price is now trading above POC, supporting a bullish continuation narrative.
🧭 Conclusion:
This BTCUSD setup shows classic Smart Money reversal mechanics:
✅ Liquidity grab
✅ Order block tap
✅ Structure break
✅ Volume confirmation
📈 Bias: Bullish
🎯 Long targeting 106,130
🛑 SL below 104,169
🔔 Manage risk and monitor lower timeframes for confirmation. BTC has room to run, but always watch reaction at key zones.
Rising from the Ashes: CUMMINS INDIA's Grand Wave 5 Launch?After a soul-sucking 11-month correction that chewed through every classic pattern — flats, triangles, zigzags, combos — CUMMINS INDIA may finally be ready for lift-off.
A WXYXZ correction has reached its climax in a clear Wave 4 low near ₹2580, completing the complex structure inside a descending channel.
But the game changed when price:
Broke the 200 SMA
Blasted through the channel
Punched RSI above 70 for the first time since May 2024
And did it with volume breakout
Now, all eyes are on Wave 5 — projected to aim for:
1.0 extension: ₹3569
1.618 extension: ₹3812
Can we reach a new ATH above ₹4171? It’s possible — if this unfolds through nested 1-2-3s, we may be witnessing the start of a larger degree rally.
Invalidation : Below ₹2706. If it breaks, the count may need a rework .
For now? Wait until it retraces to launchpad.?
Disclaimer: This analysis is for educational purposes only and does not constitute investment advice. Please do your own research (DYOR) before making any trading decisions.

SPY 1HR Pullback to Volume Buy Zone Before Bullish ContinuationI’m watching the 588.52–589.94 range as a high-probability buy zone on the SPY 1-hour chart. This zone aligns with a strong volume shelf, indicating prior institutional accumulation and heavy transaction flow.
After a sharp move into the 591s, we’re seeing some hesitation and potential for a healthy pullback. The plan is to wait for price action to return to the buy zone, show signs of strength (e.g., hammer candle, strong bounce), and look for a continuation toward the previous high of 593.46 and possibly higher.
🔹 Buy Zone: 588.52–589.94
🔹 Volume Profile Support: High node at ~589
🔹 Resistance: 591.12 short-term, then 593.46
🔹 Stop Loss: Below 586.76 to avoid false breakouts
🔹 Target: 593.50+ with higher timeframe continuation in mind
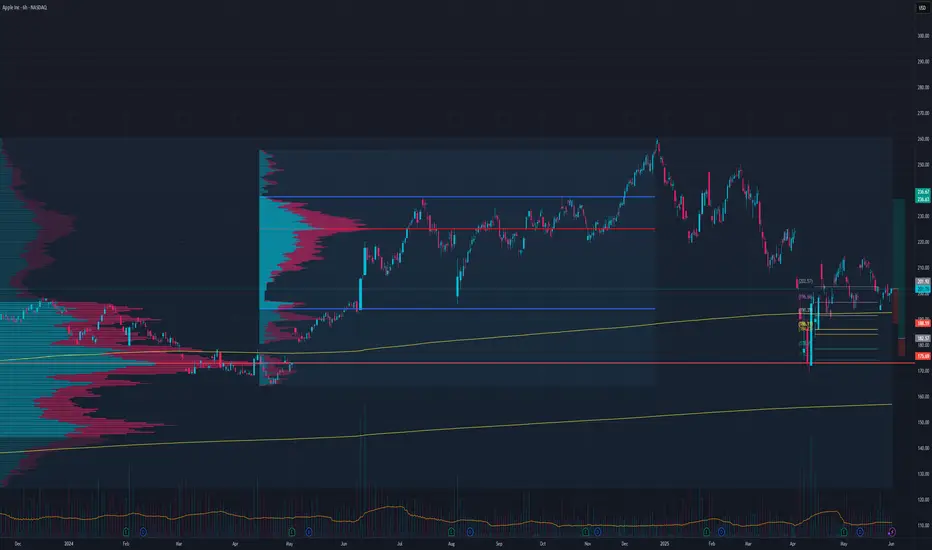
AAPL Long HereSetups here for longs
This looks good for an entry at market on open but flat of lower would be preferred
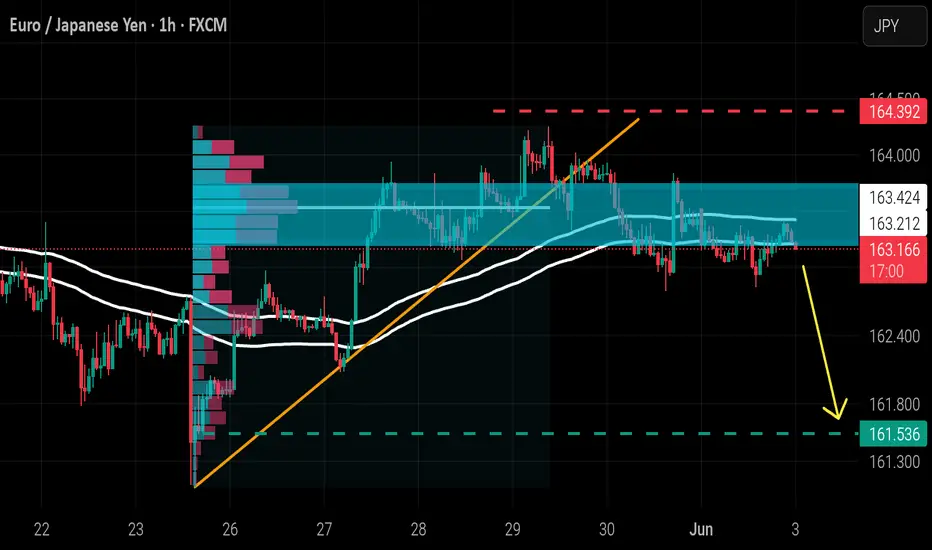
EUR / JPYAfter breaking the uptrend line and moving averages and closing below the volume zone, we will now enter selling.
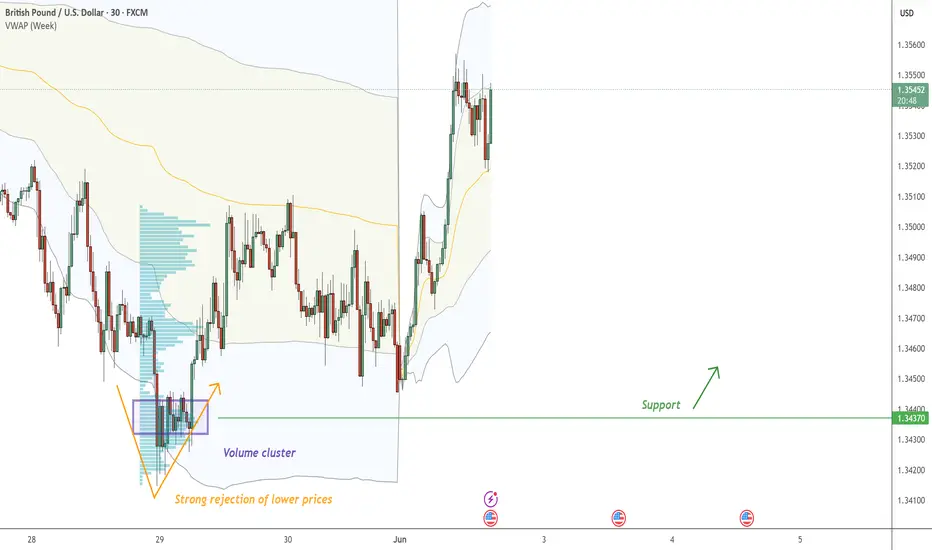
GBP/USD - Rejection of lower prices On GBP/USD , it's nice to see a strong buying reaction at the price of 1.34370.
There's a significant accumulation of contracts in this area, indicating strong buyer interest. I believe that buyers who entered at this level will defend their long positions. If the price returns to this area, strong buyers will likely push the market up again.
Rejection of lower prices and high volume cluster are the main reasons for my decision to go long on this trade.
Happy trading
Dale
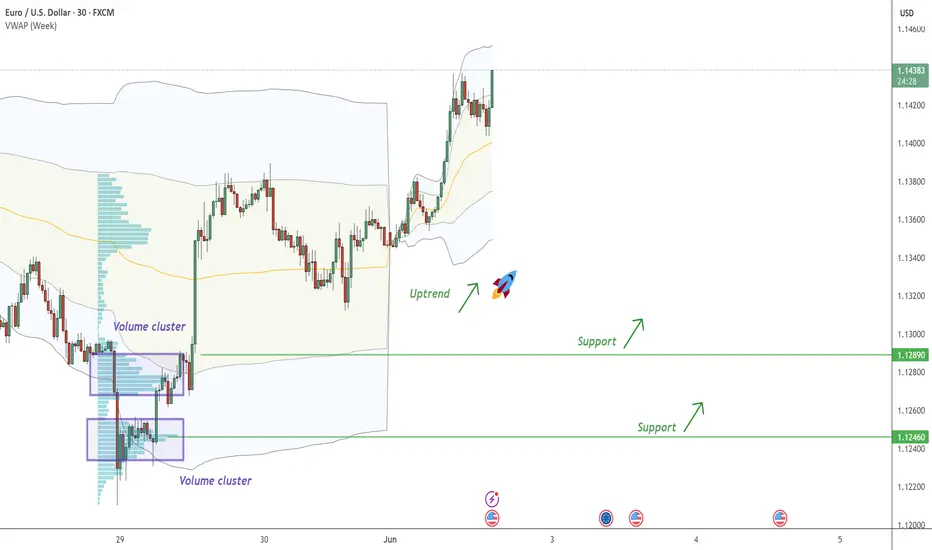
EUR/USD - continue with the UptrendOn EUR/USD , it's nice to see a strong buying reaction at the price of 1.12890 and 1.12460 .
There's a significant accumulation of contracts in this area, indicating strong buyer interest. I believe that buyers who entered at this level will defend their long positions. If the price returns to this area, strong buyers will likely push the market up again.
Uptrend and high volume cluster are the main reasons for my decision to go long on this trade.
Happy trading
Dale
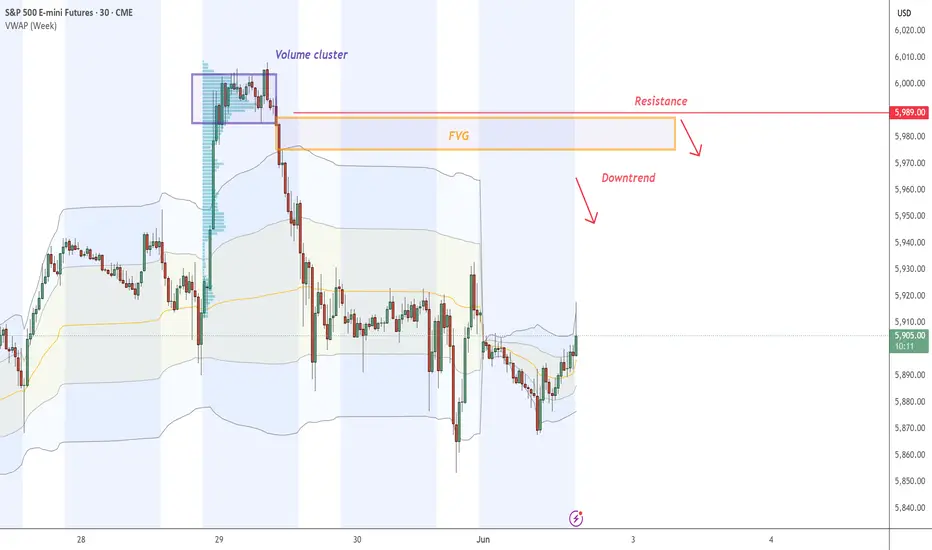
ES - Day Trading Analysis With Volume ProfileOn ES , it's nice to see a strong sell-off from the price of 5989. It's also encouraging to observe a strong volume area where a lot of contracts are accumulated.
I believe that sellers from this area will defend their short positions. When the price returns to this area, strong sellers will push the market down again.
Fair Value GAP (FVG) and Volume cluster are the main reasons for my decision to go short on this trade.
Happy trading,
Dale
Silver micro: range breakoutSilver micro futures are trading in range for approx 13 days now. Currently trying to break the range with high relative volume. If it sustains above 98450, breakout can continue and range expansion in prices may happen. The stoploss at current price is very small as compared to the probable reward. Very high probability trade with a smaller risk.
Silver micro is in uptrend. and this is continuation breakout trade.

Understanding VWAP In TradingWhat is VWAP?
VWAP is a price benchmark that gives more importance to prices where higher trading volume occurs. Unlike simple moving averages, which treat each price point equally, VWAP provides a volume-weighted perspective, making it more representative of market activity.
Traders use VWAP to gauge market trends, confirm trade entries and exits, and measure the quality of executions relative to the market's liquidity.
How Institutional Traders Use VWAP
Large financial institutions and mutual funds execute large orders over time to minimize their market impact.
VWAP helps them:
Achieve better execution by ensuring their orders are filled at a price close to the session's average.
Reduce market impact by avoiding aggressive buying or selling at extreme price points.
Gauge liquidity and time their orders efficiently.
Role of VWAP in Algorithmic Trading
VWAP is integral to algorithmic trading strategies that automate order execution.
Algorithms use VWAP in:
VWAP Trading Strategies: Algorithms execute orders in line with VWAP to avoid moving the market.
Mean Reversion Trading: Traders look for deviations from VWAP, buying when the price is below and selling when it is above.
Liquidity-Based Order Execution: Algorithms track VWAP to execute trades more efficiently, particularly in high-frequency trading (HFT).
Why VWAP is a Critical Benchmark for Intraday Traders
For short-term traders, VWAP provides key insights into market behavior:
Trend Confirmation: If the price is above VWAP, it indicates bullish sentiment; below VWAP suggests bearish conditions.
Entry and Exit Points: Traders use VWAP as support/resistance for trade decisions.
Institutional Footprint: Retail traders track VWAP to understand where large orders might be executing.
Since VWAP resets daily, it remains a highly relevant indicator for gauging intraday momentum and trend strength.
Calculation
Where:
Price = (High + Low + Close) / 3 (Typical Price for each period)
Volume = The total number of shares/contracts traded in the period
Understanding How VWAP is Calculated:
Calculate the Typical Price (TP): TP=High+Low+Close/3
Multiply TP by Volume for each time period to get the Cumulative Price-Volume product.
Sum the Price-Volume values cumulatively throughout the day.
Divide by the cumulative volume up to that time.
Since VWAP is cumulative from the market open, it resets at the start of each trading day.
Difference Between VWAP and Moving Averages
VWAP
Volume-weighted
Resets daily
Determines fair value in a session
Reacts to volume spikes
Moving Averages (SMA/EMA)
Equal-weighted (SMA) or Exponentially weighted (EMA)
Continuous across multiple sessions
Identifies overall trend direction
Reacts to price changes
How to Interpret VWAP
When the price is above VWAP: It suggests that the market is in an uptrend, and VWAP may act as support if the price retraces.
When the price is below VWAP: It signals a downtrend, and VWAP may act as resistance if the price attempts to rise.
Reclaiming VWAP: If the price moves below VWAP but then breaks back above it, this could signal a bullish reversal. The opposite is true for a bearish scenario.
VWAP and Market Trend Identification
Uptrend: If the price remains consistently above VWAP and VWAP itself is sloping upward, the market is in an uptrend.
Downtrend: If the price stays below VWAP and VWAP is sloping downward, the market is in a downtrend.
Sideways Market: If the price oscillates around VWAP and VWAP remains flat, the market is range-bound.
VWAP Standard Deviations (Bands) and Their Significance
First Standard Deviation (VWAP ±1σ)
Represents a normal fluctuation around VWAP.
Prices bouncing within this range indicate balanced market activity.
Second Standard Deviation (VWAP ±2σ)
Suggests stronger price movement.
A move beyond this level may indicate an overbought (above VWAP) or oversold (below VWAP) condition.
Third Standard Deviation (VWAP ±3σ)
Extreme price movement; rarely sustained.
A reversion back toward VWAP is highly likely.
Misinterpreting VWAP Signals
Many traders assume that VWAP alone dictates market direction. However, simply being above or below VWAP does not automatically mean the market is bullish or bearish. Market structure, momentum, and external factors such as news events or institutional order flows must also be considered.
How to Avoid It?
Look for Confirmation: Use VWAP in combination with price action and other indicators, such as volume, market structure, and momentum oscillators (e.g., RSI or MACD).
Check the Trend of VWAP: If VWAP is sloping upward and price is above it, this signals strength. Conversely, a downward-sloping VWAP with price below it indicates weakness.
Observe Price Interaction with VWAP: If the price consistently bounces off VWAP and continues in the trend direction, it confirms its role as dynamic support or resistance. If the price frequently crosses VWAP back and forth without clear direction, it signals a choppy, range-bound market.
Strategies
VWAP Bounce
If the price pulls back to VWAP and holds, traders may look for a long entry (in an uptrend) or a short entry (in a downtrend).
Stop-loss orders are often placed slightly beyond VWAP in case of a trend reversal.
VWAP Breakout
If the price consolidates near VWAP and then breaks out strongly, traders may enter in the direction of the breakout.
A sustained break above VWAP signals strength, while a break below VWAP signals weakness.
VWAP as a Reversion Point
Traders monitor price deviations from VWAP. If the price moves too far from VWAP, a reversion trade back toward VWAP may be expected.
Key Takeaways
VWAP Represents Fair Value – It calculates the average price of a security, weighted by volume, giving traders insight into where most of the trading activity has occurred.
Intraday Benchmark – VWAP resets daily and is primarily used by intraday traders and institutions to assess whether prices are trading at a premium or discount.
Support and Resistance Tool – VWAP often acts as dynamic support in uptrends and resistance in downtrends, helping traders make entry and exit decisions.
Institutional Trading Guide – Large institutions use VWAP to execute orders efficiently, minimizing market impact and ensuring better fills.
VWAP vs. Moving Averages – Unlike moving averages, which continue across multiple sessions, VWAP is cumulative from the market open and resets each day.
Trend Confirmation – Price above a rising VWAP signals a strong uptrend, while price below a declining VWAP suggests a downtrend.
Avoid Over-Reliance – While useful, VWAP should be combined with volume analysis, price action, and other indicators to avoid false signals.
VWAP Bands for Overbought/Oversold Levels – Standard deviation bands around VWAP can help identify price extremes and potential mean reversion setups.
VWAP is more than just an average—it's the heartbeat of market sentiment, revealing where true liquidity and fair value align.
Stay sharp, stay ahead, and let’s make those moves. Until next time, happy trading!
Low Risk High Reward TradeNoticable trend reversal with incoming fresh volume. Crossed 50EMA with big greens, also surpassed crucial supply zone.

Bitcoin is making it real simple#BTC just moved out the supply/demand zone via an upward channel on declining volume to make a new all time high. Came back down to test that supply demand zone and failed that test to no surprise from me. It moved back into that zone and tested another breakout and failed that as well again to no surprise.
On top of that, the RSI failed the test of the bullzone and is now below the EMA and looks like it will fail that test as well.
The good news is CRYPTOCAP:BTC appears to have established its trade range for accumulation and will present opportunities for traders and buy and holders.
#BTC
#Wyckoff
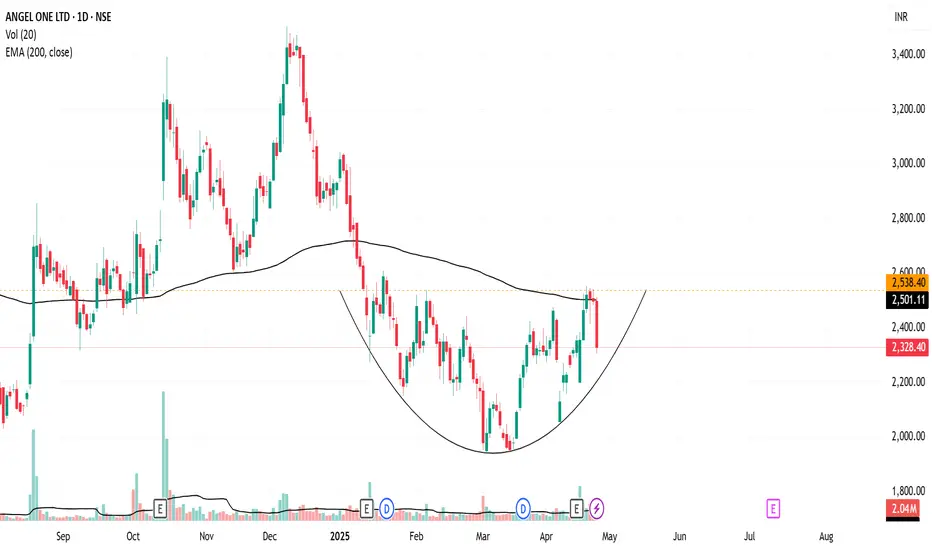
ANGEL ONE - Potential Cup Pattern Breakout!Timeframe: Daily (1D)
Pattern: Cup Formation (shown with arc)
Setup:
Price is forming a classic cup pattern.
The neckline (arc resistance) is near 2538.40.
Price has recently approached but faced resistance around the neckline.
Once the price breaks above the arc line with strong volume, a bullish breakout could be confirmed!
Targets After Breakout:
🎯 Target 1: 2800
🎯 Target 2: 3000
Stop-loss suggestion: As per your risk management.
Notes:
Price is currently below the 200 EMA. For a strong confirmation, look for a close above the arc and the 200 EMA with volume spike.
Disclaimer
This analysis is for educational and informational purposes only. It does not constitute financial advice or a recommendation to buy or sell any securities. Always do your own research and consult with a qualified financial advisor before making any investment decisions. Trading involves substantial risk.
Swing plan for 1st week June 2025. Short based Vol + PABased on Volume Profile + Price Action.
We consider for short XAU on 1st week of June 2025.
This plan for study purpose, not financial advice! Self control yours action!
Good luck mates!
#MakeCent #TradingMakeSense

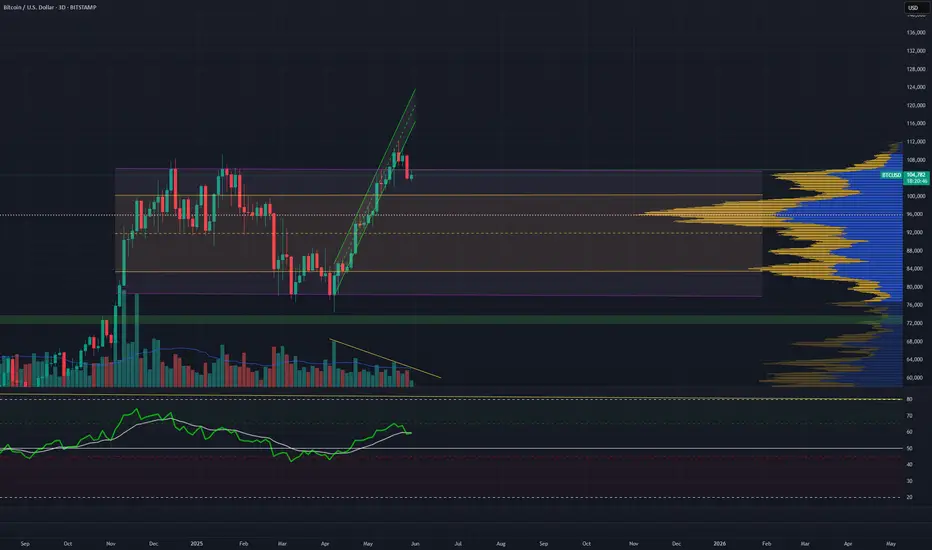
BTC targets.Last level was broken down and retested on 1H.
Now we are on last swing VAH.
If will not hold - next targets are on the way to POC magnet (green lines one the chart)
They are middles of 12H FVGs.