Spore is longI analyze the Spore currency for your loved ones. I think there is a lot of potential for growth. The first goal can be reacted to the Ardeh Block in the range of 0.005, given the many volumes that are purchased from this currency I recommend that I have some in your basket even Targets $ 1.3 And $ 14 in the long run by some analysts for this forecasted currency hope your next millionaire be yours.🤑
Comment and like plz🇮🇷
Volume

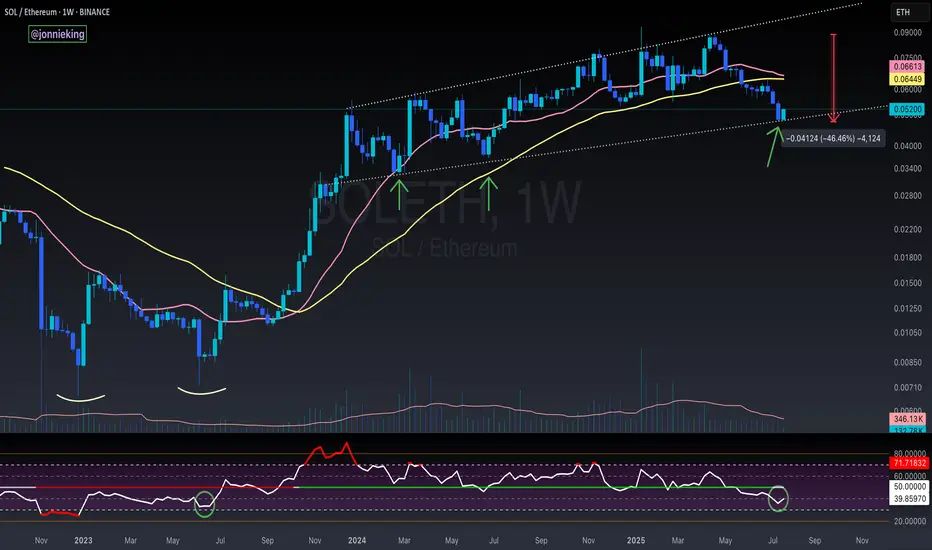
SOL / ETH - Reversal Signs FormingI suspect CRYPTOCAP:ETH has a bit more gas in the tank, but the early signs for the real Alt Season are nearing.
RSI on the weekly is nearing the June 2023 bottom which kicked off the massive bull flag formed on SOL / ETH for the next 2 years.
Still too early to call at this point tho.
Need volume to really burst through in the next week or two.
I’d also like to see BOATS:SOL close the week with a massive bullish engulfing candle.
The bearish cross on the 20 / 50WMA should mark the bottom when it occurs soon.
OPEN: textbook breakout from consolidationSpotted this on the scanner today. After ranging between 3.20 and 3.35, NASDAQ:OPEN broke out with solid volume and momentum, pushing up to a high of 3.70 for a clean intraday move of about 12 percent.
The setup included a clear Darvas box formation, a MACD crossover confirming momentum shift, and price action pushing above VWMA and key EMAs. Volume increased right as the breakout occurred, confirming buyer interest.
Support now sits around 3.47 at VWMA, and 3.35 as the top of the previous range. If price holds above 3.60, continuation into the 3.80 to 3.90 zone is on watch.
Strong breakout structure with clean technicals and follow-through. Worth keeping on the radar.

Aave proposal tolaunch centralized lending on Kraken’s Ink movesAave’s community overwhelmingly approved a proposal to license a centralized version of its lending protocol for deployment on Kraken’s Ink blockchain.
A proposal for the decentralized finance (DeFi) lending protocol Aave to launch a centralized version of its service on the crypto exchange Kraken’s Ink blockchain has received widespread approval among the community.
An Aave request for comment (ARFC) for the deployment of a whitelabel version of Aave v3 for the Ink Foundation, the organization behind the Ink blockchain, was approved with 99.8% of the votes cast in favor.
An ARFC acts as a preliminary offchain vote before proceeding with a full decentralized autonomous organization (DAO) vote. The next phase involves drafting an Aave improvement proposal (AIP) that will be voted onchain.
The ARFC states that “by granting a license to deploy a centralized version of the Aave (AAVE) codebase, Aave can expand its technology adoption while creating new revenue streams.”
Aave had not responded to a request for comment by publication time.
Kraken unveiled its Ink blockchain in late 2024, following an October announcement. The chain aims to serve as a compliant layer-2 platform for tokenized assets and institutional DeFi.
Aave eyes institutional lending market
The proposal states that the partnership could be “an opportunity for Aave to expand its influence in the institutional lending space,” creating additional revenue streams for the protocol.
The Aave DAO would receive a share “greater than or equal to the equivalent of a Reserve Factor of 5% based on borrow volume in all pools.” The Ink Foundation also committed funds to the development of the new protocol

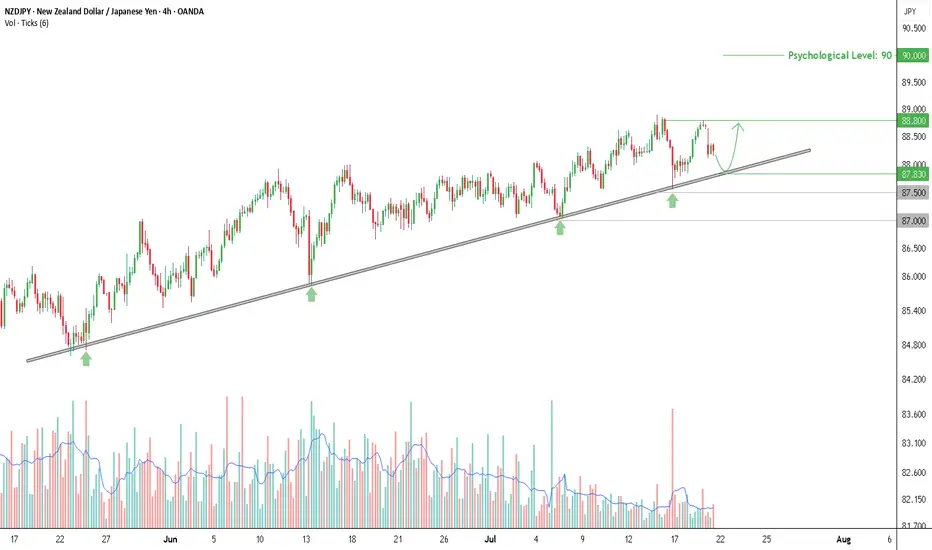
Buy Opportunity on NZDJPY, Testing Trendline with Rising VolumeThe NZDJPY chart on the 4-hour timeframe shows a consistent uptrend pattern, supported by a well-respected ascending trendline that has been tested multiple times since late May 2025. Rebounds from this trendline are marked by green arrows on the chart, indicating a strong reaction zone. Each time price touches the trendline, trading volume tends to increase—signaling active buying interest from market participants.
Currently, price is pulling back toward the trendline support area around 87.830, which could once again act as a bounce point, just like in previous sessions. As long as this trendline holds, the rebound scenario remains dominant and offers a potential opportunity for a long (buy) setup.
Entry & Take Profit
If price bounces from the trendline area, a buy entry can be considered around 87.83, with an initial take profit target at 88.80—the nearest local resistance level and previous consolidation zone.
Should the bullish momentum continue and break above 88.80, the next upside target could reach the psychological level of 90.00.
Stop Loss
As a risk boundary, a closing price below 87.50 can be used as a stop loss (SL) level, as it would indicate a potential breakdown of the higher low structure that has been forming.
If the trendline fails and price drops further, a deeper decline may extend toward the 87.00 area, which is a previously established horizontal support.
Additional Confirmation
It’s recommended to wait for bullish price action signals around the trendline area before entering a position, such as a bullish engulfing pattern, pin bar, or rejection candle. Also, monitor for a spike in volume as price approaches support, as increased volume often indicates strong buying interest.
As long as the trendline holds, the upward bounce scenario remains valid and should be considered for short- to medium-term buy strategies. The 87.83–87.90 zone is a key area to watch for the next market reaction.
Disclaimer: This analysis is part of a trading plan and does not constitute investment advice. Always use strict risk management and consider potential losses in every trade decision.
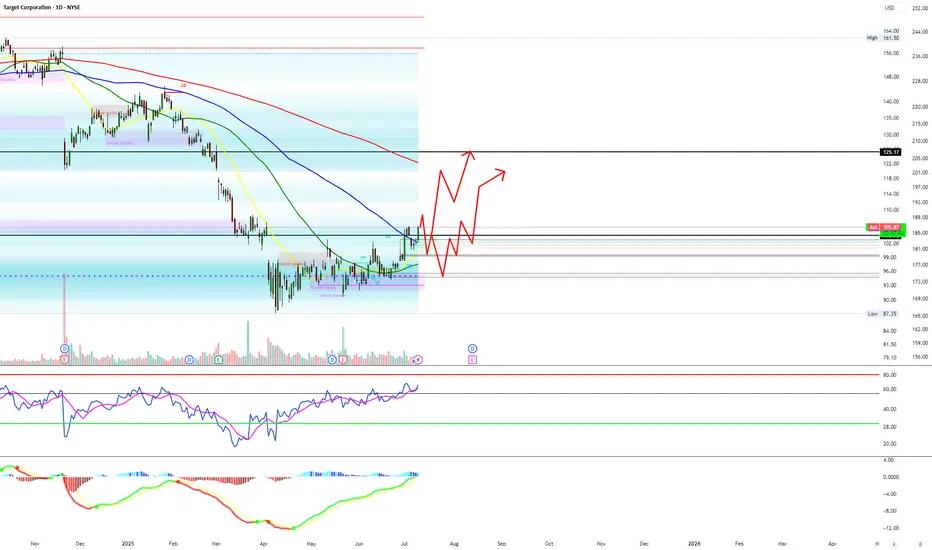
Target will hit my Targets. They are beloved by the people!Target has been re structuring there entire business after DEI was taken away.
I think they realized that going down that path is not profitable and would bankrupt them quickly if they continued.
They boosted security measures and also strengthened there online store a lot.
Target #1: $116
Target #2: $120
PENDLEBTC 1D Chart Analysis | Accumulation Breakout ConfirmedPENDLEBTC 1D Chart Analysis | Accumulation Breakout Confirmed
🔍 Technical Breakdown
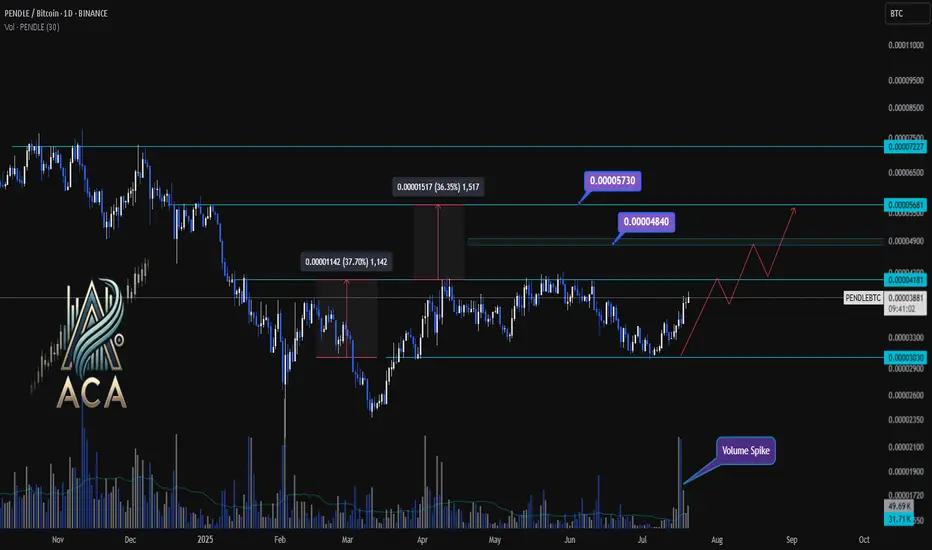
PENDLE/BTC has officially broken out above a key accumulation box, confirming strength as the daily candle closed above the 0.00004181 resistance zone. This marks a significant structural shift after months of sideways consolidation.
📈 Key Observations
Accumulation Phase: The prolonged sideways structure acted as a re-accumulation range. The recent breakout suggests strong hands absorbing supply before expansion.
Breakout Momentum: Prior rallies from this region resulted in +36% and +37% moves. Similar behavior is expected if this breakout sustains.
Target Zones:
🎯 First Target: 0.00004840 (mid-range resistance)
🎯 Extended Target: 0.00005730 (macro resistance)
📊 Volume Spike confirms genuine breakout demand. If BTC remains stable, PENDLE may repeat its historical rally patterns toward the upper resistance zones.
🚀 Conclusion
With a clean close above the range high and confirmed volume, PENDLE/BTC appears poised for further upside. Momentum traders may eye pullbacks into 0.00004180 as potential entries.
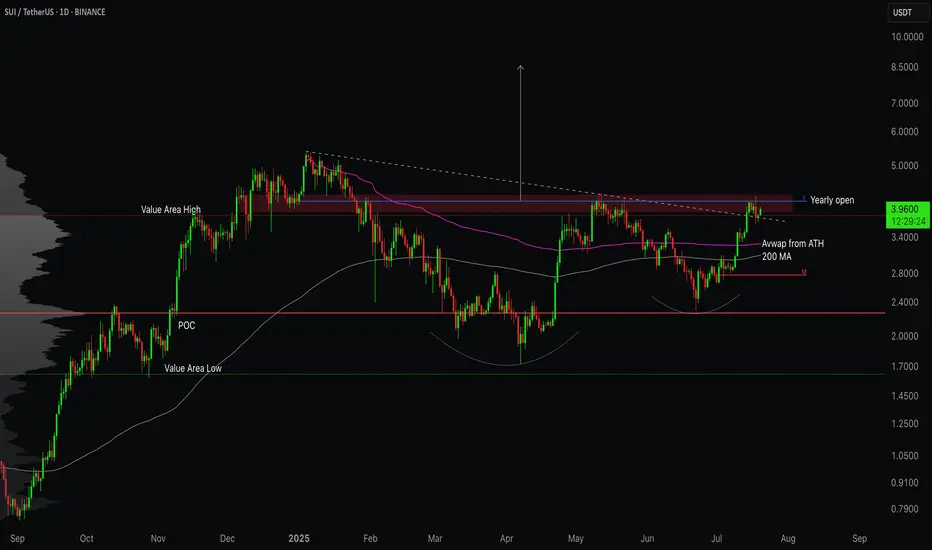
SUI/USDT - Testing the Top of ValueSUI is back in focus as price pushes into a critical zone of resistance that has capped previous rallies. With key moving averages reclaimed and volume shifting in favour of bulls, the question now is simple - can it break free, or is this another trap before rotation lower?
Let’s break down the current structure and what comes next!
SUI is trading at a critical inflection point after staging a strong recovery off the March and April lows . The broader context shows a market transitioning from a bearish phase into a more constructive accumulation structure. The recent price action has been guided largely by reclaiming key areas of previous acceptance and value.
However, sellers are still active at the upper bounds of this range. The next few sessions will determine whether SUI transitions into full breakout mode or requires further consolidation below resistance.
⦿ Volume Profile
The Value Area Low (VAL) is anchored around $1.62 . This area marked the exhaustion point for sellers, triggering the current recovery leg.
The Point of Control (POC), which represents the highest traded volume zone, sits at approximately $2.27 . This zone acted as a magnet for price through May and June and is now firmly reclaimed, reinforcing its importance as a structural support.
The Value Area High (VAH) comes in at $3.82 . Price has recently reclaimed this level, which suggests buyers have shifted control of the auction. Acceptance above the VAH often implies that the previous range is no longer valid and a new range expansion could be underway.
⦿ Key Technical Insights
Several technical levels align with this recovery. The 200-day MA and the anchored VWAP from the all-time high converge between $3.00 and $3.50. This area has been successfully reclaimed and held, adding further conviction to the bullish case.
Above current prices, $4.12 represents the Yearly Open and a clear horizontal supply level. The market has shown hesitation here, as expected. The price action suggests sellers are attempting to defend this zone, but the overall structure remains bullish as long as higher lows are maintained.
Support levels to monitor include $3.82, the Value Area High, and $3.50, where both the VWAP and the 200-day Moving Average provide dynamic support. Below that, the POC at $2.27 remains a crucial level of last defense for bulls.
⦿ Market Structure
Structurally, the market has transitioned from a downtrend into a rounded bottom formation, which typically precedes more sustained uptrends. The higher low structure since the March lows confirms this shift. The recent push above both the POC and VAH further validates the strength of this reversal.
Volume has supported this breakout. We saw clear expansion through the $3.00 handle, suggesting conviction among buyers. The visible consolidation just below $4.12 reflects natural supply pressure but not yet evidence of distribution.
⦿ Scenarios to Consider
1. Bullish Scenario:
If buyers manage to establish acceptance above $4.12, particularly with daily closes through this level, the path higher opens cleanly. The low-volume node between $4.12 and approximately $5.00 suggests limited resistance in this zone. Price could expand swiftly toward $5.36 to $6.00 as a first target.
2. Healthy Pullback Scenario:
Should price reject the $4.12 zone, a pullback toward $3.82 or even $3.50 would be healthy and expected. As long as the structure of higher lows remains intact and price holds above the reclaimed POC at $2.27, this pullback would likely serve as a base for the next leg higher.
3. Bearish Breakdown Scenario:
A sustained loss of $3.00 would be the first real warning sign for bulls. Breaking below the POC at $2.27 would suggest a failed breakout and could see the price cycle back toward the lower end of the volume profile, targeting $2.26 or even the Value Area Low at $1.62. However, given current strength, this scenario looks less likely unless broader market sentiment shifts.
I’m primarily focused on bullish scenarios or potential pullbacks, as the current market looks stronger compared to a few months ago. I believe we’re likely to see some decent long opportunities moving forward.
Let me know your thoughts in the comments! 👇
⚠️ Disclaimer
As always, this post is purely for educational purposes. I am not a financial advisor, and nothing here should be taken as financial advice. Always consult your financial advisor before making any investment or trading decisions. Or at the very least, consult your cat. 🐱
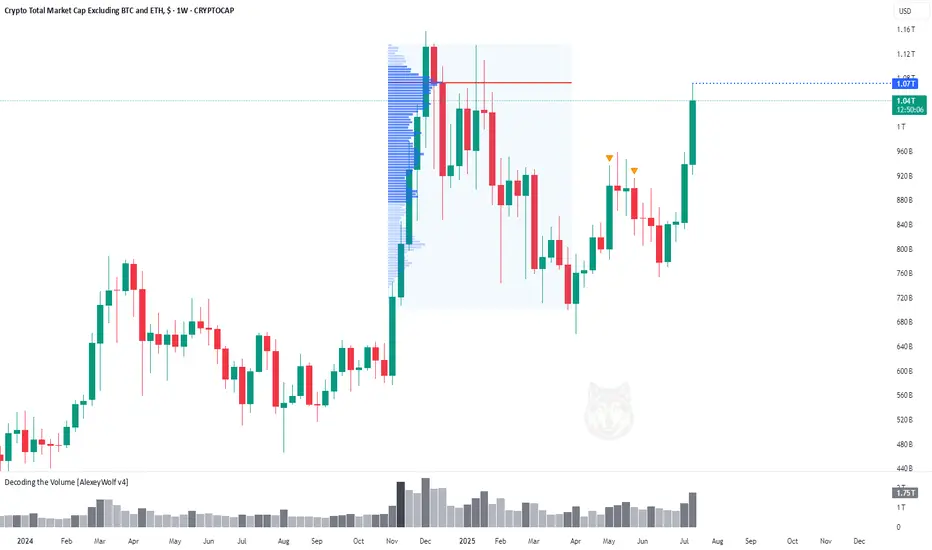
Altcoin Market Hits First Target at $1.07THi traders and investors!
The market capitalization of Total3 has reached $1.07 trillion, marking the first major target for the altcoin market.
This level corresponds to the Point of Control (POC) from the previous bullish rally and the subsequent correction — a key area of traded volume and market interest.
Several factors now suggest the potential for a continued move higher. On the fundamental side, the recent signing of a pro-crypto bill by Donald Trump has boosted overall sentiment in the digital asset space, especially among altcoins. From a technical perspective, many leading altcoins are showing bullish continuation patterns.
Wishing you profitable trades!
Gold. 3310 reaction & will Buyers reach their remaining targets?Hi traders and investors!
The 3310 level worked out perfectly. We can see a familiar buy pattern forming.
If the buyer fails to push the price higher and the seller returns to the 3310 level, it's likely that the price will continue to decline on the daily timeframe toward the next nearest targets — 3244, or more likely, 3154.
For now, however, we still expect the buyer to pursue the remaining unmet targets at 3393 and 3403.
This analysis is based on the Initiative Analysis concept (IA).
Wishing you profitable trades!

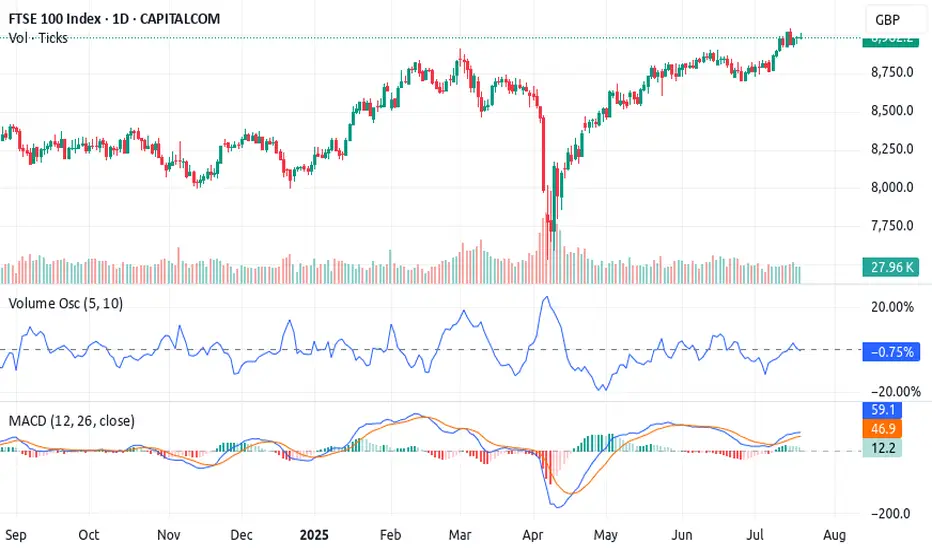
The 3-Step Rocket Booster Strategy – UK100 Bullish Breakout 🚀 The 3-Step Rocket Booster Strategy – UK100 Bullish Breakout Brewing
The UK100 Index is currently aligning perfectly with a high-probability setup I call the 3-Step Rocket Booster Strategy
— a momentum-based play designed to catch strong breakouts before the crowd reacts.
---
🔍 Strategy Breakdown:
✅ Step 1: Price above the 50 EMA
This signals short-term bullish momentum. The UK100 has cleared the 50 EMA decisively, with candles holding strong above it — suggesting buyers are stepping in aggressively.
✅ Step 2: Price above the 200 EMA
Now we’ve got long-term trend confirmation. The index is trending above the 200 EMA, meaning bulls have full control of the higher timeframe direction.
⚠️ Step 3: The Gap-Up with Volume Confirmation
Here’s the key — the "booster". We’re watching for a gap-up move , validated by a Volume Oscillator breakout . While
price has already lifted, the volume hasn’t exploded just yet — this is the final ignition phase before liftoff.
---
📈 Technical Indicators:
MACD: Bullish crossover active — momentum building
Volume Oscillator: Starting to curve upward, hinting at upcoming volume expansion
EMAs: 50 EMA > 200 EMA = confirmed bullish structure
Support Zones : Holding cleanly above recent resistance-turned-support, adding confluence
---
🟢 Trade Insight:
We are now sitting in the perfect entry zone — price is in the pocket before volume confirms . Once volume breaks out, we could see a parabolic move , especially if global market sentiment remains stable.
🎯 Potential Targets :
First target: Recent high (psychological + structural level)
Second target: Measured move based on gap range extension
Risk: A close below the 50 EMA invalidates the setup
---
🔁 Summary:
This setup ticks all three boxes of the 3-Step Rocket Booster Strategy .
The smart money is positioning before the volume shows up. The UK100 is a strong bullish candidate with low-risk entry and high reward potential — don’t ignore this one .
---
📌 Disclaimer: Always use proper risk management. Trade the setup, not the emotion.Use a simulation trading account before you trade with real money
Let me know if you’re tracking this setup too 👇
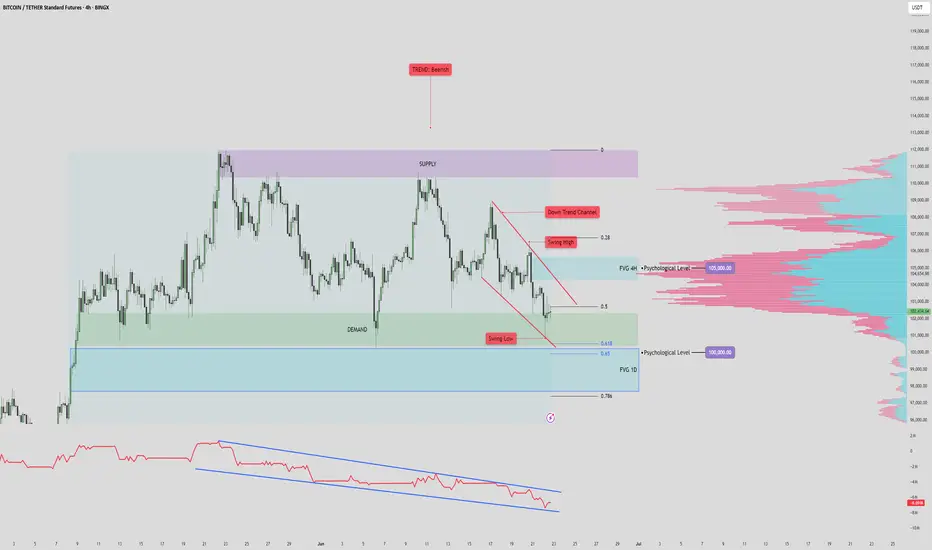
BTC/USDT – 4H Chart Technical AnalysisBTC/USDT – 4H Chart Technical Analysis
Market Structure & Trend
Overall Trend : Bearish (clearly defined by a consistent downtrend channel).
Current Structure : Price is in a corrective downtrend within a descending channel, after multiple rejections from the supply zone.
Key Technical Zones
1. Supply Zone
Strong rejection zone where the price previously reversed sharply.
Still acting as resistance, located around the upper range.
2. Demand Zone
Currently being retested for the fifth time, weakening its strength.
Recent price action shows liquidity sweep and swing low break inside this zone, potentially trapping early longs.
Fair Value Gaps (FVG) & Fibonacci Levels
1D FVG sits below the current demand, aligning with:
Golden Pocket (0.618–0.65 Fib).
Acts as a high-probability bounce zone for long entries if demand fails.
A break below this FVG could open up deeper downside toward the 0.786 Fib or beyond.
Psychological Levels
105,000 – Major resistance & potential take-profit area for long positions.
100,000 – Key support and liquidity magnet if the demand zone fails.
Volume Profile
High Volume Node: 102,000 – 106,800 — price tends to gravitate here, indicating potential consolidation or resistance.
Low Volume Area: Below 100,500 — suggests thin liquidity, which may cause sharp moves if price drops into this range.
Scenarios & Trade Ideas
Bullish Scenario
If price holds above the demand zone (after multiple retests) and confirms on LTF:
Potential Long to local resistance.
On breakout, target the 105,000 psychological level.
Confluence: High volume area offers both support and a magnet.
Bearish Scenario
If price fails to hold the demand zone:
Enter short position targeting the 1D FVG and 100,000 psychological level.
If that breaks, expect sharp continuation due to low volume below.
Conclusion
Price is at a pivotal point — currently balancing on weakened demand after multiple retests. Watch for LTF confirmation:
Above demand = bullish recovery setup.
Below demand = bearish continuation toward 100,000 and the FVG.
Manage risk tightly due to the proximity of both key zones.
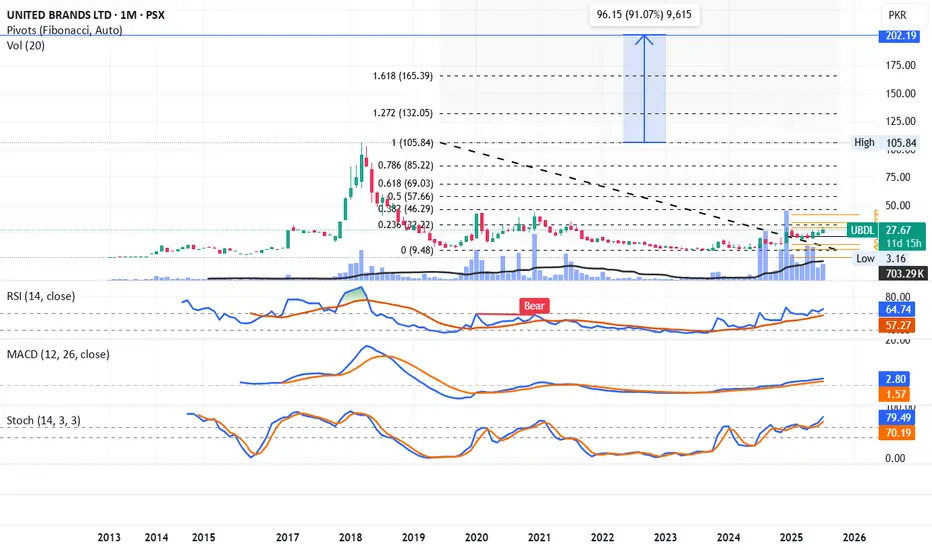
UBDL LongA nice cup and handle formation in place. UBDL is trending above monthly pivot. RSI, MACD and Stoch all are giving buy signal and increasing volumes are also indicating the same.
Its a reversal stock and may move slowly.
Further targets are 32, 46, 57, 69, 85 and then 105 (its all-time high).
Once it reaches there, 200 can be up for the grabs, but it may take 2-3 years of patient holding.
Its not a buy / sell call, just my personal opinion.
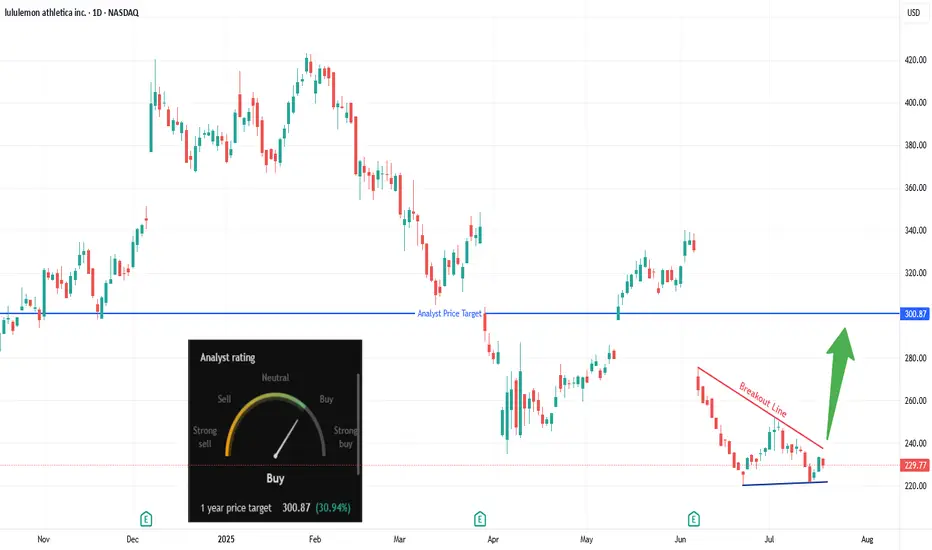
Are Bulls Quietly Loading Up on LULU?Trade Summary 📝
Setup: Descending wedge forming after sharp drop; price testing breakout line.
Entry: Above $240.
Stop‑loss: Below $220 swing low/support.
Targets: $260 , $293–$301 (analyst target).
Risk/Reward: ~3:1 (tight stop, multi-level upside).
Technical Rationale 🔍
Key Signal #1: Descending wedge/bullish reversal pattern; oversold bounce.
Key Signal #2: Bullish divergence forming on recent lows; higher low established.
Context: Daily chart; aggressive sellers losing momentum as wedge tightens.
Catalysts & Context 🚦
Recent gap down created potential “magnet” for gap fill upside.
Surge in unusual OTM call buying last week hints at speculative bullish positioning.
Analyst 1-year target: $300.87 (+30% upside); rating upgraded to Buy.
Watching for sector rotation into consumer discretionary/retail names.
Trade Management Plan 📈
Entry: Only on daily close above $240 breakout line.
Stop‑loss: Initial below $220; trail to breakeven if $260 target hits.
Scaling: Trim at $260, hold partial for $293–$301 extension.
What’s your view? Are you watching LULU? Comment below or vote:
🔼 Bullish
🔽 Bearish
🔄 Waiting for confirmation
*** Follow us now to ensure you don't miss the next big setup ***
Disclaimer ⚠️: Not financial advice. Trade at your own risk.
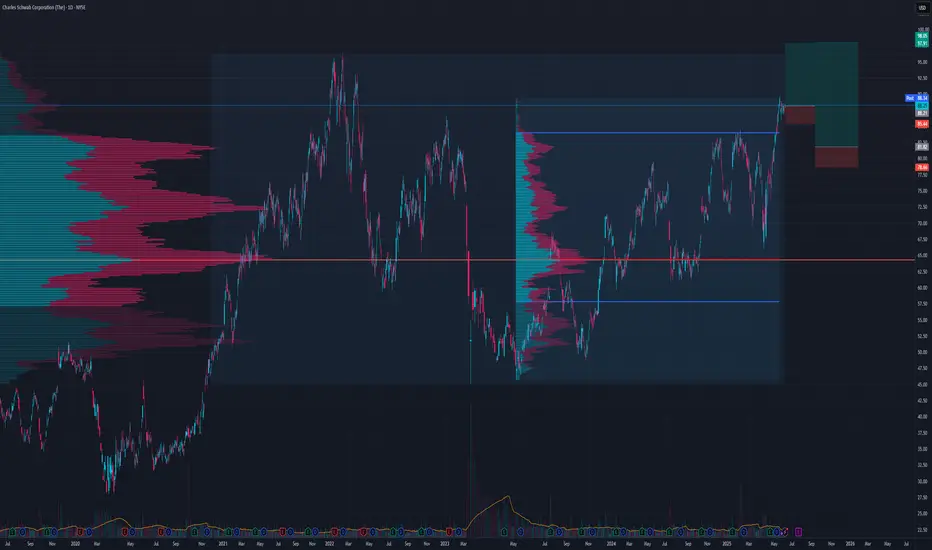
Charls Schwab Long TradeSeems good here, goal is to go for ATH otherwise risk to reward is not worth.
Looks promising but pullback to VAH is possible
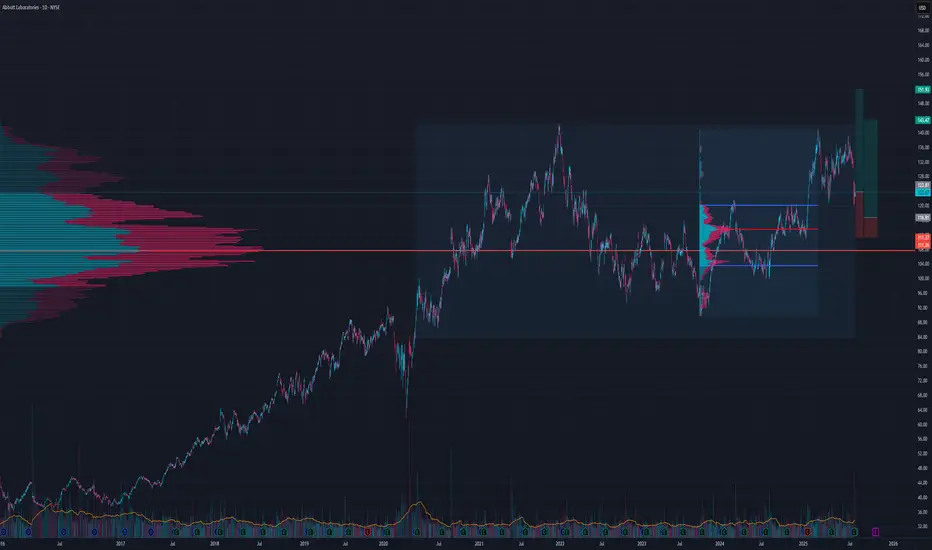
ABT Long TradeVAH retest long here or another pullback close to POC
Good Risk to reward on a solid company
"These 3 power signals boost the 3-step rocket booster strategy"Am lubosi forex and i would like to welcome you.This is where i share with you technical analysis strategies.
I started trading in 2017 and learning about it has not been easy.My hope for you is that this channel will shape your trading journey and help you
Find a path to making money on your own terms.
In this video am showing you the rocket booster strategy
using 3 indicators and catalysts as follows:
1-Volume Oscillator
2-MACD Indicator
3-Earnings Report Catalyst
These 3 power signals boost
the 3-step rocket booster strategy
Watch this video
to learn more
Disclaimer:Trading is risky please use a simulation trading account before you trade with real money
also learn risk management and profit taking strategies.

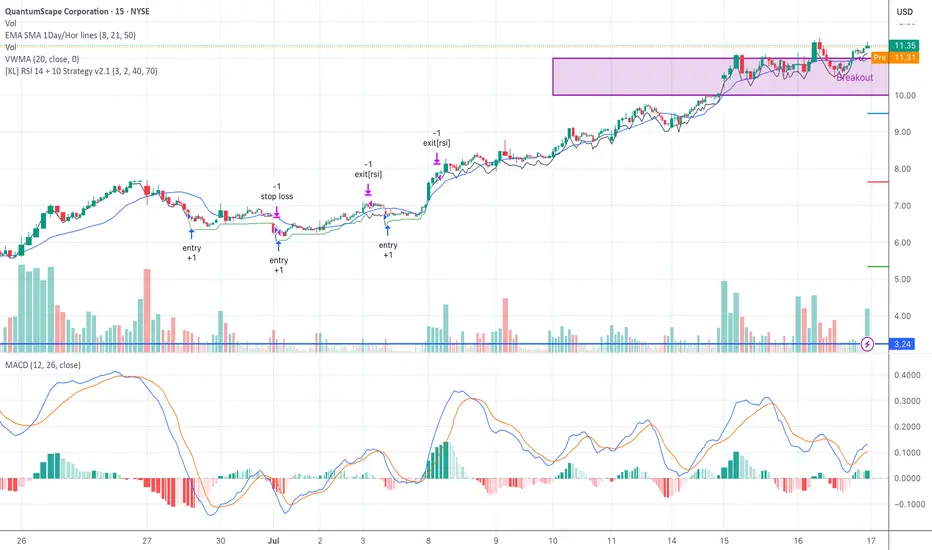
QS Breakout Setting Up — Entries Triggered, Waiting for ConfirmSeed System entries are printing on QS with trailing profit zones holding firm.
MACD crossovers confirming the move. Watching RSI cooling just under breakout resistance at $11.35.
A push through $11.50 with volume and I’m adding — slowly.
Support at $10.03, cut fast if price shows weakness.
Let the market do the heavy lifting.
#QS #SeedSystem #SwingTrading #TrendFollowing #LivermoreStyle #BreakoutWatch
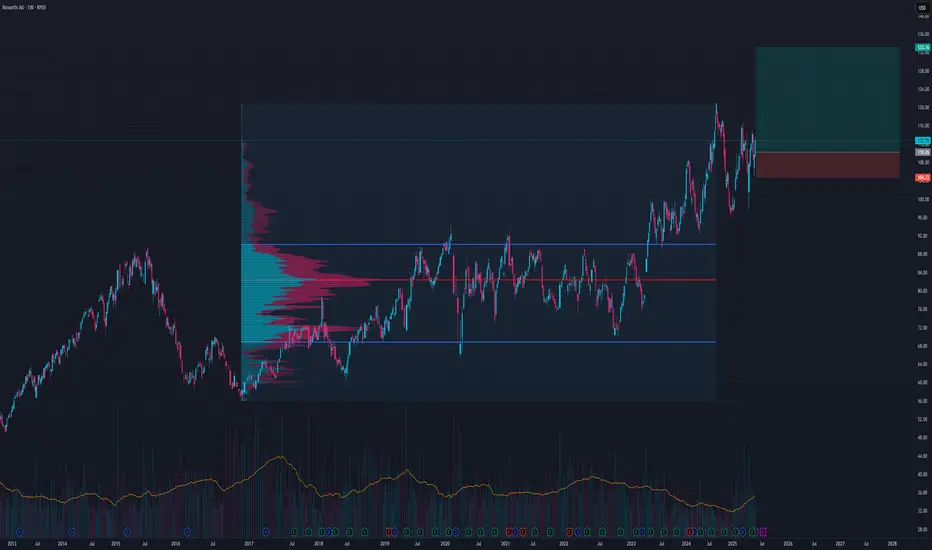
NVS Bullish Continuation LongThis looks super bullish
If we get a flat to lower open tomorrow, would be a good market entry
Best entry price around 110-108
TP1 133
TP2 154
This is a longer term play I would not expect this to play out in a couple weeks
ATAI bulls look primed for another leg upATAI gave us the highest close we've seen in nearly 3 years today as bulls closed at high of the day approaching resistances from the gap up on July 1st. Today saw 2x the volume traded yesterday which is a great sign when looking for daily continuation.
Anticipate resistance at 2.81. 3.00, 3.01, and weekly 200 SMA
Red flag from here would be to fail at 3.00 and reverse to break below 2.53.

The Crypto Market Shaken by USDe Collapse – What’s Next for BtcIn early July 2025, the crypto market was rocked by the sudden destabilization of one of the fastest-growing stablecoins — USDe by Ethena. In just a few days, the token lost over 10% of its value, dropping to $0.88. This triggered a wave of liquidations across DeFi protocols and a sharp decline in major crypto assets like Bitcoin and Ethereum.
Why USDe Collapsed
The main cause of the collapse was a weak collateral model. Unlike USDT and USDC, USDe lacked full fiat backing. Its reserves were partially based on derivatives and complex hedging strategies. When a few large wallets began withdrawing liquidity, panic spread quickly. The rush to exit USDe overwhelmed the system, breaking the $1 peg.
This led to an accelerated loss of trust and triggered cascading liquidations across multiple DeFi platforms.
Impact on DeFi and the Broader Market
DeFi was hit hard. The total value locked (TVL) across major protocols like Aave, Curve, and MakerDAO dropped by 17% in one week. Some platforms halted USDe-related activity to contain losses.
Bitcoin fell below $58,000, and Ethereum dropped under $3,000, driven not only by lower liquidity but also by renewed skepticism from institutional investors. The volatility in what was perceived as a “safe” asset reignited debates around the future of algorithmic stablecoins.
What Happens Next?
The fallout from USDe is a major stress test for the entire DeFi ecosystem. If the team behind Ethena fails to restore trust, other algorithmic stablecoins could come under pressure. There are already growing calls for greater transparency, independent audits, and stricter collateralization rules.
On the flip side, many see this as a healthy correction — a purge of undercollateralized, risky experiments. The long-term winners could be robust, transparent protocols, and Bitcoin, with its capped supply and increasing institutional demand, may once again be seen as a flight-to-safety asset.
Gold. Where to look for buy setupsHi traders and investors!
The price is currently in a sideways range, with the boundaries marked by black lines.
Sellers defended the buyer's first attempt to break through the 3366 level — the key volume in the candle that touched this level was accumulated exactly at that point.
Now, it would be ideal to symmetrically expand the range downward by 11.230 points, which would bring the price right to the 3310 level.
From the 3310 level, it makes sense to look for potential buy patterns.
This analysis is based on the Initiative Analysis concept (IA).
Wishing you profitable trades!
