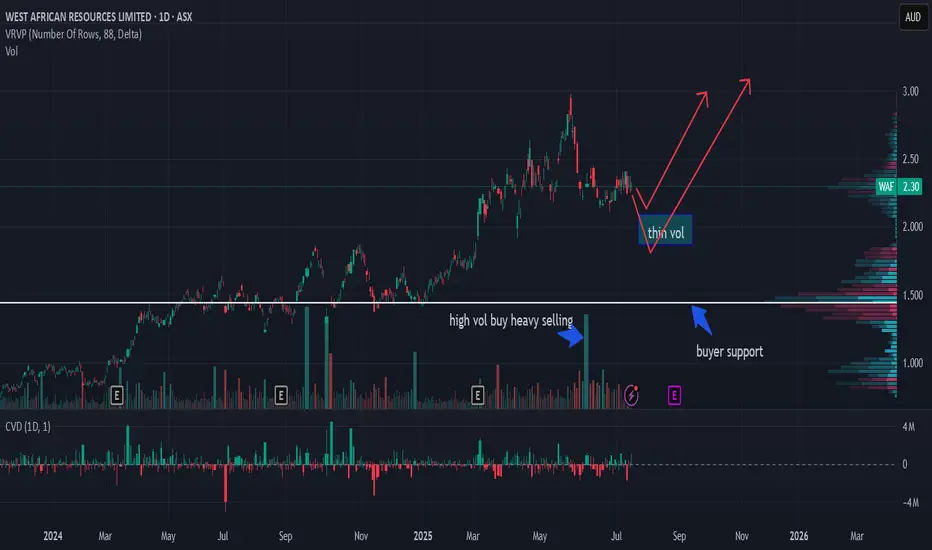
Rising into big selling volumeIf it holds .60 seems bullish due to selling be absorbed, otherwise looking for it to dip to high volume node at .40 and rise on fundamentals.
Volume

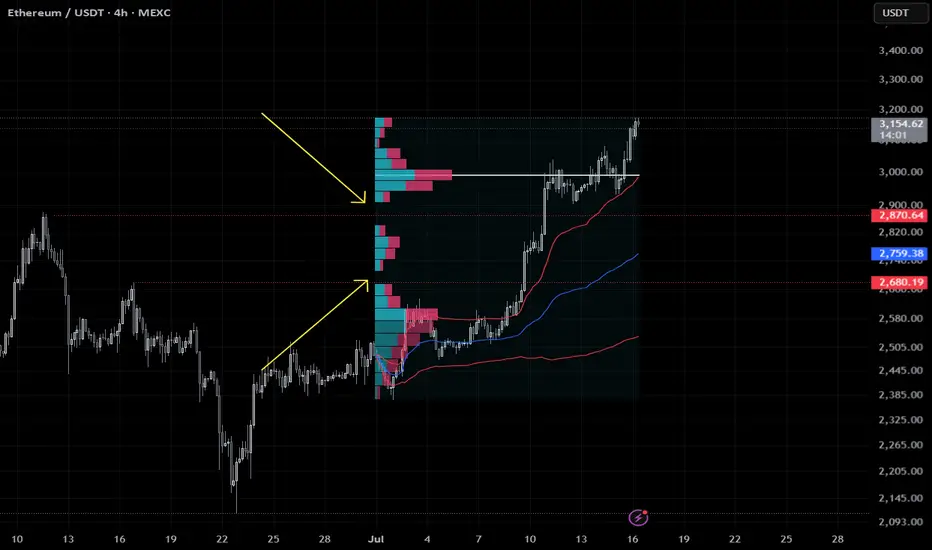
ETH Flash Crash Setup – Gaps Below to WatchEthereum broke out fast, too fast. In the process, it left two clear value gaps around $2850 and $2690 — areas where price barely traded. These usually get revisited.
I’m watching those zones for a potential flash crash setup. If we get a sharp wick down, that’s where I want to be a buyer. No chasing.
Limit orders layered in. Plan is simple:
$2850 — first tap
$2690 — full imbalance fill
Stops below $2600 if triggered
Not saying it has to happen, but if it does, I want to be ready. Mark your levels.
—
Trade safe. This is just my setup, not advice.
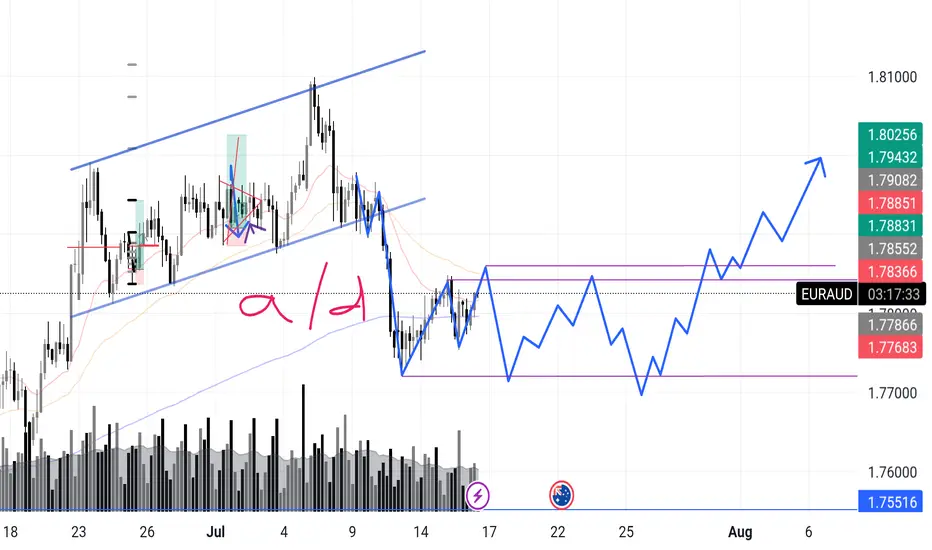
EURAUD – Incoming Upthrust? Accumulation or Distribution? Chart Context:
EURAUD recently completed a sharp markdown after a textbook rising channel break. What’s interesting now is that price has entered what looks like a potential box range between 1.7768 and 1.7885.
I'm anticipating a possible upthrust move into the 1.788x zone — and what follows will reveal the true intent.
Here’s the internal debate:
Are we looking at reaccumulation — smart money trapping shorts before driving higher in line with broader money flow?
Or is this a distribution — where the market builds a false sense of support before deeper downside?
🔍 What tips the scale for now is this:
>The overall money flow direction (via volume patterns + structure) has leaned bullish, so I’m favoring accumulation with a shakeout scenario.
Signs I’m watching:
✅ Absorption volume near the bottom of the range
✅ Higher lows inside the zone
✅ Fake breakout / upthrust into prior structure
❌ Failure to hold above 1.7855 could flip the bias short-term
📉 Expecting one more dip to test demand, followed by range tightening, and if buyers show up strong — the breakout can get explosive.
What’s your take?
Are we prepping for a markup or will this fakeout and roll over?
"I go long or short as close as I can to the danger point, and if the danger becomes real, I close out and take a small loss"
Trends Report#1:Learn How To See Bullish Chart Patterns It's been a wild week.As I am strategy building.
So far I have about 3 solid trading strategies.
Then I have two more pending to learn more.
My dream as a man has always been to learn how to make money.
Staying in the financial markets because I went to college to study information and technology.
In my academic studies there was nothing close to what I learned on trading.
Financial technology software development is what I have decided to study as an academic pursue.
The education system is broken.
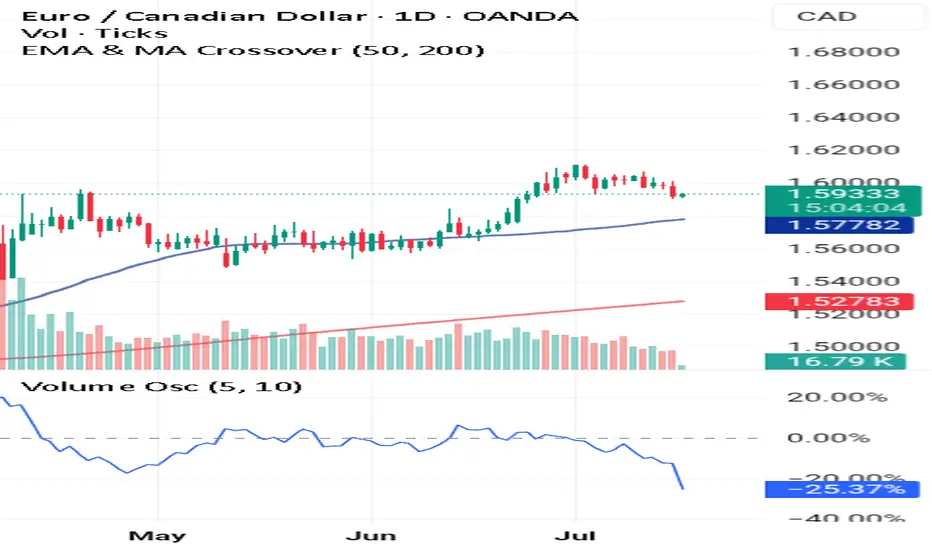
Look at this chart.
☝️The price is above the 50 EMA
☝️The price is above the 200 EMA
☝️The price has reversed on a Bullish Harami Candlestick pattern .
This reversal is confirmed by both the positive volume + volume oscillating tool.
To learn more 🚀 Boost This Content
Disclaimer ⚠️ Trading is risky please learn Risk Management And Profit Taking Strategies.Also feel free to use a simulation trading account before you use real money.
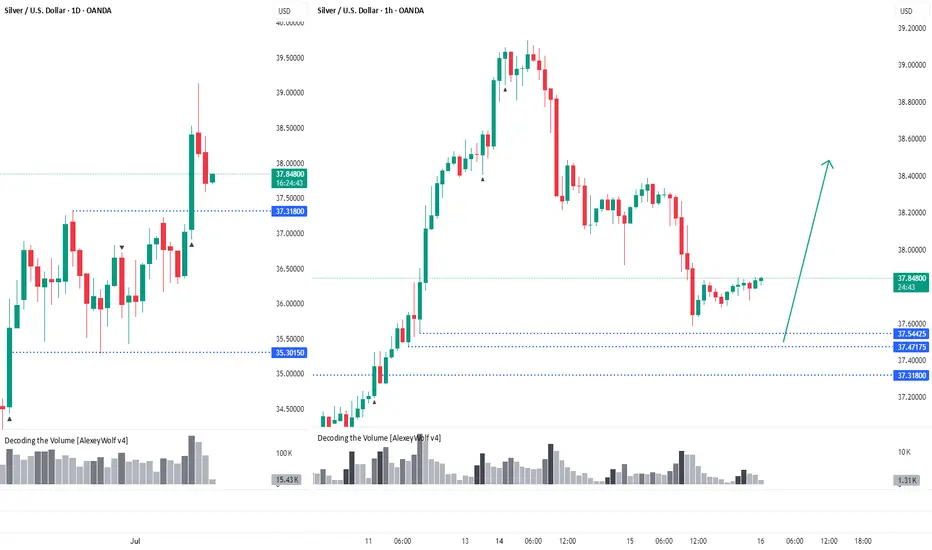
Silver. The price has pulled backHi traders and investors!
On the daily timeframe, the price has broken out of the sideways range through the upper boundary at 37.31.
The price has pulled back close to levels where potential buy patterns could form — 37.54, 37.47, and 37.31.
This analysis is based on the Initiative Analysis concept (IA).
Wishing you profitable trades!
PVSRA Bitcoin AnalysisMay 08 2025 a bullish candle's parallel volume bar broke the threshold in the below pane; indicating price instability, or unfilled orders if you will. June 22 price returns to that full candle body and dips $500 below it, to feel the opposing force and realize orders have been filled and we are in equilibrium. This set up is usually set up and finished in 1-2 weeks (volume absorption) so this 1.5 month setup was an outlier and a grind that paid off BIG patience and knowing your plan of attack is everything in this game, you have to have a plan for every single variable and NEVER stray.
Present day, a 30 minute candle has broken our volume threshold, and weve moved aggressively away from that magnetic force inevitably pulling price back towards it EVENTUALLY as it did june 22nd. Due to the commonality and the recentness of the move that just happened of 5/8-6/22, we can suspect price pattern will repeat and price will be bid up, from 115-120k, where we will then reverse to 103. The bar pattern from the 5'8 6'22 move was copied, pasted, and retrofitted to current time.
Regardless of the exact pattern of the move we expect price eventually to resolve those orders at the 103 mark and our moves are based in that zone. This seems like a range out as we capitulate these 6 figures whilst remaining in a bull market.

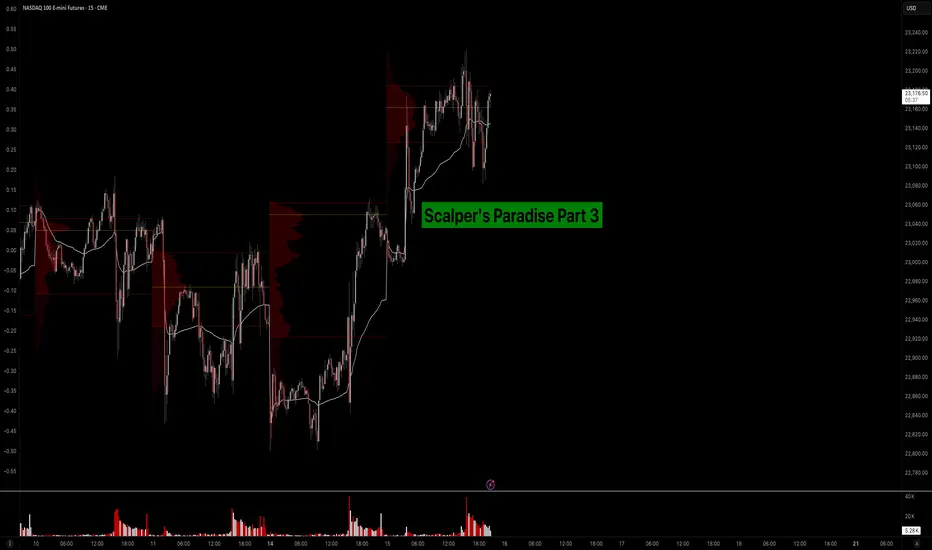
Scalper’s Paradise Part 3 – The Power of Order Flow and DOMWelcome back to Scalper’s Paradise! In this third part of the series, I want to take you into one of the most powerful tools in professional trading: Order Flow and the Depth of Market (DOM).
I chose this topic because during my time as an institutional trader, this was our entire world. We didn’t use indicators. We didn’t guess. We traded exclusively based on what we could see happening live in the DOM and Time & Sales. Every decision was made tick by tick, based on real market activity.
That experience shaped the way I view markets forever—and today, I want to share that perspective with you.
What Is Order Flow, Really?
To me, Order Flow is the most honest information the market can give you. It doesn’t predict, it reveals. It shows who is actually making moves right now. When I was sitting at my institutional desk, I didn’t look at moving averages or oscillators. I looked at who was being aggressive: were market buyers lifting offers, or were sellers smashing the bid?
Watching the tape (Time & Sales) and the footprint chart was like watching a fight unfold in real time. No filters, no guesses. Just raw interaction between buyers and sellers. That’s where real decisions are made.
The DOM: My Daily Reality as a Trader
The DOM (Depth of Market) was the first thing I looked at every morning, and the last thing I closed at night. It shows all visible limit orders resting at each price level. But there’s a catch: not everything you see is real.
In the institution, we were trained to spot real interest versus manipulation. Stacked bids might look strong, but if they disappear the moment price drops tells you that there was never a true intent. Iceberg orders were more interesting, when price gets hit again and again and doesn’t move, that usually meant someone was absorbing quietly.
Reading the DOM is like reading an X-ray of the market’s intentions. And yes, there’s a lot of noise, a lot of deception. But once you learn to read through it, it’s the most powerful tool you’ll ever have.
How We Used Order Flow on the Institutional Side
At the institution, we never chased price. That was rule number one. We let the market come to us (meaning: we used Limit Orders as often as possible) and we used Order Flow to guide every decision.
One of the most important concepts was absorption . If we needed to build a large long position, we didn’t just slam the ask. We would let sellers come in and hit our bids again and again and again. If price didn’t break lower, that told us we were in control.
On the flip side, when we needed to move the market , we switched gears. We used market orders aggressively to push through key levels, forcing reactions, triggering stops, and creating follow-through.
And yes, there were times when we intentionally created traps . We’d push price into obvious zones, make it look like a breakout, then fade it, because we knew how the market reacts afterwards. Order Flow was the only way to read those games in real time.
How You Can Use This as a Retail Trader
I know what you might be thinking: “I’m just a retail trader, how can I possibly use tools like Order Flow or DOM the way institutions do?”
The good news is: you don’t have to compete with institutions, you just need to read their intentions.
Here’s how I would approach it today:
1) Open a footprint chart and look for imbalances, areas where one side is clearly more aggressive. Watch for absorption or sudden volume spikes.
2) Watch the Time & Sales feed. Is there a flurry of trades hitting the ask, but price isn’t moving? That’s someone selling into strength.
3) Use the DOM around key areas like VWAP, previous day high/low, or liquidity clusters. Are orders getting pulled? Is size appearing suddenly? These are all signals.
You don’t need to be early. Let the big player act first, then confirm what you’re seeing across Order Flow and DOM. When everything aligns, that’s your edge.
Bringing It All Together
In Part 1, I shared how we used VWAP and Volume Profile as benchmarks to evaluate execution quality. In Part 2, I showed you how I identify institutional activity using raw volume and 10-second charts. And now, in Part 3, you’ve seen the real-time decision-making tools: Order Flow and DOM.
These aren’t indicators. They’re not theories. They’re the actual battlefield where institutions operate and where I learned to trade.
My goal with this series has always been simple: to give you access to the same mindset I used at the institutional level, but through a lens that makes sense for your reality as a retail trader.
Don’t try to outsmart the market. Observe it. Align with the big players. Let their behavior guide your decisions.
That’s how I learned to trade professionally—and it’s exactly how you can start thinking and acting like a pro, even without the size.
Part 1:
Part 2:
VOLUME PROFILE educationThere is a difference between the current wave and the previous wave, and the direction of the wave is also apparent.

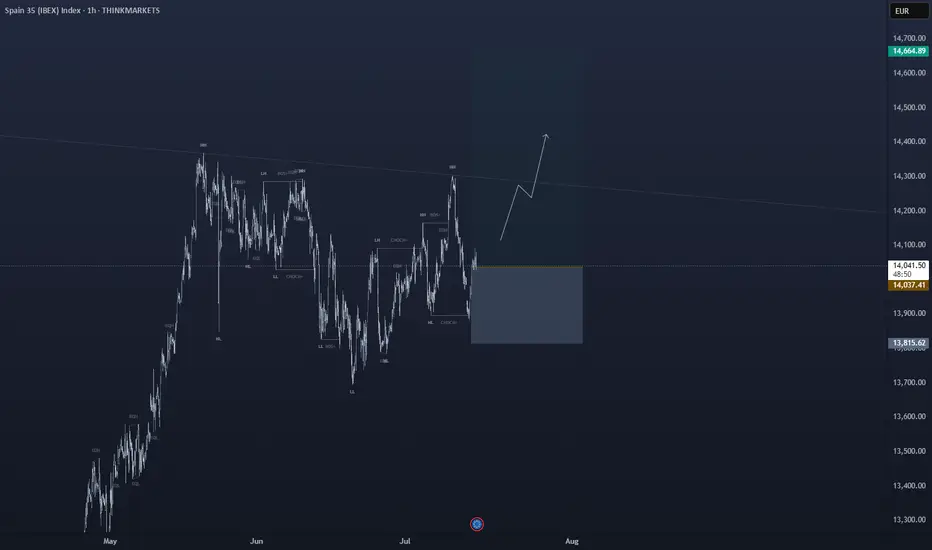
bullish on IBEX35Trading Idea Setup:
IBEX35 has given me enough confirmation indicators to forecast a bullish run from this price point. ↗️🟢
✅Favorable TP level(s):
⦁ 14269.64
⦁ 14357.51
🛑Stop Loss:
⦁ 13834.00
Indications used:
Trend confirmation indicator
Elliot wave assistance
Momentum indicators
______________________________
Trading Involves Risk: Decisions to buy, sell, hold, or trade in securities, commodities, and other investments carry inherent risk, including the possibility of substantial losses. Please ensure every trade placed is supported by your own thorough analysis and/or fundamental research.
Ps: All the trades that I place, I do hold indefinitely unless noted otherwise but TP points will always be provided. Happy Trading 🖤
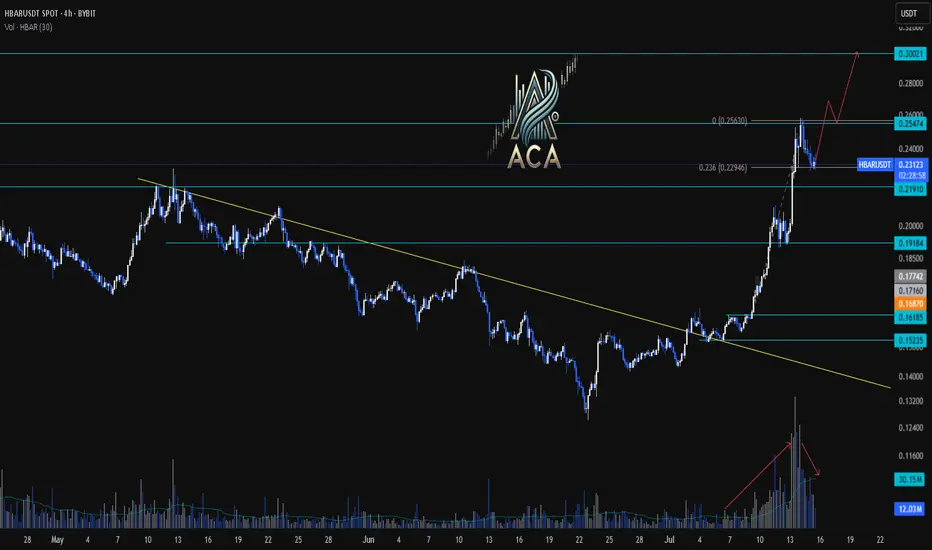
HBARUSDT 4H Chart Analysis |Volume & Fibonacci Reaction in FocusHBARUSDT 4H Chart Analysis | Volume & Fibonacci Reaction in Focus
🔍 Let’s break down the latest HBAR/USDT setup, highlighting a clear technical reaction and a new opportunity on the horizon.
⏳ 4-Hour Overview
HBAR has completed a strong impulsive leg after breaking above the RR2 of the key reversal trendline, supported by notable volume confirmation. This impressive surge was then followed by a corrective leg—a healthy sign for bulls, especially for those who missed the initial breakout.
📉 Corrective Phase & Fibonacci Support
- The current corrective leg is characterized by decreasing volume, suggesting profit-taking rather than heavy selling pressure.
- Notably, price has reacted firmly at the 0.236 Fibonacci retracement level, aligning with classic pullback zones for continuation setups.
- This volume pattern shows traders are waiting for the next major move rather than exiting positions.
🔺 Bullish Continuation Setup
- A strong candle close above the $0.255 level on either the 1H or 4H timeframe will serve as a clear bullish confirmation.
- Such a breakout may pave the way for another impulsive leg upward, with the first upside target identified near $0.30—roughly 19% higher from the recent candle close.
📊 Key Highlights:
- The prior trend reversal was validated by surge in volume and momentum.
- Volume decline during the correction favors further upside rather than distribution.
- Price is respecting key Fibonacci levels, hinting at trend continuity.
- A confirmed close above $0.255 unlocks the next target at $0.30, marking a potential 19% move.
🚨 Conclusion:
HBAR is showing textbook trend continuation signals. For those sidelined after the initial move, the current consolidation offers a safer re-entry point, with actionable confirmation above $0.255. Stay alert for a strong candle close and keep the $0.30 target in view as bullish momentum builds.

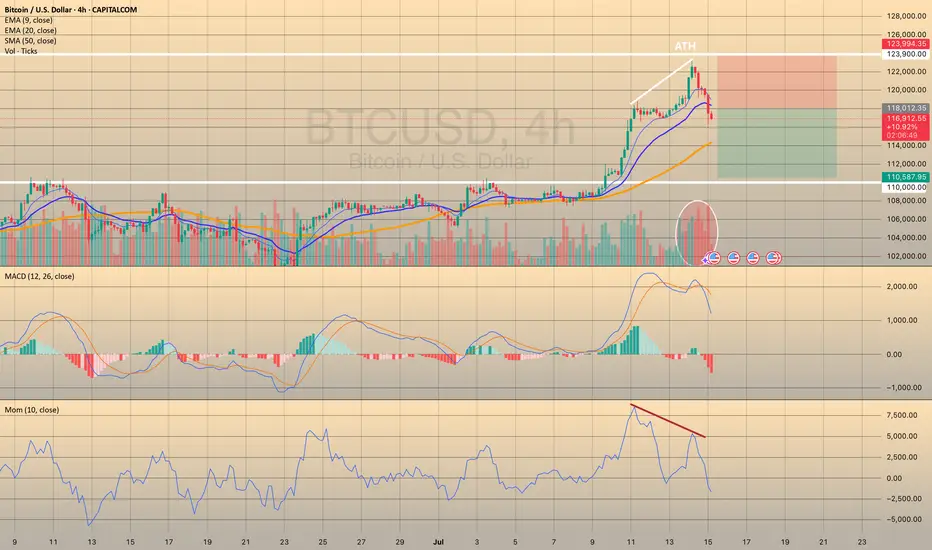
BTCUSD - REBOUND FROM ATHYesterday BTCUSD has reached new price level slightly above 123,000.00 and started to decline afterwards on big selling volume. Also we see some divergence on momentum oscillator and MACD has crossed into a red zone. I still think that bitcoin is overbought and needs the correction before next growth, so I decided to go short with
🔽 a market sell order at 117461.25 with
❌a stop loss at 123894.15 and
🤑a take profit at 110587.70
A stop loss is above the ATH, take profit just above the support level of 110,000.00. It is a counter-trend trade, so it's a bit more risky than usual.
Trade cautiously! Preserve your deposits!
BTCUSDT. Current scenario range Current scenario range — can shift depending on how the market reacts next.
This analysis is based on the Initiative Analysis concept (IA).
Wishing you profitable trades!

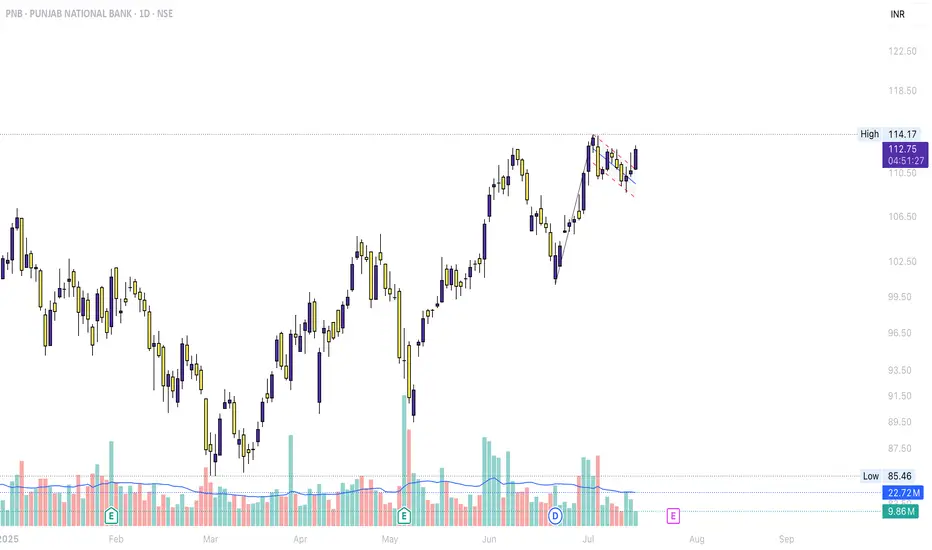
PNB <>BreakoutWith PSU Banks already on fire, PNB also showing breakout after forming Flag n Pole
Keeping it ion radar
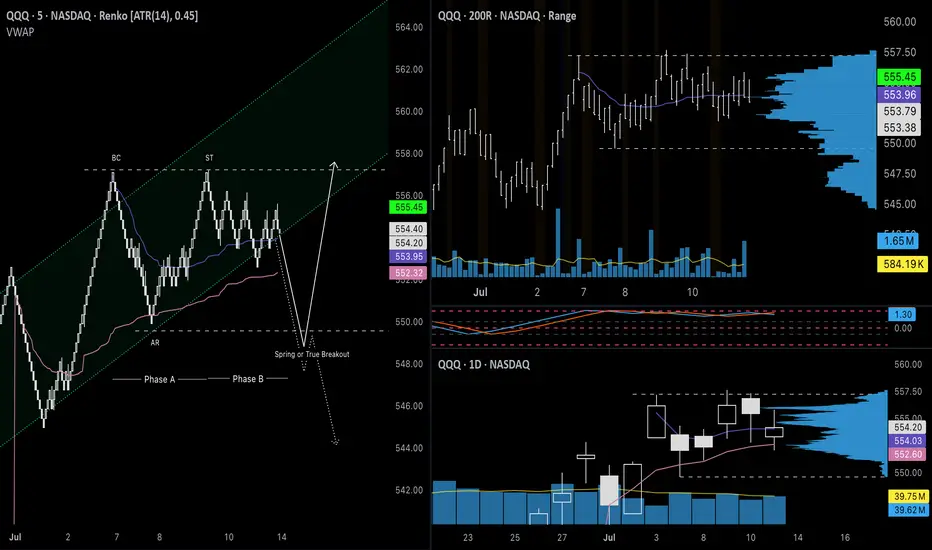
QQQ July 14th 2025I failed to update my trade journal at the end of last week and am going to try to be better about it this week. I am going to try to keep these posts more brief so I can remain consistent and meet my goal of creating an accurate timeline of my trades. For this week, I am going in with a bullish bias, which is better supported on the PA for NASDAQ:QQQ instead of AMEX:SPY , so I will be trading it instead.
The price is currently down 0.60% overnight, which would take the price near the bottom of the range ($550), which is outside of the channel. In this flat structure, we will either see the price break up after a liquidity test (spring) or break down in a true bearish reversal.
+++++++++++++++++++++++++++
Neutral Analysis
Renko: As my main chart, Renko clearly shows both scenarios, illustrated by the solid white (bullish) line and the dotted (bearish) line. For the bullish idea, the price will find a significant number of buyers after a false breakout to the downside. I switched from Traditional box sizes to ATR (14) filtered, and as you can see, the automatic rally (AR) after the peak did not have a significant retracement. We did not see a retest of the upper part of the range that could be considered a secondary test (ST) until some time later and when it did, the price rose back to the peak, indicating that buyers still had strength. From there, the price has been chopping around in Phase B without making much progress to the downside, which it will most likely reach on Monday in the form of a gap down. Additionally, the rising channel that led to this pullback is also a strong pattern, so this pullback should be treated as possible re-accumulation. If the price fails to reenter the channel or reach the top after a breakout below the range, it will likely sell off from there.
200R Chart: The range chart also supports that the secondary test was the retest of the top of the channel, a potential sign of strength. The price is still way above the 200MA, so the uptrend appears strong. One important area to watch is the volume gap from $548-$549 on the volume profile. If bulls cannot defend the gap, that could be a potential sign of weakness.
500R Chart: I am including this chart because it does provide a reason to be cautious of a pullback, or even a reversal. The price is at the top of the channel that began on April 9th. The last time the price tested the upper boundary, it formed a temporary top and pulled back, which we could see play out again here. The volume candles also show significantly higher interest since May 13th. This could either be due to increased interest from buyers or the distribution of shares, requiring more effort to move the price higher.
Daily Chart: Here is another chart that suggests that the first movement that could be considered a secondary test was the retest of the top of the range. The price has been bouncing off monthly VWAP and Fisher Transform remains flat in the upper zone. We have not seen a bearish candle with intent on the daily chart. These have all been flat doji candles.
Options: For this section, I can’t provide a good analysis of on-the-money options since the price is likely to gap down. I’m including 7/15 $550p since the price will likely open around that level and will need to move below the strike to see the premium rise significantly. The price of this contract was in a larger descending channel and will need a strong break above the top ($2.15) in order to signal further downside for $QQQ. According to my options calculator, this would require the underlying price to drop below $551 for an extended period.
+++++++++++++++++++++++++++
Targets
Calls: Open at $549; Close at $557; Stop below $548
Puts: Open $550-$552; Close at $544.50; Stop above $555
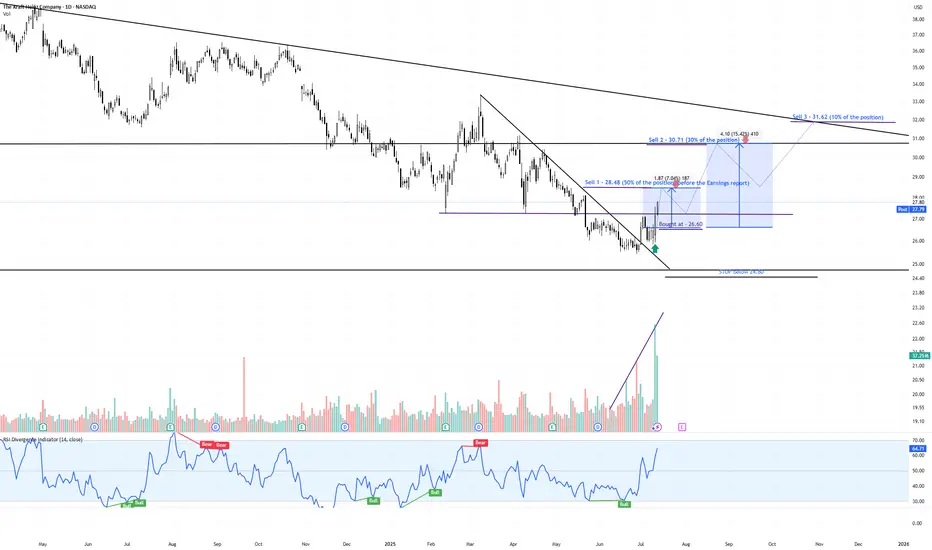
KHC – Momentum Reversal with Volume Surge & Tactical Exit Plan📈 Ticker: NASDAQ:KHC (The Kraft Heinz Company – NASDAQ)
📆 Timeframe: 1D (Daily)
💵 Current Price: $27.80
📊 Pattern: Falling Wedge Breakout + Volume & RSI Divergence
📌 Trade Setup:
✅ Our Entry: $26.60
⛔ Stop-Loss: Below $24.80
🔰 Confirmation Signals:
Bullish volume divergence: Selling pressure diminished while price made lower lows
Explosive green volume bar on breakout — strongest in 12+ months
RSI breakout above 60, confirming strong momentum and trend shift
💰 Profit-Taking Strategy:
📍Sell Zone Price Level % of Position Rationale
🥇 Sell 1 $28.48 50% Pre-earnings resistance – lock early profit
🥈 Sell 2 $30.71 30% Next strong resistance area
🥉 Sell 3 $31.62 10% Long-term descending trendline — potential reversal point
🔄 Remaining 10%: Optional trail with stop-loss raised, if momentum continues
📊 Technical Confidence & Probabilities:
🧠 Pattern: Falling Wedge
Bulkowski probability of breakout upward: ~68%
Average gain post-breakout: ~38%, though current targets are more conservative (15–19%)
📈 Volume breakout + prior divergence = strong institutional signal
📉 Risk clearly defined with stop at $24.80
📈 Target Gains vs Entry ($26.60):
🎯 Target Price Gain from Entry
Target 1 $28.48 +7.06%
Target 2 $30.71 +15.47%
Target 3 $31.62 +18.89%
🧾 Summary:
This is a high-probability breakout play, combining:
✅ Bulkowski-validated falling wedge
✅ Volume-based confirmation
✅ Clear stop and tiered exit strategy
✅ Strong risk/reward profile
“Our Entry Price: $26.60 – Breakout Backed by Big Money”
#KHC #TargetTraders #VolumeSpike #BreakoutTrade #TechnicalAnalysis #Bulkowski #StockMarket #Investing
heavy buyers buy sold offlooking for buying support at $1.5 or higher and continuation through sellers at 1.75
JSWINFRA - Daily time frame StudyFollowing are my Inputs for above chart reading -
1. MACD cross over
2. High volume Breakout of Symmetrical Triangle Pattern - Daily Time frame
3. It may go till weekly resistance line 330-340
This chart is only for educational purpose, Please contact your financial advisor for any trading or investment decisions.

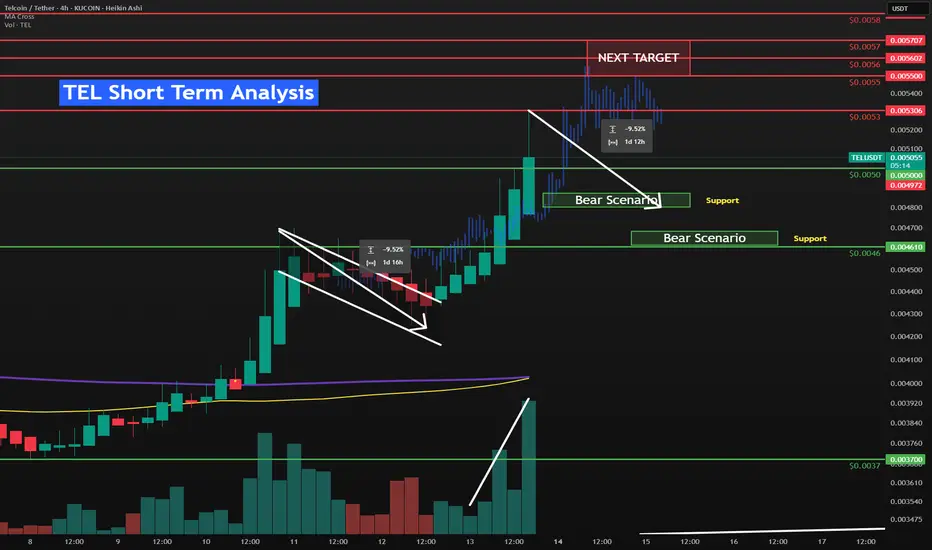
TEL short term to $0.0057 resistance⚡️ NYSE:TEL broke out of the Flag pattern, snatched up the liquidity and broke through multiple short-term resistances between $0.0044 to $0.0052. Finding resistance at $0.0053.
⚡️It is currently retracing down to the 0.382 fib level and the $0.005 psychological resistance that has now become support.
⚡️ NYSE:TEL momentum has increased/sped up as seen by it moving faster than the recent blue bars pattern. I mentioned this in a post two days ago.
TEL Short Term Bull Scenario
🟢$0.0053 is the current key short-term resistance
🟢$0.0057 represents the full repeat of the September 12th 2024 pump that this has appeared to be copying.
🟢🟢The previous rally before the flag was 26% bottom to top. We have room left to get to that before another 10% retracement. We should easily go to $0.0055-$0.0057 from here.
TEL Short Term Bear Scenario
🔴Retrace to around the $0.0048 which is the 0.5 fib retracement, a psychological level and also matches the recent flag pull-back size of 9.5%. There is a bunch of liquidity built up between $0.0047 and $0.0045 but I think that is just risk management at this point.
Liquidation Levels
NYSE:TEL Liquidation Heatmap - It will be interesting to watch the Liquidation Heatmap over the next few hours, as we should see new liquidity appear above the current price.
CRYPTOCAP:BTC has futures liquidity built up at $116k this normally suggests a downward move. I think the Macro factors are too strong for that. But we need time to see the charts print more volume above current price. CRYPTOCAP:BTC is building up liquidity at $123k too but it is less dense.
My thinking is we catch a breather and trade sideways here to solidify this level. Then break through local highs, BTC to break through the $120k psychological level and head up to $123k liquidity then retrace. Which would line up with NYSE:TEL hitting resistance at $0.0057.
Bitcoin (BTCUSDT) Potential Move from $43,600 to $120,000Description:
Based on the current weekly chart analysis for Bitcoin / Tether Standard Futures (BTCUSDT), there is a significant potential for Bitcoin to move from $43,600 to $120,000. Below are the key points observed:
Current Price: Bitcoin is currently trading at approximately $54,806.45, down by 5.75%.
Elliott Wave Analysis:
The chart indicates a potential ABC correction pattern.
Wave A has completed, and Bitcoin is currently in Wave B, which suggests an upcoming bullish Wave C.
Support and Resistance Levels:
The primary support level is at $39,987.31.
The significant resistance level and target is the area around $120,000.
Fibonacci Retracement Levels:
38.2% Retracement: $31,145.00
50.0% Retracement: $23,356.00
61.8% Retracement: $15,568.00
Indicators:
RSI shows potential bullish divergence indicating a possible upward move.
Volume profile indicates strong accumulation in the lower price ranges.
Extrem Buy Alert: The chart highlights an "EXTREM BUY ALERT," suggesting that the current levels could be a significant buying opportunity before the expected upward move.
Chart Details:
Timeframe: Weekly (1W)
Ticker: BTCUSDT.PS
Exchange: Binance
Disclaimer: This analysis is based on historical data and technical indicators. It is not financial advice. Please conduct your own research before making any trading decisions.

Potential 39% gain in ERNUSDPotential 39% gain in ERNUSD.
This is due to a few reasons:
1. My custom Data Distribution script showed that the price of ERN was overextended on July 1st, meaning that a potential reversal was on the cards.
2. My custom Zero-Lag USI indicator has shown an entry signal (green arrow)
3. The last 2 days have seen a large volume spike, which usually happens either at the end of the move or beginning of the move. Since it has been in prolonged down trend, expecting a reversal here to around 1.317

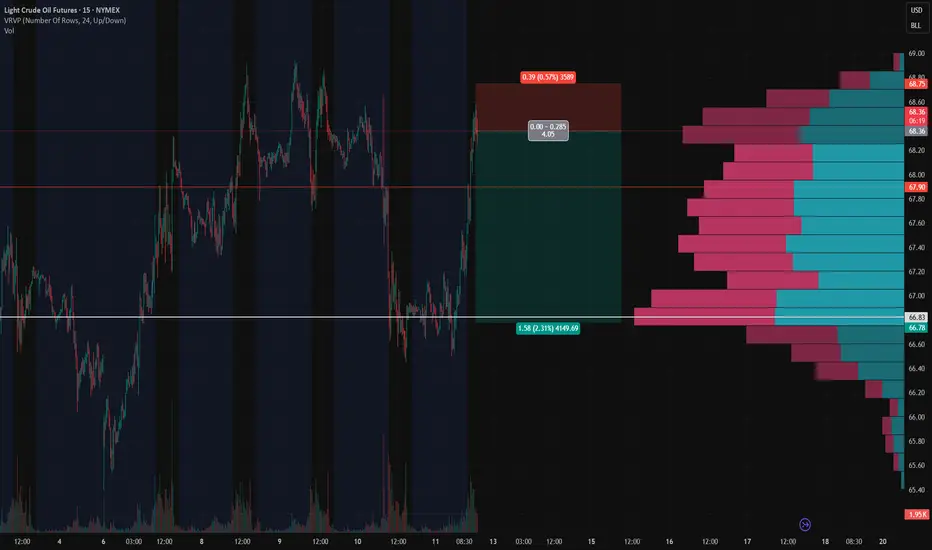
CL1! Short Setup – Fading Into Volume Shelf📉 CL1! Short Setup – Fading Into Volume Shelf
🔹 Context:
Price just tapped into a heavy upper volume shelf (68.35–68.50) — the exact area where the prior breakdown started. This zone aligns with rejection highs and the upper edge of the VRVP profile.
📌 Setup Logic:
🔺 Entry: 68.36–68.50 (into supply zone)
⛔ Stop: 68.75 (above liquidity peak)
🎯 Target: 66.78 (prior demand + volume node)
📐 RRR: ~4.0:1
⚠️ Trigger: Do not enter early — wait for rollover of price which it looks like we are getting now.
📊 Why It Matters:
📈 VRVP shows clear upper and lower volume shelves
📛 Price has overextended into a prior rejection zone
🔁 Potential for a mean-reversion leg once we confirm momentum breakdown
📷 See attached chart for full zone layout
🧠 Let me know if you’re entering or watching this one 👇
#CrudeOil #CL1 #FuturesTrading #VolumeProfile #SciQua #OrderFlow
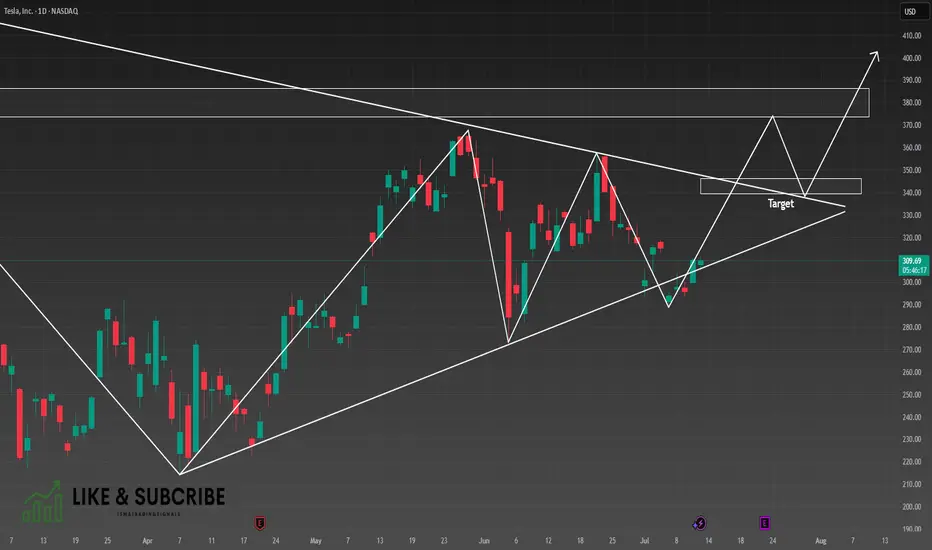
TSLA, Long, 1D✅ TSLA has just broken out of a clear symmetrical triangle pattern, signaling a potential bullish continuation.
Yesterday’s daily candle was a white Marubozu, indicating strong buying pressure and clear dominance by the bulls.
LONG 📈
✅ Like and subscribe to never miss a new technical analysis! ✅