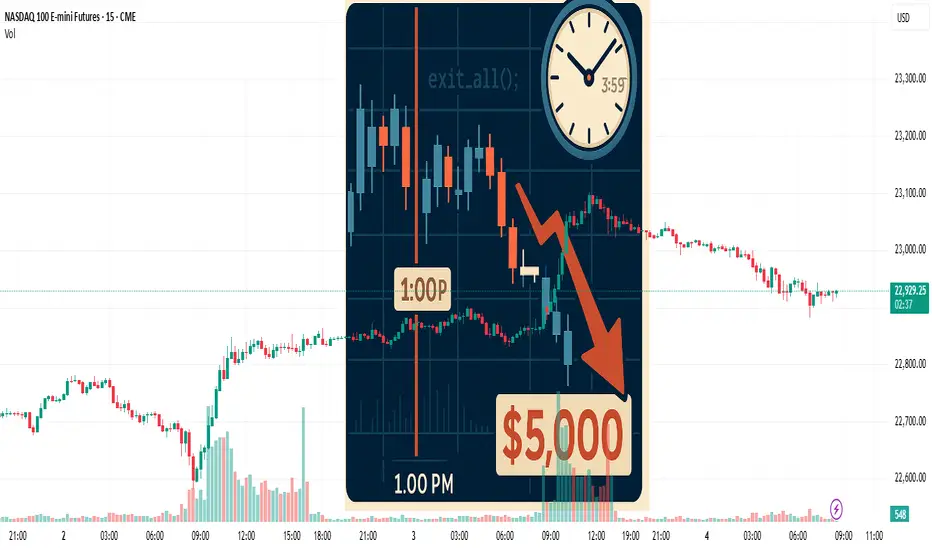
Preventing Holiday Schedule Glitches in Automated Futures Trade
Yesterday the market closed at 1:00 PM, and I still had two open positions. Normally my algorithm sends an “exit all” signal at 3:59 PM EST to close every futures contract, but it didn’t account for the holiday schedule. That glitch cost me $5,000 in just a few hours. Lesson learned.
Volume
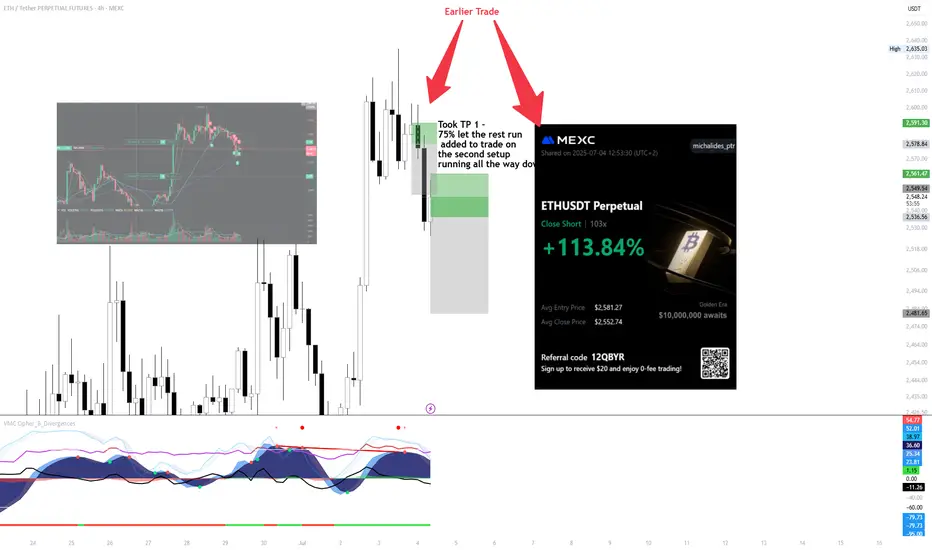
ETH SHORT SCALP ! to 2500
Executed an ETH short from the earlier setup — took 75% profit at TP1, then let the rest run.
Price pulled back into the secondary zone, added to the position with structure confirmation.
Let it roll into the next leg — clean execution, solid momentum follow-through.
+113.84% on the full move, managed with scale-out and conviction on the retest.
Patience paid. System did the work.
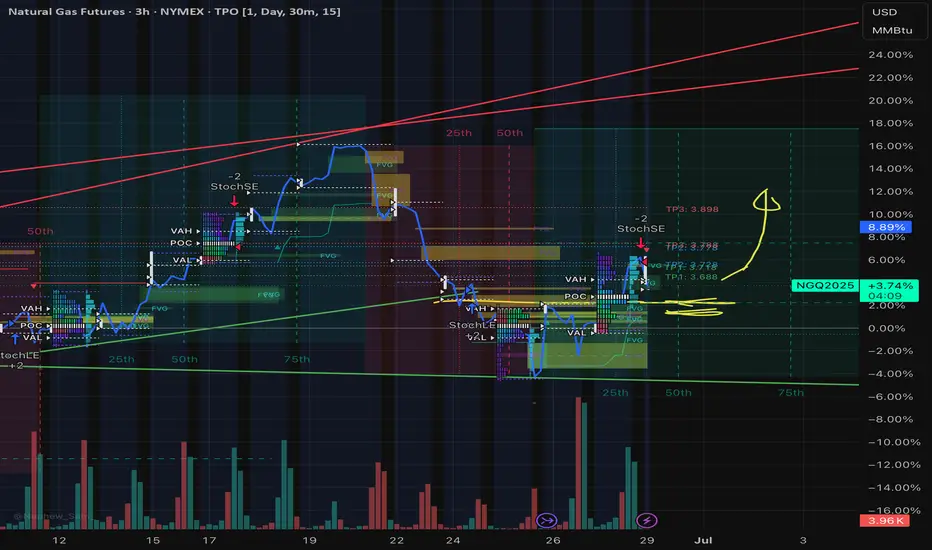
Nat Gas; Dip then RipA slight breather as expected for NG prices after such a strong reversal, from the storage report lows on 6/27/2025. Support for NG based on volume looks to be in the $3.55 to $3.65 range, before continuing a move up to $4+. NYMEX:NG1!
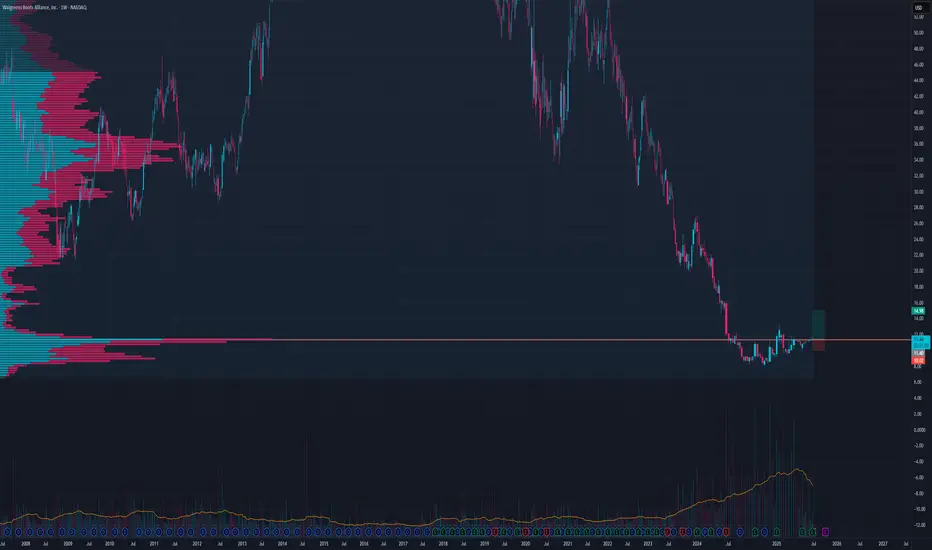
WBA LongLong triggered at 11.4 even tho I'm not happy with the volume,
a pullback to 11.2 is probably and would be a better entry point
SL at 10
TP at 15
BTC/USDT Long Setup – Daily Bullish Continuation PlayMarket Context:
Bitcoin has reclaimed significant ground after a corrective phase and is now approaching prior highs. The current move suggests strength and potential continuation — but with overhead resistance near 111,866, a retracement or consolidation before continuation is likely.
Setup Idea:
The chart illustrates a bullish continuation scenario: price may push slightly higher into resistance, then retrace into a more favorable entry zone before targeting new highs. The Fibonacci retracement levels between 100,500 and 102,470 align with a high-probability demand zone for a dip buy.
Trade Plan:
Entry Zone: Await retracement into the 0.5–0.618 fib zone (102,400–100,500)
Stop Loss: Below 99,900 (beneath 0.65 fib and invalidation structure)
Target: 119,900 (clean extension above prior high)
Risk/Reward: Favorable multi-R setup based on macro continuation
Notes:
The setup anticipates a pullback before the next impulse. If BTC breaks through 111,900 with momentum and no retrace, the trade idea would shift to chasing on strength or waiting for consolidation above.
Momentum indicators on VMC show bullish pressure building, but overbought conditions suggest temporary cooling may occur.
Let the retrace come to you — and position accordingly on confirmation.

Crypto Mining CIFR LongWe are at last major resistance here at 4 bucks before possible push towards and above 6$
Any pullback between 3.8 - 4 represents a lucrative risk to reward
Entering half position here and rest below 4$
TP1 5.06
TP2 6.06
SL 3.24

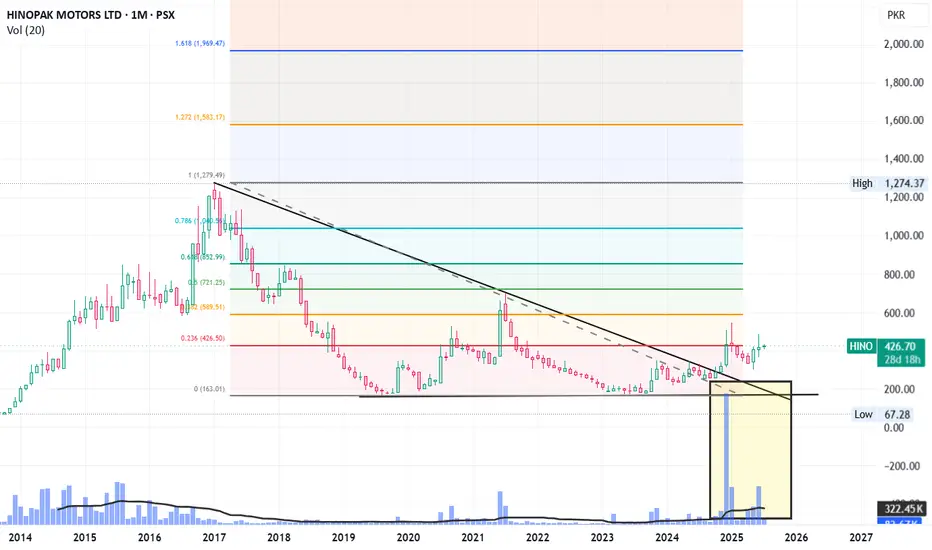
HINO LongHino broke its downward channel line in November 24. It posted a high of 545 in Jan 25 and came back to retest the level which broke the downward channel (~300).
Now it is exactly at its Fib 0.236 level, crossing which, it will pace up and move towards its next levels.
Next levels are: 545, 589, 721 and 853 in short to medium term.
Long terms target can be its all-time high level of 1274.
Its not a buy / sell call, just my personal opinion.
Daily, weekly and Monthly RSI are all at or around 60 that show positive momentum.
Moreover, the increasing volumes since it broke downward channel showing active players ;)
One thing to note that its free float is very low, that will cause its very fast move upward (whenever it may be)
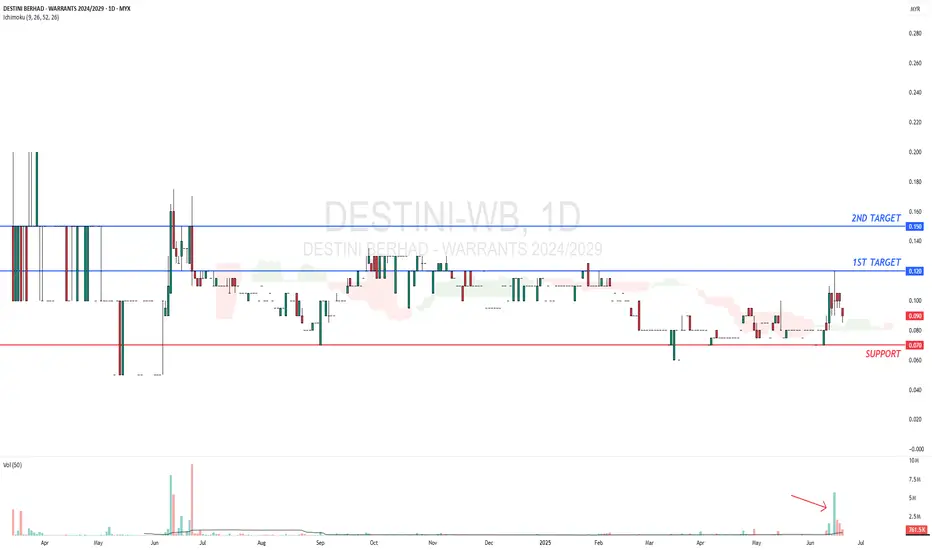
DESTINI-WB - May follow its mother share ?DESTINI-WB - CURRENT PRICE : RM0.090
This warrant is an illiquid and a bit difficult to trade. However recently alot of trading activity takes place as we can see in the volume bar. This is due to its mother share DESTINI (7212) broke out from its accumulation phase on 12 JUNE 2025. At the same time, it also makes a NEW 52 WEEK HIGH. The company's fundamental is improving. Traders may take this opportunity to buy the company's warrant as it is so cheap and have potential of following its mother share. Furthermore, the expiry dates is on 06 MARCH 2029.
ENTRY PRICE : RM0.085 - RM0.100
TARGET : RM0.120 (33.33%) and RM0.150 (66.67%)
SUPPORT : RM0.070 (-22.22%)
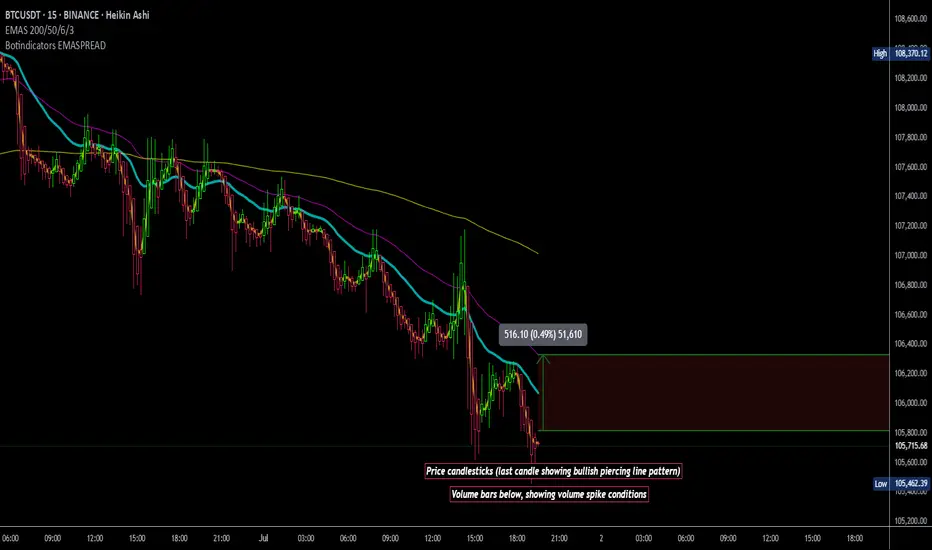
BTC/USDT Technical Analysis, 2025-07-01 19:30 UTCA bullish trade opportunity was identified after price action formed a Piercing Line candlestick pattern, signaling a potential reversal from recent lows.
🔹 Technical Overview:
Entry Price: 105,869.86 USDT
Take Profit (TP): 106,939.86 USDT
Stop Loss (SL): 104,669.86 USDT
200 EMA: 106,320.49 USDT (Price is trading below — potential dip-buy opportunity)
Pattern Detected: Piercing Line (bullish reversal)
🔹 Volume Context:
Recent candles showed moderate volume with signs of buyer interest increasing.
OBV trend has turned slightly positive, supporting a short-term bullish case.
🔹 Order Flow:
Price action is showing signs of recovery from a local support zone.
Some imbalance in the order book tilted toward buyers, with supportive bid liquidity observed.
This setup combines trend deviation, bullish price action, and support reaction, creating a favorable risk-to-reward scenario. Trade is now active and being monitored toward the defined TP level, with strict stop-loss protection in place.
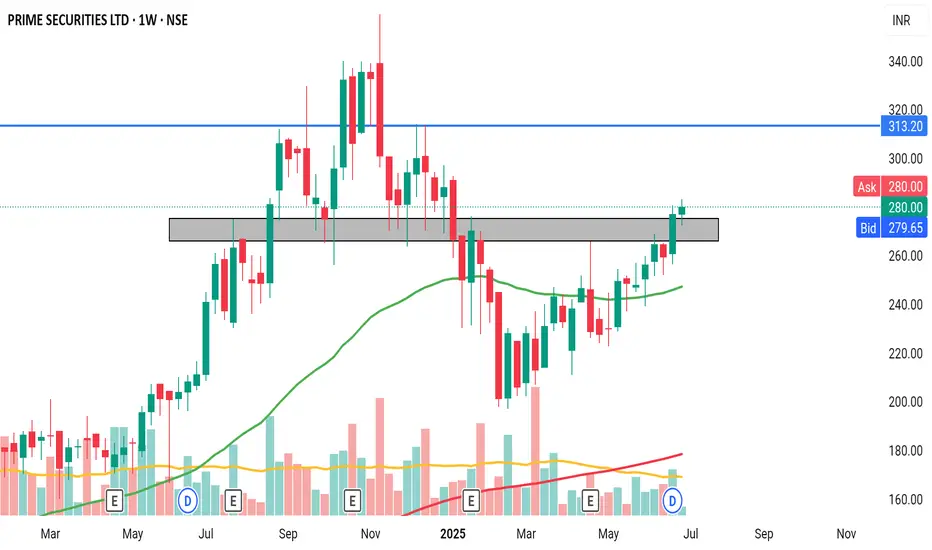
PRIME SECURITIES Crossed resistance with good volume in weekly timeframe. Price above 50 EMA indicates bullishness.
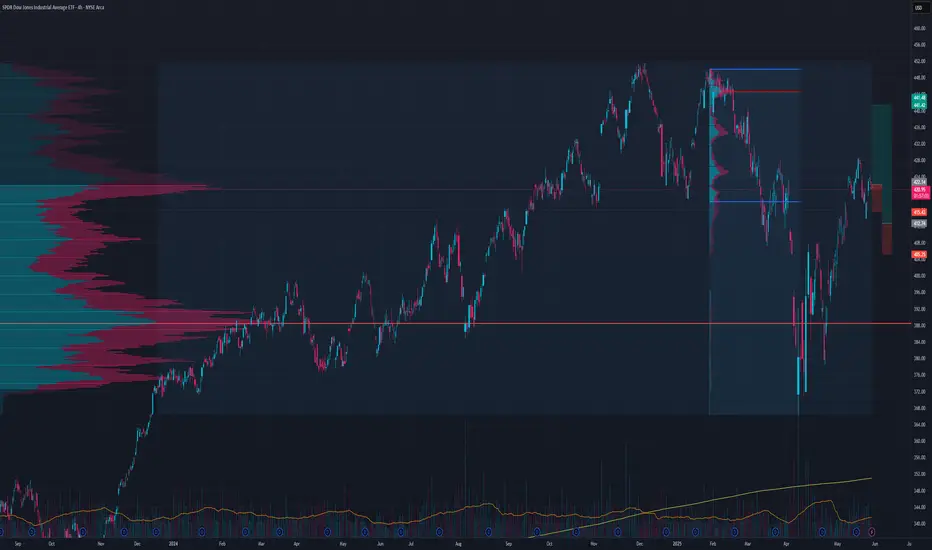
Dow Jones LongsCouple long ideas,
Price action is sitting on big volume note
Sooner or later expect bullish price action
Conservative Position sizing is prudent in this market environment
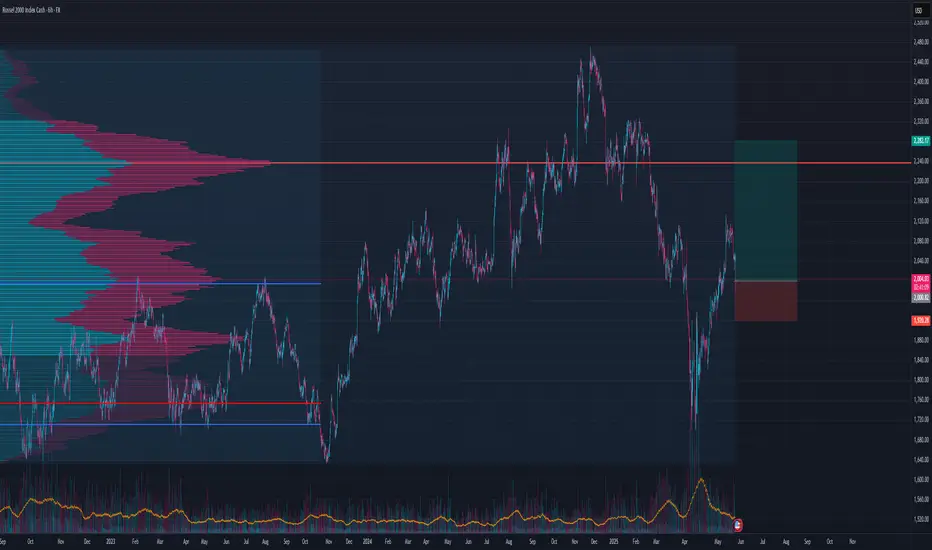
Russels IWM LongSeems decent here since its the VAH of the previous all time high correction move
Pump into POC for TP
Would not risk more then 1%
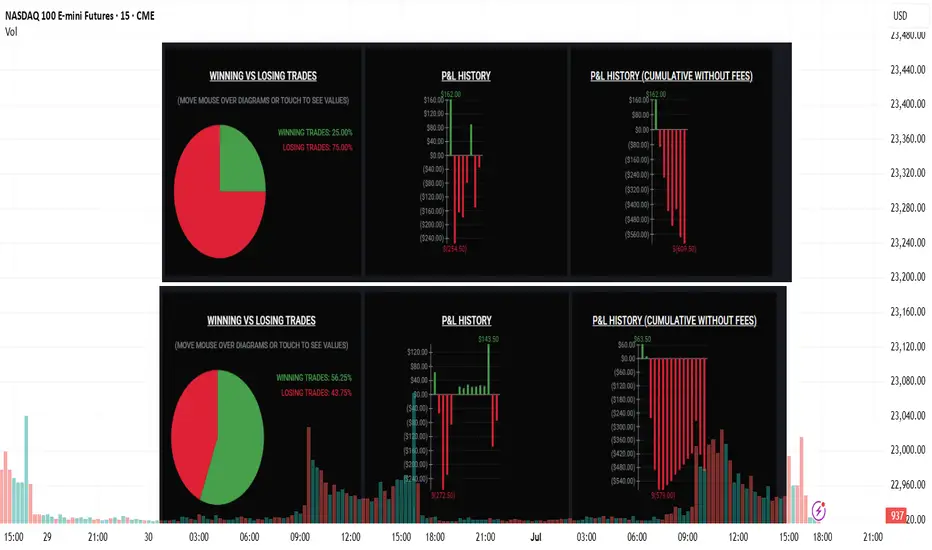
June trading results - three automated trading systemsHi,
In month of June 2025, my three automated trading systems made 32 trades on ME.S and MN.Q.
The pnl pie charts are on the screen. I lost about $1,000 in total. I trade on Micro. Well, I was up for the past 5 month but this kinda hurts, but its ok, I should not give up. I have back tested my strategies using python backtrader in 5 years (rolling walk forward), I know that lost is also expected.
My system trades on 15 min candle, and I use tradingView + tradovate automation system which I built myself.
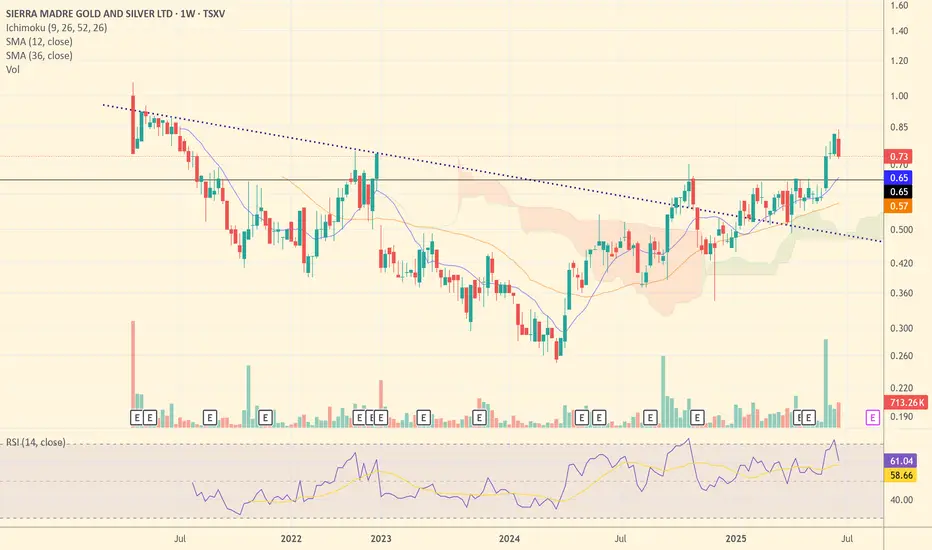
SM: Poised for Silver Alpha? - A Producer's Growth StorySierra Madre Gold and Silver (TSXV: SM) is shaping up to be a prime candidate for significant upside in a rising silver market. Having recently transitioned to commercial production and achieved positive cash flow in Q1 2025, SM has moved past the riskiest development hurdles and is now firmly in the "Production & Growth" phase of the Lassonde Curve.
Why SM Stands Out for Potential Upside:
- Operational Momentum: In Q1 2025, SM achieved positive cash flow with sales of 165,000 ounces of silver equivalent (AgEq), a critical milestone that validates the Guitarra project's viability.
- Improving Cost Structure: All-in Sustaining Costs (AISC) have been brought down to approximately $29/ounce AgEq. This efficiency directly translates to expanded margins as silver prices climb.
- Exponential Leverage to Silver Price: At a $40/ounce silver price scenario, SM's margin would jump to over $11/ounce AgEq. This significant increase in profitability is a powerful catalyst for share price appreciation, generating robust free cash flow for reinvestment.
- Clear Growth Catalysts: The company has ambitious plans to optimize operations, implement new flotation systems, and expand mill capacity to 1,200-1,500 tonnes per day. This could boost annual production to 2.5-3 million ounces of silver, creating substantial organic growth.
- Supportive Environment: A observed positive shift in the Mexican regulatory environment towards mining further enhances investment appeal.
Technical Analysis Snapshot:
SM's chart shows promising technical signs. After a period of consolidation (akin to a "valley" in the Lassonde Curve), the stock has recently experienced a breakout above a long-term downtrend line, signaling a potential shift from bearish to bullish sentiment. Volume accompanying this breakout is crucial for conviction. The stock appears to be establishing new support levels, indicating a potential accumulation phase. Investors should monitor for sustained trading above key moving averages and continued volume confirmation as indicators of a strengthening trend.
Risk-Reward Profile:
- Risk Profile: Medium to High (as a new, smaller producer with expansion execution risks)
- Potential Return at $40 Ag: Very High (due to dramatic profitability increase and accelerated growth)
Conclusion:
Sierra Madre Gold and Silver is well-positioned to capitalize on a bullish silver market. Its proven production, cost efficiency, and clear expansion roadmap make it a compelling candidate for significant price appreciation as silver prices head towards $40/ounce. For investors seeking "alpha" with a calculated approach to risk, SM offers a compelling growth story.

BTC/USD Technical Analysis – Weekly Elliott Wave StructureIn this video, we analyze the weekly chart of Bitcoin ( BYBIT:BTCUSDT ) using Elliott Wave theory.
The current structure suggests the beginning of a new bullish impulse (waves 0, 1, and 2) following a clearly completed and technically correct corrective phase.
We explore potential impulsive scenarios starting from wave 2, using Fibonacci extensions to project possible targets and identifying key support zones and invalidation levels.
This analysis aims to provide a macro perspective based on price action, helpful for traders and investors following BTC from a medium- to long-term technical view.
🛑 Disclaimer: This content is for educational and informational purposes only. It does not constitute investment advice. Each user is responsible for their own trading decisions.

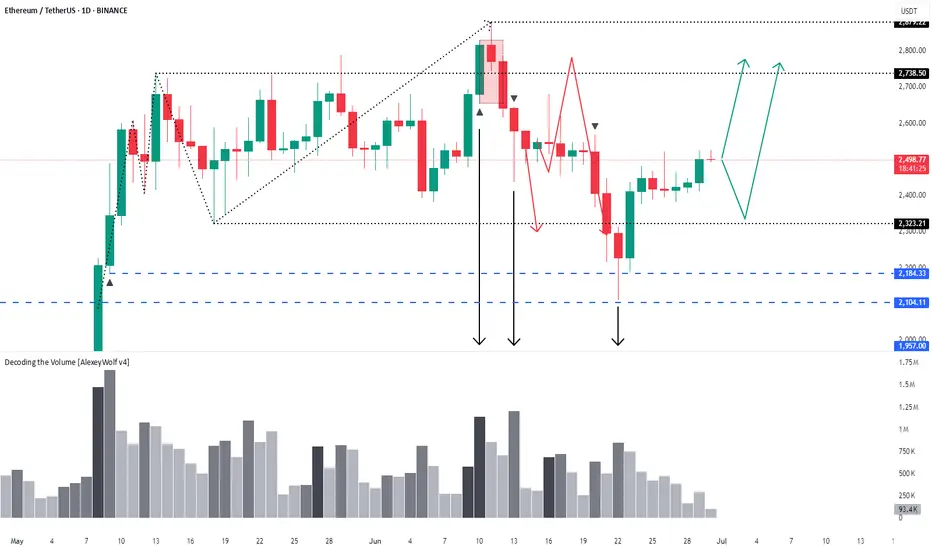
Ethereum – 1D timeframe overview with Initiative AnalysisHey traders and investors!
The seller has reached their target.
A buyer started buying from the 2184 level and now holds the initiative.
Targets are on the chart.
This analysis is based on the Initiative Analysis concept (IA).
Wishing you profitable trades!
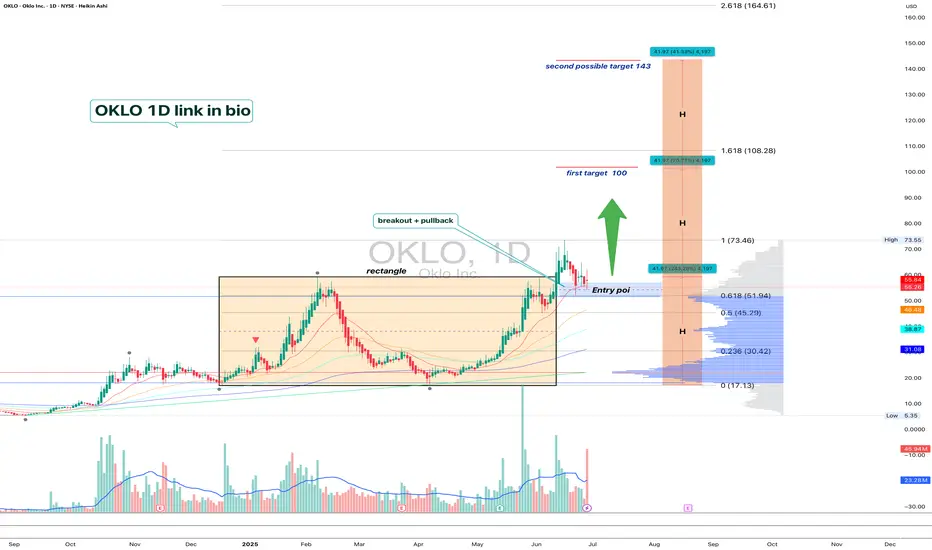
OKLO — when nuclear momentum breaks resistanceSince late 2024, OKLO had been consolidating inside a clear rectangle between $17 and $59. The breakout from this long-term range triggered a new bullish impulse. The price has since returned to retest the breakout zone, now aligned with the 0.618 Fibonacci retracement at $51.94. The retest has completed, and the price is bouncing upward, confirming buyer interest.
Technically, the trend remains firmly bullish. The price closed above the prior range, EMAs are aligned below, and the volume spike during breakout supports genuine demand. The volume profile shows a clean path toward $100, indicating limited resistance ahead. The structure suggests a controlled rally rather than an exhausted move.
Fundamentally, OKLO is a next-generation SMR (Small Modular Reactor) company focused on delivering compact, efficient nuclear power solutions. Following its public debut via SPAC and recent capital injection, OKLO is transitioning from development to implementation. Institutional interest is holding strong, and the broader move toward decarbonization and energy independence places the company in a strategic position.
Target levels:
— First target: $100 — psychological and technical resistance
— Second target: $143 — projected from prior range breakout
OKLO isn’t just another clean energy ticker — it’s a quiet disruptor with nuclear potential. The chart broke out. The volume confirmed. Now it’s time to see if the market follows through.
Mastering Delta–Volume Divergence
🎓 Mastering Delta–Volume Divergence: How to Read Institutional Absorption and Trap Setups
⸻
1️⃣ What Is Delta?
Delta measures the net aggression between buyers and sellers:
• Market Buys: traders lifting the ask
• minus
• Market Sells: traders hitting the bid
✅ Positive Delta indicates stronger buying pressure.
✅ Negative Delta indicates stronger selling pressure.
Delta shows who is initiating trades, not just that trading is occurring.
⸻
2️⃣ What Is Volume?
Volume measures the total number of contracts traded, regardless of who initiated them.
Every matched buy and sell contributes equally to volume.
Volume reveals activity, but not who controls the move.
⸻
3️⃣ What Is Delta–Volume Divergence?
Delta–Volume Divergence occurs when:
✅ Volume is high (lots of trades happening),
✅ But Delta is near zero (neither side dominates).
This signals:
• Intense two-sided activity between buyers and sellers,
• Strong participation on both sides,
• Passive absorption—institutions quietly filling large orders without moving price significantly.
⸻
4️⃣ Chart Breakdown – Bar by Bar
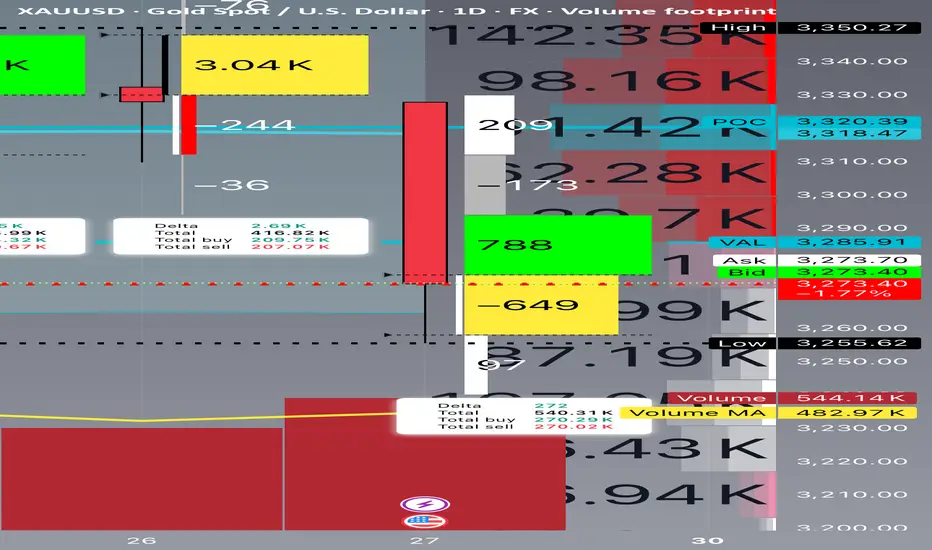
Below is a clear example of this concept in practice, reviewing each daily bar from your footprint chart:
⸻
🔴 June 24
• Delta: -8,240 (strong net selling)
• Volume: 575,720 (very high)
• Interpretation:
• Heavy, aggressive selling.
• Clear trend-confirming action.
• No divergence.
⸻
🟢 June 25
• Delta: +4,650 (net buying)
• Volume: 343,990 (moderate)
• Interpretation:
• Counter-trend buying or short covering.
• Less volume and less conviction.
⸻
🟢 June 26
• Delta: +2,690 (mild net buying)
• Volume: 416,820 (higher)
• Interpretation:
• Rising volume but weaker delta.
• Early sign of balance developing.
• Possible absorption beginning.
⸻
🟨 June 27 (Critical Bar)
• Delta: +272 (near zero)
• Volume: 540,310 (very high)
• Interpretation:
• Huge volume churn.
• Neither buyers nor sellers in control.
• Likely institutional absorption of aggressive orders.
✅ This is a textbook example of Delta–Volume Divergence.
⸻
5️⃣ Why This Matters
Professional Insight:
• Sellers had been aggressive for several sessions.
• Suddenly, volume remained elevated, but delta flatlined.
• This suggests:
• Exhaustion of selling aggression, or
• Institutional accumulation and passive positioning.
This often sets the stage for:
• A trap reversal (short squeeze), or
• A continuation flush if sellers regroup and push lower.
⸻
6️⃣ Confirmation Scenarios
Scenario A: Bearish Continuation
• Watch for renewed strong negative delta (e.g., -5,000 or worse).
• Price remains below the last support (~3,250).
• Confirms absorption failed and sellers remain dominant.
Scenario B: Short Squeeze Reversal
• Price reclaims the VAL (~3,285–3,300).
• Delta flips strongly positive (+5,000 or more).
• Trapped shorts begin covering, driving price back toward supply.
⸻
7️⃣ Common Misinterpretation
⚠️ High volume alone does NOT mean momentum.
Key Point:
If delta is flat, high volume simply means churn, not directional energy.
This is why inexperienced traders often get caught:
• They see heavy volume and assume a breakout is underway.
• In reality, the market is absorbing liquidity to trap both sides.
⸻
8️⃣ Professional Tips for Trading Divergence
✅ Wait for confirmation before entering:
• Clear delta shifts, and
• Price reclaiming or rejecting key levels.
✅ Be aware of stop zones:
• Under recent lows if buyers fail,
• Above recent range if sellers get exhausted.
✅ Avoid trading during pure churn without clear follow-through.
⸻
9️⃣ Quick Recap
✅ Delta–Volume Divergence: High volume, flat delta, no clear directional control.
✅ Typically signals absorption and position buildup.
✅ Requires confirmation before committing to trades.
✅ Recognizing it helps you avoid traps and false breakouts.
⸻
🔟 Final Thought
Learning to read divergence is what separates professional traders from retail:
“Volume tells you how hard the market is working. Delta tells you who’s winning.”
Combine both to see the hidden game behind every price bar.
⸻
⚠️ Disclaimer: This lesson is for educational purposes only. Nothing here constitutes financial advice.
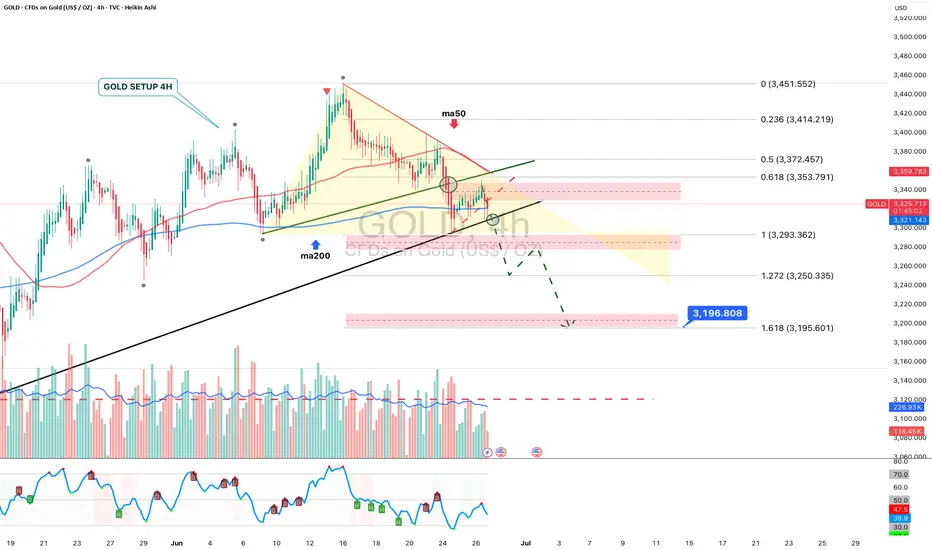
GOLD 4H: not all that glitters is bullish...The 4H chart shows a clean descending triangle breakdown. Price failed to reclaim the trendline and was rejected under both MA50 and MA200. The bounce into 3325–3340 was absorbed — classic liquidity sweep and fade. Volume confirms bearish control.
Technically, the breakdown below 3320 opens the way toward $3293 (1.0 Fibo), $3250 (1.272 extension), and final target at $3195 (1.618), where buyers might step in. RSI supports the continuation without signs of reversal. Structure broke — and the market is telling us where it's heading.
Tactical plan:
— Entry at market or on a retest of $3325–3335
— Targets: $3293 → $3250 → $3195
— Stop: above $3340 (above MA50 and broken trendline)
When gold looks shiny, smart traders look deeper. This breakout isn’t golden — it’s a trap for late bulls.
Raymond Lifestyle is looking good!NSE:RAYMONDLSL
- After a 5 month long consolidation now breaking out.
- This is looking like a stage 2 breakout.
- Relative strength turned positive.
- RSI is above 70 indicating very high momentum
- Volume is also very good on the break out candle. Also we can observe that volume is higher on the green candles and lower on the red ones.
- Today it closed above its 100 day exponential moving average as well.

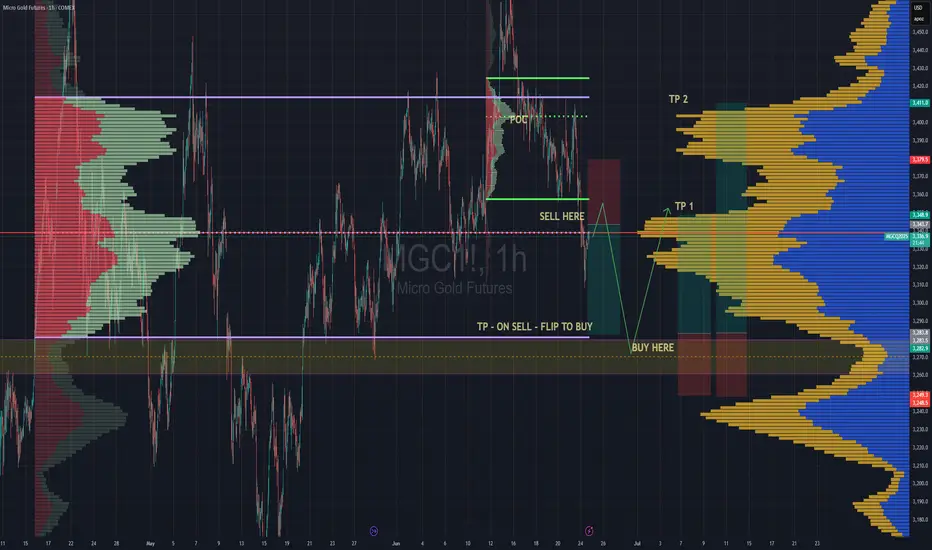
Long & Short Entry Forecast For GoldCooling war tensions seem to be cooling the Gold bullish rally as well.
But we're still in the same range since April 15th and will likely stay in the range until further notice *or the next tweet*
The Sell entry is great now cos we're near the top of the high volume node, so even if we consolidate around that POC this sell entry will still be putting us closest to the top of the node.
Hold your sell and TP at the VAL . We have a very deep low volume area there and its being a point of support since April. So we can place bets with small risk on hoping it holds cos if it doesn't, it wont be pretty. That is still the best place to buy regardless. So manage your risk accordingly
TP 1 for the Buy trade is at the POC , which also happens to be the top of the huge volume node. Totally make sense to take a decent chunk of profit of your position there, then move you stop loss into profit and grab some pop corn. Depending on the news , the best case scenario of for the uptrend is to continue all the way up to TP2 which is at the VAH
Secure the bag :)
Enjoy