Agree to disagree... Gold is topping right now.My price path seen above is a complete guess but it stems from long term trend lines and more importantly order flow from last week.
On Thursday there was a #1 trade on AMEX:PHYS for $200+ Million at the green levels in my chart above (Equivalent levels). PRICE WILL 100% go to my green lines by end of this week 04/25.
We are over shooting the dark pool sale but a lot, however, this is always to trap retail and create fomo/peak fear.
In the correction/recession cycles, gold ALWAYS TOPS LAST before the crash...
Volume

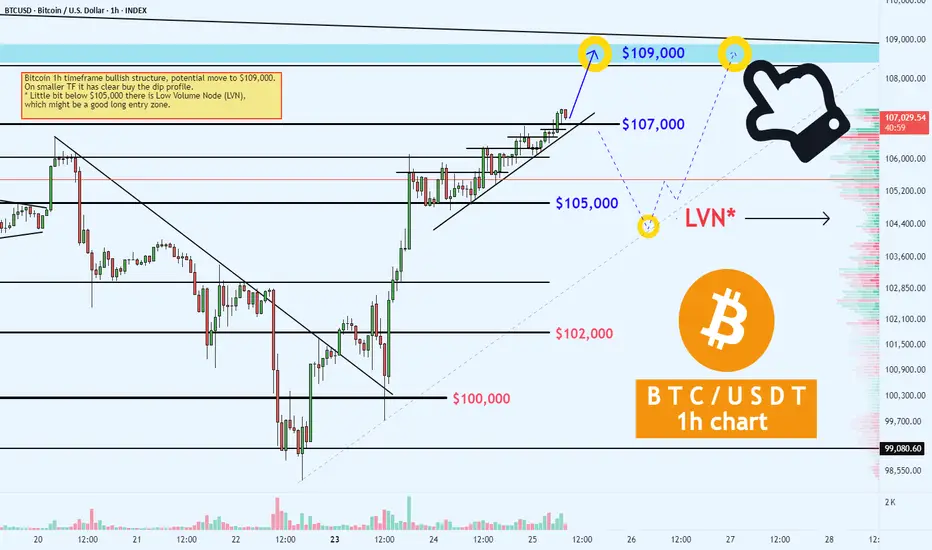
BTC/USD 1h Chart Analysis: BTFDBitcoin is showing a bullish structure on the 1h timeframe with a potential move towards $109,000.
On smaller timeframes, it exhibits a clear "buy the dip" profile.
Key Levels:
$109,000: Potential upside target.
$107,000: Resistance/Support zone to watch for rejection.
$105,000: Low Volume Node (LVN*) a possible good long entry zone.
$102,000 - $100,000: Support levels to monitor if $105,000 fails.
Currently it have bullish trend with a potential dip near $105,000 showing good entry point.
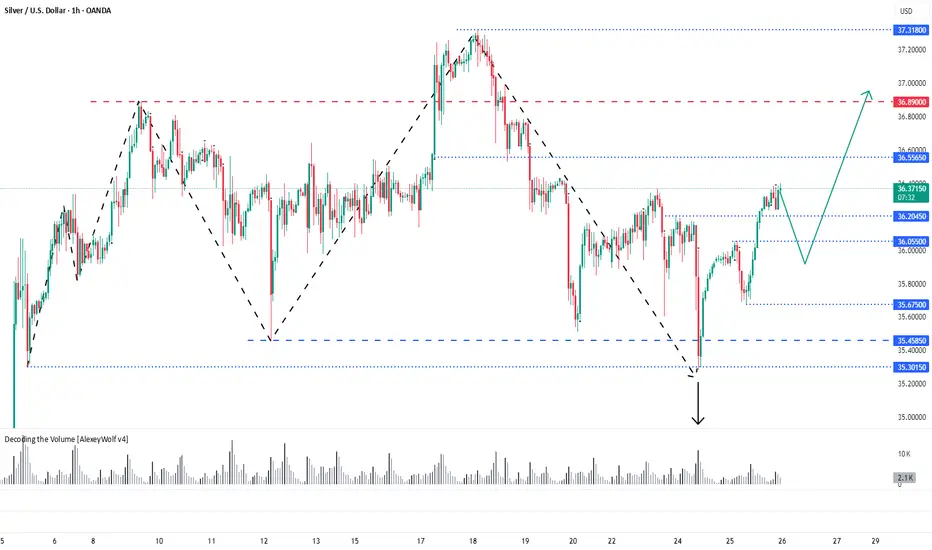
Silver - overview with Initiative AnalysisHey traders and investors!
Hourly Timeframe
📍 Context
The hourly chart is in a sideways range.
Currently, the buyer has the initiative, potential target 36.55.
📊 Key Actions
The 35.30 level on the hourly timeframe has worked well. This level marks the correction extreme within the dominant buyer initiative (i.e., an initiative where the correction is less than 50%).
A seller attack bar (IKC) targeting the lower boundary of the sideways range was absorbed by the buyer, and this absorption led to a renewed buyer. Targets visible on the chart - Hourly and daily timeframe: 36.55 and 36.89
Daily Timeframe
📍 Context
Currently, the buyer has the initiative, potential target 36.89.
📊 Key Actions
On the daily timeframe, there was also a seller IKC bar attacking the lower boundary of the buyer's initiative, which was bought back by the buyer.
🎯 Trade Idea
Potential buying patterns can now be monitored at: 36.20, 36.05, 35.67, 35.458
With targets set at: 36.55, 36.89, 37.32.
This analysis is based on the Initiative Analysis concept (IA).
Wishing you profitable trades!
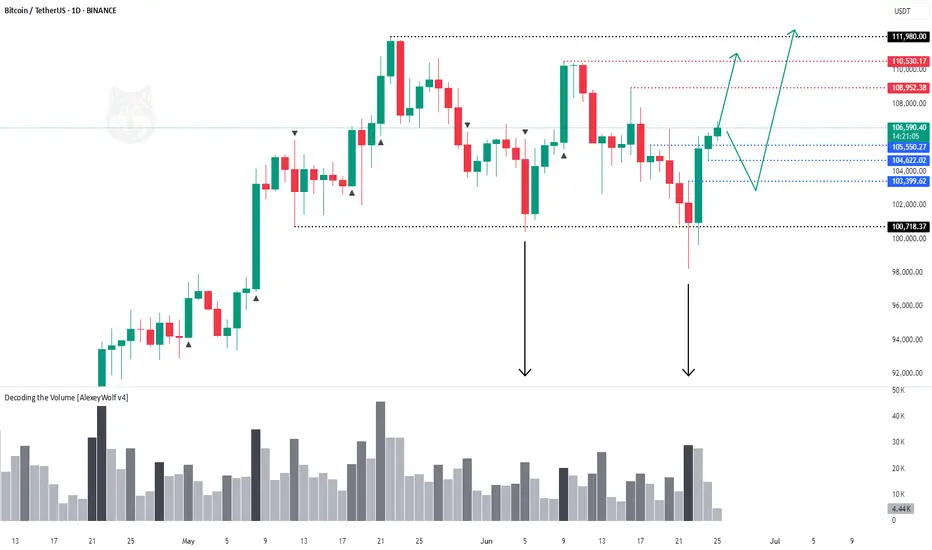
Bitcoin - overview with Initiative AnalysisHey traders and investors!
📍 Context
On the daily timeframe, the market is in a sideways range.
The boundaries are marked with black lines.
Buyer initiative is currently active.
Targets: 108,952; 110,530; 111,980.
📊 Key Actions
The seller attempted twice, on increased volume, to break down below the range, but both times the buyer brought the price back inside. Only seller wicks remained below the lower boundary.
🎯 Trade Idea
🔹 Look for long setups from 105 500 -104,622 or the 103,400–100,718 zone.
There is no context for short trades at the moment.
This analysis is based on the Initiative Analysis concept (IA).
Wishing you profitable trades!
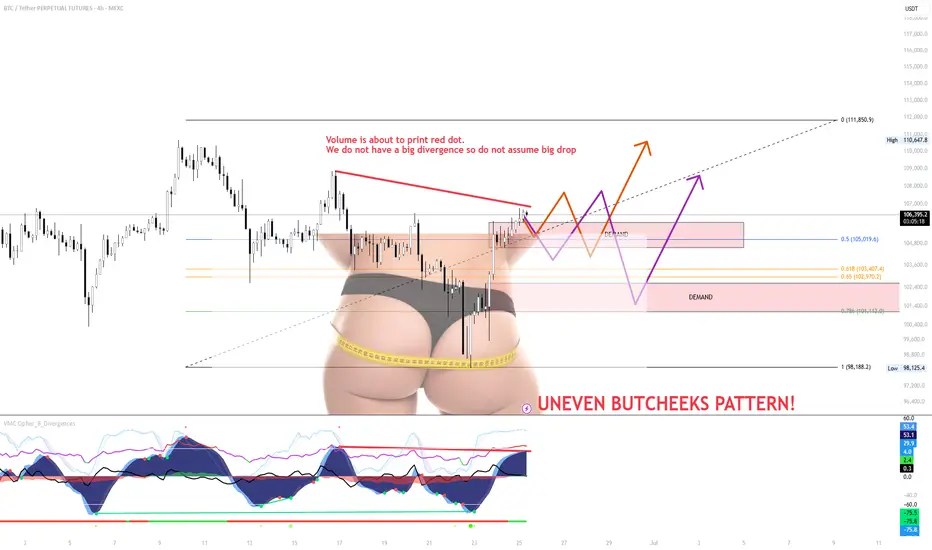
SMALL RETEST on BTC and continuation of BTC TrendThe small range forming just under local resistance is weak and showing signs of exhaustion. Despite a possible red dot printing soon, volume is not confirming a strong bearish divergence, so don’t assume a major drop is guaranteed just yet.
The “Uneven Butcheeks” pattern visually highlights imbalance
A fakeout back into the range, or
A flush to grab liquidity sitting beneath key demand zones.
Key Scenarios
Scenario A (Orange Path)
A breakout through the overhead supply zone could trigger upside continuation toward $111,850.
But unless it’s backed by strong volume and broader BTC strength, I’ll be fading this move.
Right now, this doesn’t look like conviction from bulls — it looks like exhaustion.
Scenario B (Purple Path)
A rejection at current levels or a weak fakeout could break back into the demand zone.
With thin structure below and low buy-side aggression, price could sweep down toward $102.9k–$101.1k, or even lower.
If we get this move, I’ll be watching how buyers behave around the lower demand — that’s where bulls need to prove themselves.
⚠️ Strategy:
Don’t front-run this — let the price confirm or invalidate.
Watch volume. Watch BTC dominance.
Until then, this zone is chop-heavy, and patience = protection.
Jsw Infra , 1WExpansion Channel is looking good , it is consolidating from One Year
Now it is ready to Breakout , wait for proper breakout to Happen
wait for string close above trendline
Follow for more Swing Ideas Like This

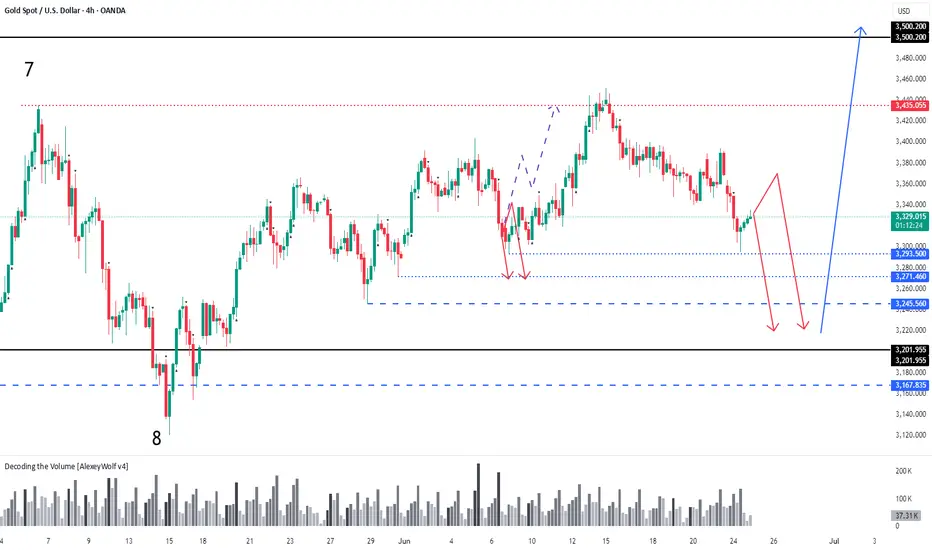
GOLD. Daily Timeframe overview with Initiative AnalysisHey traders and investors!
Daily Timeframe
Market phase : sideways. Seller's initiative.
Boundaries marked with black lines.
Gold followed an alternative scenario from the previous review toward 3435. The buyer played out the 8-9 vector of the range on the daily timeframe, and now the initiative has shifted to the seller. The seller's targets are 3245 and 3201 — areas to watch for potential buy patterns aiming for a new ATH. The price might get stuck in the 3293–3271 zone. If a strong buyer reaction occurs, a reversal may happen in this range.
The ideal area to look for buy patterns is around 3201.
Selling is risky.
This analysis is based on the Initiative Analysis concept (IA).
Wishing you profitable trades!
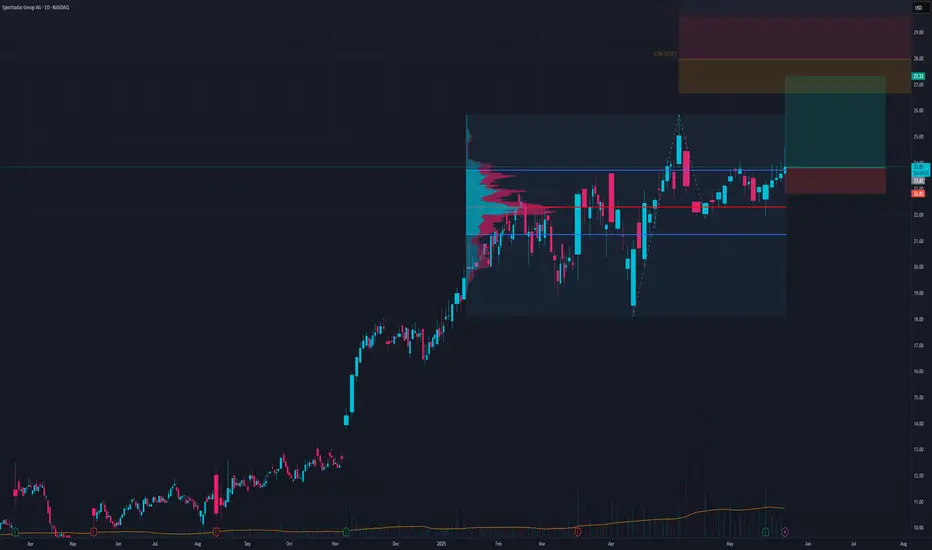
SRAD Breakout SetupLets see if this can push out of this range or not
SL 22.8
TP1 25.9
TP2 26.74
TP3 28
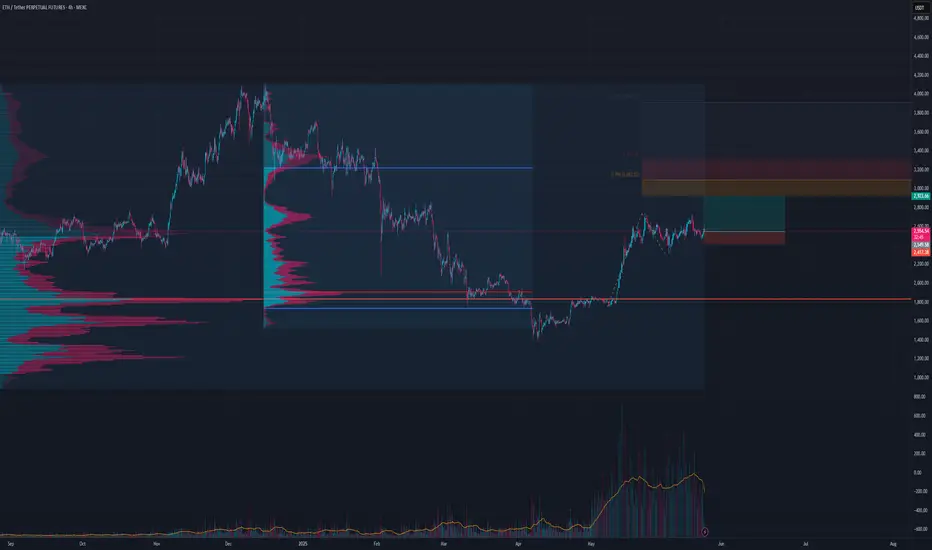
ETH Long TradeLooks bullish here for continuation
Futures are higher on holiday
Order flow neutral to bullish
Gold:bullish wedge inside a rising channel-double trap for bearsInside the major upward channel, gold formed a falling wedge — and, of course, faked a breakdown. But the move reversed quickly: price reclaimed the wedge, surged on volume, and held above the key 3363–3368 area. This isn't just a bounce — it's a structural reclaim in line with the broader trend.
Price is now in the upper part of the rising channel and has broken a local downtrend line, reinforcing the bullish signal. Consolidation around 3380–3395 might be the last pause before acceleration. Above that lies a volume gap — no resistance until 3452.
MACD is flipping bullish, RSI turning upward, and volume confirms smart money presence. Classic: trap below, breakout above. As long as 3363 holds — longs remain in control.

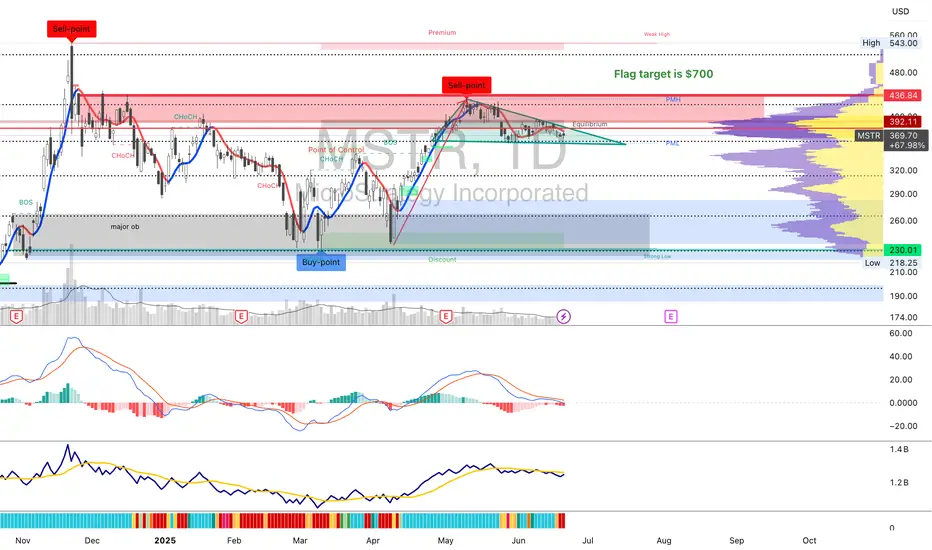
Bullish flag on $mstr, consolidating under supply tooNASDAQ:MSTR is in a flagpole position, a bullish one. The measured move target would be $700
Do you agree that MSTR is in a bullish stance?
I guess this really come down to how bitcoin does.
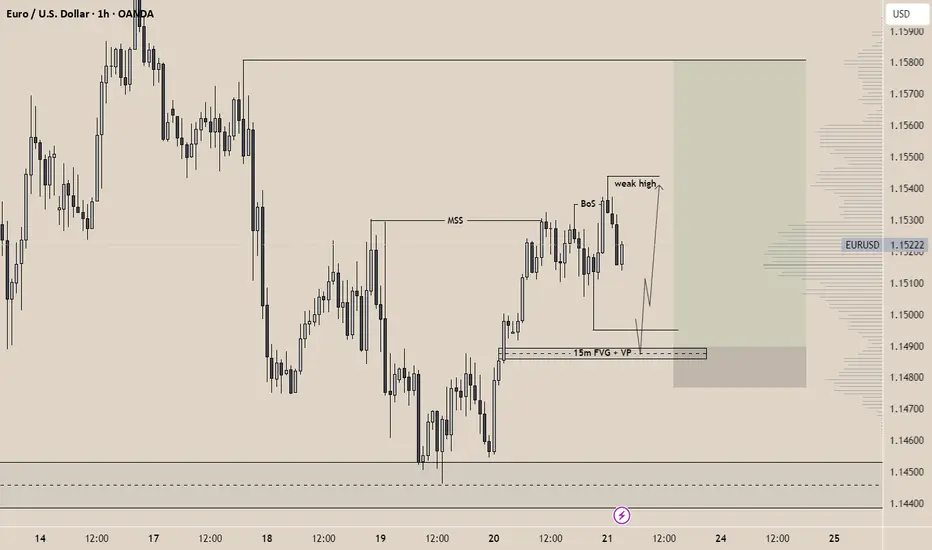
EURUSD -> Bullish Idea 22/06/2025(ICT x Volume Profile)OANDA:EURUSD 🎯 Bias: Bullish
🕒 Timeframe: H1 primary, H15 confirmation
Happy sunday traders!
Following President Trump’s strikes on Iran, I expect an initial bearish reaction in the Asian and London Sessions, then a bullish reaction in the NY sessions as sellers push the USD lower. However, the prevailing trend context remains bullish: the hourly chart has shifted structure (MSS) and broke structure to the upside. I anticipate a liquidity sweep below the recent lows, before a retracement into the 15-minute fair value gap (FVG) which aligns with the volume profile, then continuation higher to target the weak high and into the swing highs marked.
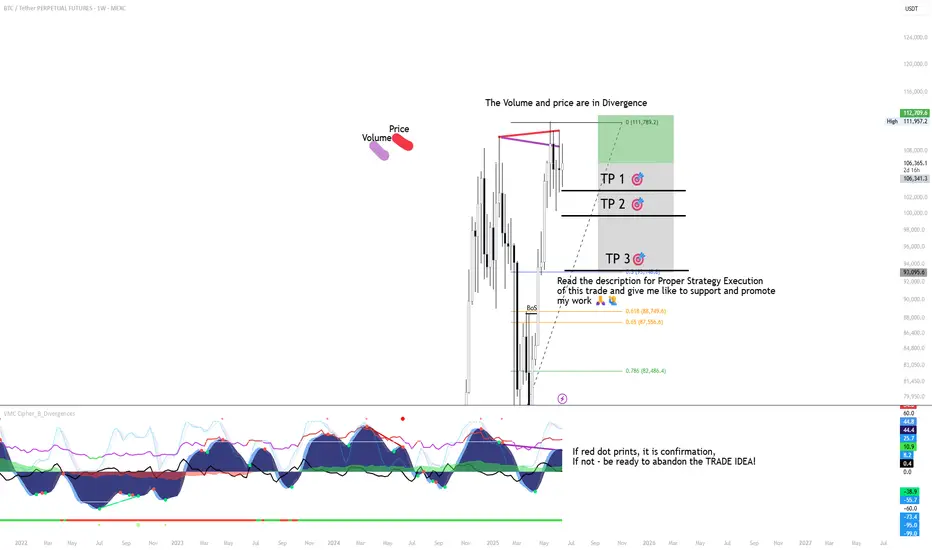
BTC MACRO PLAY - SHORT TRADE SETUP📉 BTC/USDT SHORT TRADE SETUP – WEEKLY TIMEFRAME
🔍 Trade Idea Overview:
We are seeing a bearish divergence between price and volume on the weekly chart — while price makes higher highs, volume is decreasing, signaling a potential reversal or weakening trend.
Further confluence is seen with the VMC Cipher indicator. If a red dot prints, it will confirm the short entry. If not, the trade idea should be abandoned.
📊 Trade Plan:
Entry Zone: Around $106,300–$107,000 (wait for confirmation)
TP 1 🎯: $102,000
TP 2 🎯: $97,500
TP 3 🎯: $93,000
🛑 Risk Management:
Stop-Loss: Above recent highs at $111,800 (or adjusted based on your entry)
⚠️ Disclaimer:
Once TP 1 is reached, move stop-loss to breakeven to protect capital and eliminate risk.
TP 3 may never be reached, but it remains part of the plan to capture extended downside if momentum continues.
If no red dot prints, there is no confirmation — be ready to abandon the trade.
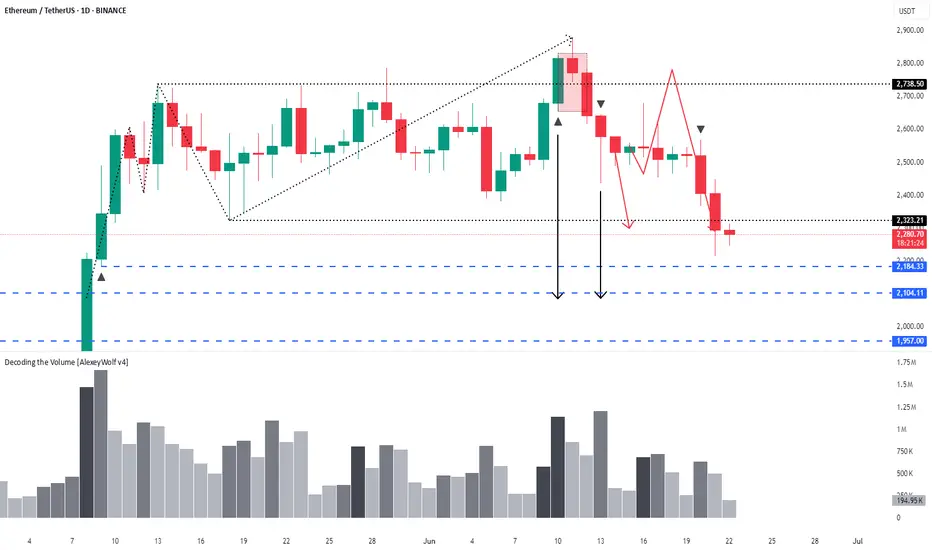
Ethereum – 1D timeframe overview with Initiative AnalysisHey traders and investors!
The price has reached the lower boundary of the range. There is no volume spike.
I expect a further decline toward 2184 and 2100. The 2100 level is a contextual area to look for buying patterns.
As part of a correction, the price could potentially drop to 1800. Monitoring.
This analysis is based on the Initiative Analysis concept (IA).
Wishing you profitable trades!

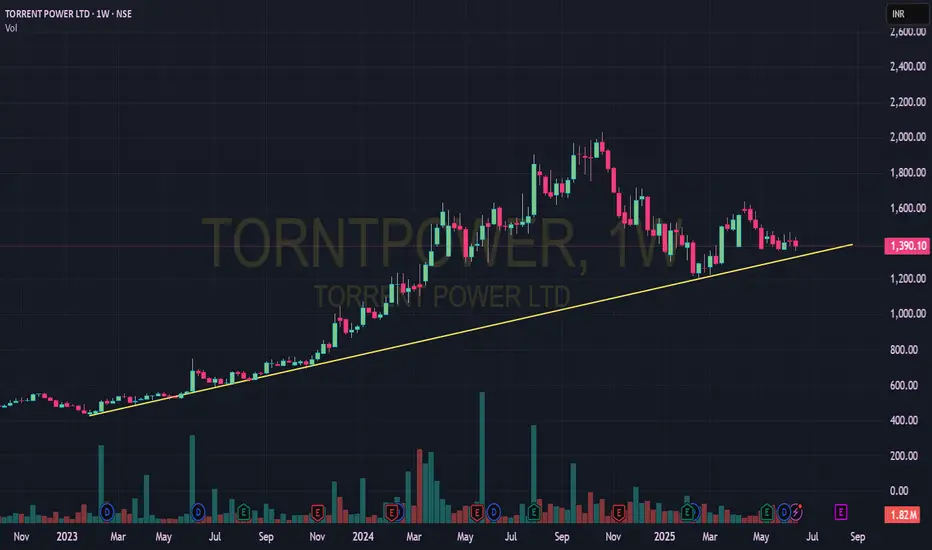
Swing the TORNTPOWER (NSE)🔍 **Technical Analysis Summary:**
✅ **Trendline Support:**
* The weekly chart shows a **well-respected ascending trendline** stretching from early 2023.
* The current price action at ₹1,390 is approaching this **long-term support zone**, which has consistently provided **bullish rebounds** in the past.
* Price action continues to form **higher lows**, confirming a structurally bullish pattern.
📊 **MACD on OBV (Volume Strength Indicator):**
* The **MACD applied on On-Balance Volume (OBV)** is showing early signs of **bullish divergence**.
* This is particularly important as OBV integrates volume with price movement, and **MACD crossover at low levels** typically indicates accumulation and **potential trend reversal**.
* A bounce in OBV would further confirm strength backed by **smart volume participation**.
⚠️ **Caution Point:**
* The recent candles have shown some **indecision and consolidation**, indicating market participants are awaiting a catalyst.
* **Global cues or negative macroeconomic factors** could temporarily break the trend, but unless a strong bearish breakdown with volume occurs, this trendline remains **technically intact and valid**.
---
💡 **Investment Thesis:**
TORNTPOWER is currently trading near a **strong, multi-touch ascending trendline** that has provided reliable support for over 18 months. The **MACD on OBV** is hinting at a **volume-backed trend reversal**, suggesting a **bullish bounce is likely** if macro sentiment remains neutral or positive.
🎯 **Trading Strategy:**
* **Entry Zone:** ₹1,370–₹1,400 (near the trendline support)
* **Stop Loss:** Below ₹1,300 (on weekly closing basis)
* **Upside Targets:**
* ₹1,550 (short-term resistance)
* ₹1,750+ (medium-term target if the trend continues)
🧠 Final Word:
This setup offers an attractive **risk-reward ratio** for swing traders and positional investors. Technicals favor a bounce — **stay cautious on macro cues**, but the **structure favors accumulation on dips** near the trendline.
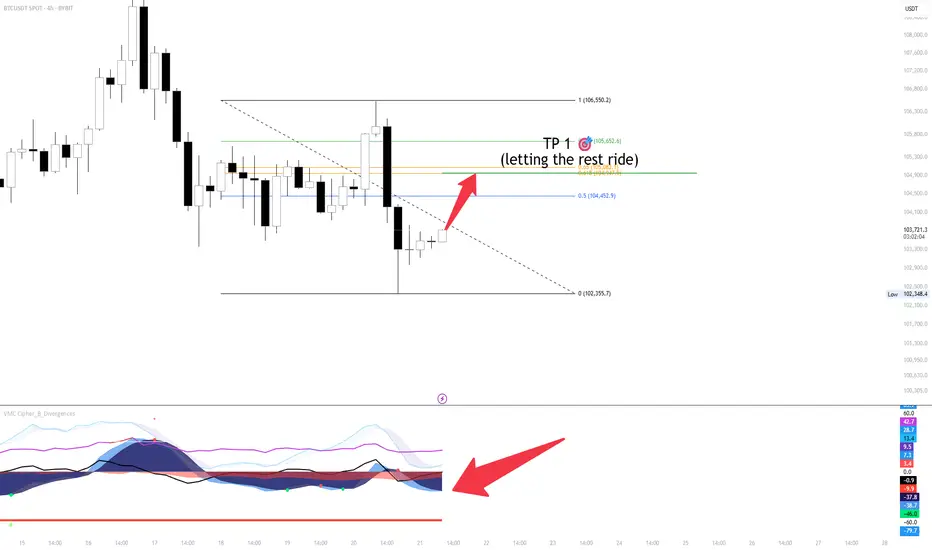
BTC 4H SCALPBTC/USDT Scalp Setup – 4H Chart
Entered a scalp position with TP1 aligned at the Fibonacci extension near 105,652. The first take-profit has been secured, and the remainder of the position is being left to ride — no emotional attachment. If invalidated, the trade will be abandoned without hesitation.
Technical Overview:
Price broke out of the local downtrend channel
Watching for a potential green dot on the volume oscillator to confirm upward continuation
VMC Cipher B shows early signs of a shift; confirmation is still pending
That said, short-term caution is warranted.
Bearish Considerations:
On the higher timeframes, there’s a visible bearish divergence between price and volume — price continues to push higher, while volume fades, indicating a potential trend exhaustion.
Thanks for your support.
If you found this idea helpful or insightful, feel free to leave a like or comment, open to your thoughts and perspectives.
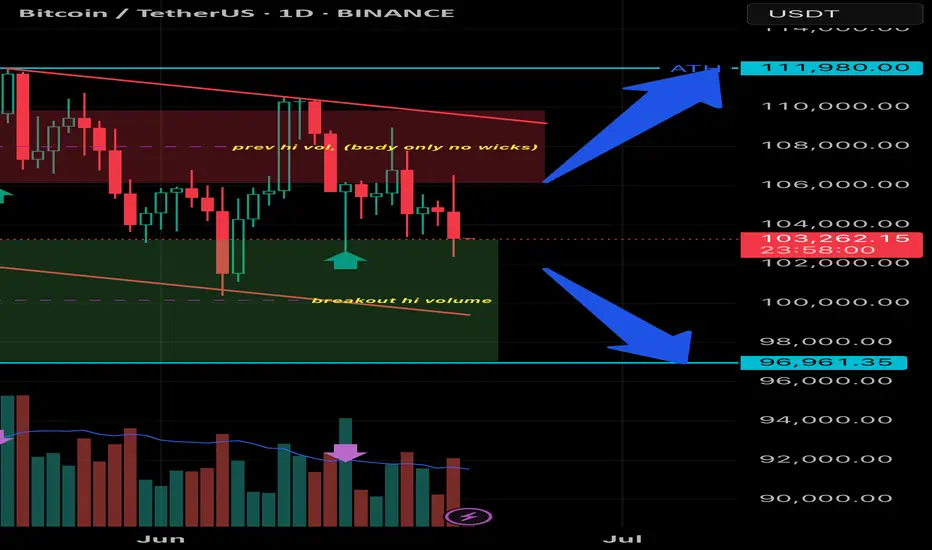
BTCUSD 1D | big consolidation
🧠 1. Pattern and Market Structure Identification
✅ Trend and Pattern: Bullish Flag
• Structure: Price forms a descending consolidation pattern (descending channel) after a sharp upward impulse — this is a classic characteristic of a bullish flag.
• Breakout volume occurred from the consolidation zone near the green support area → an early signal that bulls are active.
• However, the price is currently retesting the breakout area and is testing the demand zone again.
📊 2. Volume Analysis
• Volume spikes (purple arrows) occurred at several key points:
• Initial breakout
• Support retest
• High volume during the breakout = valid breakout confirmation.
• Currently, volume is slightly declining = a signal of consolidation and possible accumulation.
📉 3. Support & Resistance Levels
• Strong Support: 96,961 USDT (marked by the blue line and breakout volume).
• Major Resistance: 111,980 USDT (all-time high and projected target from the flag breakout).
• Current Price: 103,272 USDT → sitting between these two key levels.
🎯 4. Potential Price Direction
Bullish Scenario:
• If the 96,961 USDT support holds, price could continue upward → the bullish flag target = projected height of the flagpole.
• Conservative Target: 111,980 USDT (ATH)
• Aggressive Target (if ATH breakout occurs): 115,000+ USDT
Bearish Scenario:
• If price breaks below 96,961 USDT with strong volume, it could invalidate the bullish pattern and drop further to the 92,000 – 90,000 USDT range.
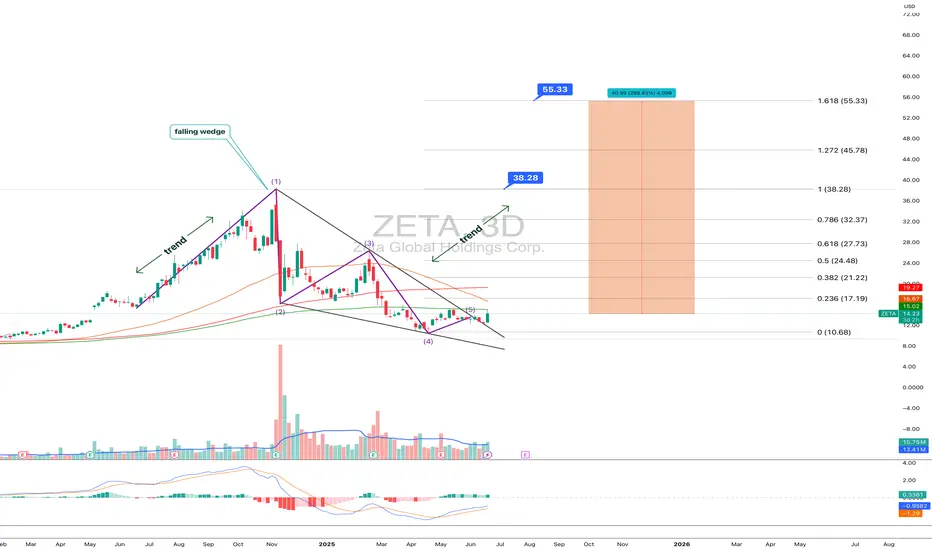
ZETA: when a wedge isn’t just a wedge — it’s a launchpadTechnically, this setup is textbook clean. Price completed the fifth wave within a falling wedge and instantly reacted with a bullish breakout. The expected breakdown didn’t happen — instead, buyers stepped in, confirmed by rising volume. All EMAs are compressed at the bottom of the structure, signaling a clear shift in momentum. The volume profile shows strong accumulation around $14, while the area above current levels is a vacuum — ideal conditions for acceleration.
The key resistance zone is $16.70–17.20 — former base highs and the 0.236 Fibonacci retracement. If price breaks this area with volume, the next stop is likely $24.48 (0.5 Fibo). Classical wedge targets land at $38.28 and $55.33 (1.272 and 1.618 extensions). If a trending leg begins, it could move fast — because there’s simply no supply overhead.
Fundamentals:
ZETA isn’t a profitable company yet, but it shows consistent revenue growth and aggressive expansion. Capitalization is rising, debt is manageable, and institutional interest has increased over recent quarters. In an environment where tech and AI are regaining momentum, ZETA could be a speculative second-tier breakout candidate.
Tactical plan:
— Entry: market or after a retest of $14.00–14.30
— First target: $17.20
— Main target: $24.48
— Continuation: $38.28+
— Stop: below $13.00 (bottom wedge boundary)
When the market prints a wedge like this and the crowd ignores it — that’s often the best trap setup. Only this time, it’s not for retail buyers. It’s for the shorts. Because when a falling wedge breaks to the upside with volume — it’s time to buckle up.
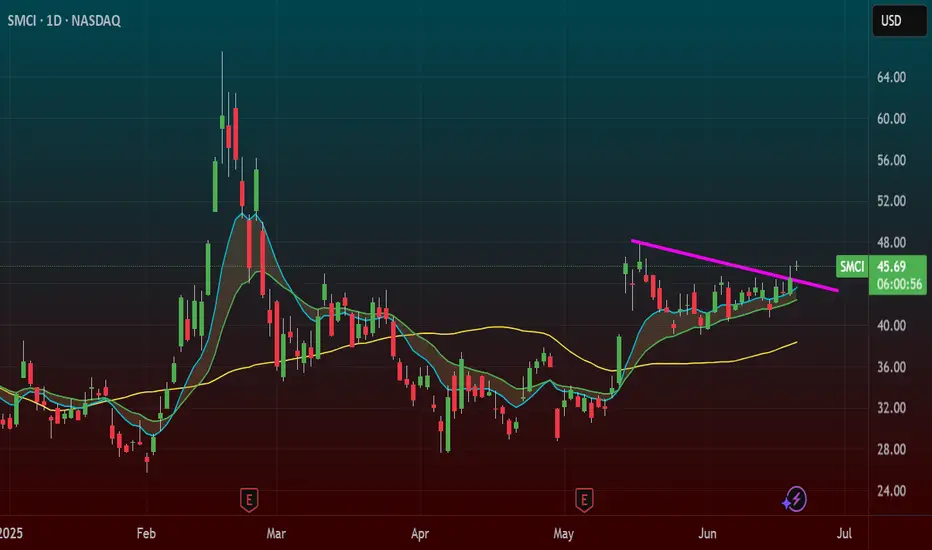
SMCI – Wedge Breakout Triggering Around 46 ZoneNASDAQ:SMCI – Wedge Breakout Watch with Intraday Setup Potential
Super Micro Computer ( NASDAQ:SMCI ) is working on a wedge breakout, and it's pressing right into the key $46 zone — the trigger area for a clean move higher.
🔹 Wedge Structure Clearing
Price has been compressing into a wedge, and it's now testing the upper trendline.
The $46 level is the key breakout point — if it clears and holds, this could unleash serious momentum.
🔹 Intraday Setup Developing
If NASDAQ:SMCI can hold this level intraday and consolidate, I’m watching for an entry signal right at or slightly above $46.
Volume confirmation will be key here — watching the tape closely.
🔹 My Trade Plan:
1️⃣ Entry: Watching for clean hold + setup at $46 zone.
2️⃣ Stop: Below yesterday’s low — keeps the trade tight and risk defined.
3️⃣ Add: If it breaks $46 with volume, I’ll build into the position.
Why I Like This Setup:
Breakout from compression = potential expansion
Clear risk level, clean structure — everything I want in a breakout trade
If it holds this level today, this could turn into a trend day.
BIG PUMP ON GRASS COIN THAT NOONE TALKS ABOUTGRASS is setting up for a major reversal from this falling wedge structure. After a prolonged downtrend, price has now reached the apex of a well-defined descending wedge, supported by a key ascending trendline. This area is shaping up as a high-probability buy zone.
On the chart, we can see price respecting both wedge boundaries and now reacting to the lower support line. This is a classic setup where breakout potential increases significantly. The compression of price action inside the wedge suggests a strong move is imminent.
Looking at Market Cipher B, momentum is showing a clear bullish divergence. Multiple green dots have printed on the oscillator, and money flow, while still negative, is beginning to curve upward. These are early signs that sellers are losing control and buyers are stepping in with strength.
Volume has also dried up on this last leg down, which is typical in wedge structures before a breakout. Low volume near support and divergence on a trusted indicator often marks the beginning of a trend reversal.
From a risk-reward perspective, this setup offers a strong opportunity. A break above the descending resistance could propel price toward the previous key resistance levels around the $3.40 zone. Always place your take profit just below major levels to ensure execution.
Leave your thoughts in the comments. Are you long here or waiting for confirmation? This is not a trade setup, no stop-loss or take-profit is shared publicly. Trade with discipline and confidence.

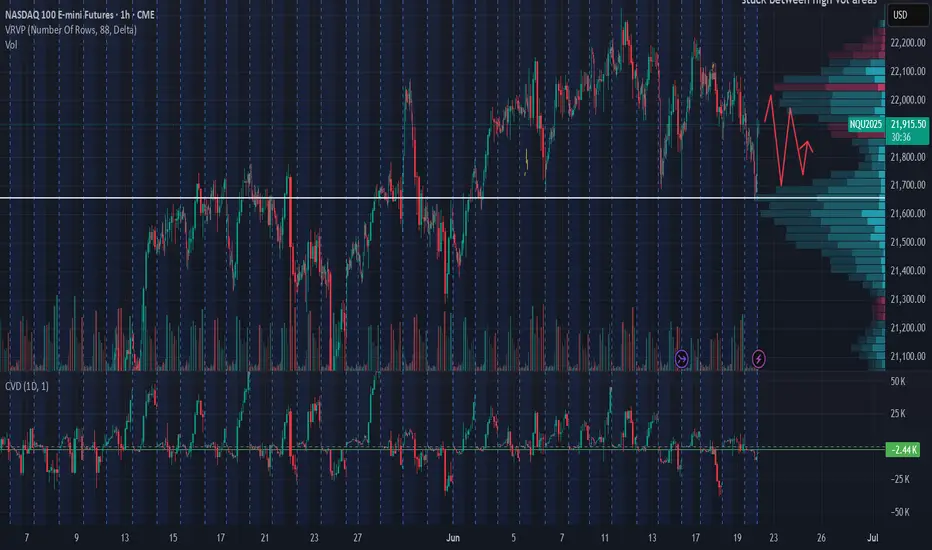
High volume nodesprice bouncing between until we will see a push out of value to a new level, high or low, we will see
XAU/USD (Gold) – Educational Chart Breakdown [1H Timeframe]We’re currently observing a consolidation phase just below a well-tested resistance zone (~$3,377), while price remains supported by an ascending trendline — a classic setup where structure tightens before a significant move.
Two Potential Outcomes:
Bullish Case
If price closes convincingly above $3,378 with strong volume, we may see a continuation toward the $3,400–$3,410 zone. This would confirm the resistance break and shift market structure bullish on the 1H chart.
Bearish Case
Failure to break above resistance may lead to a reversal and a drop into the $3,345–$3,355 demand zone — especially if price loses the ascending trendline. This would reflect a liquidity sweep and continuation of the larger corrective move.
Patience is key — wait for confirmation before taking action. Consolidation often precedes expansion.
