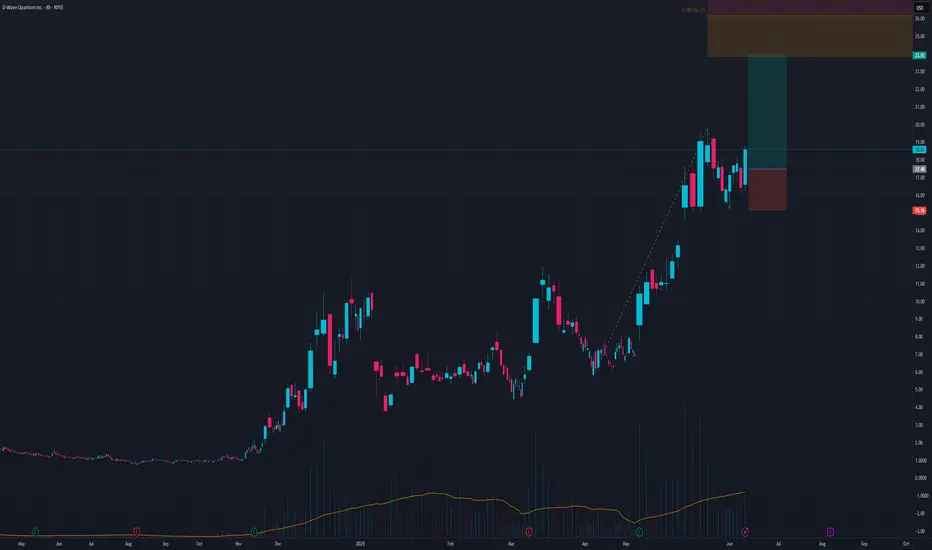
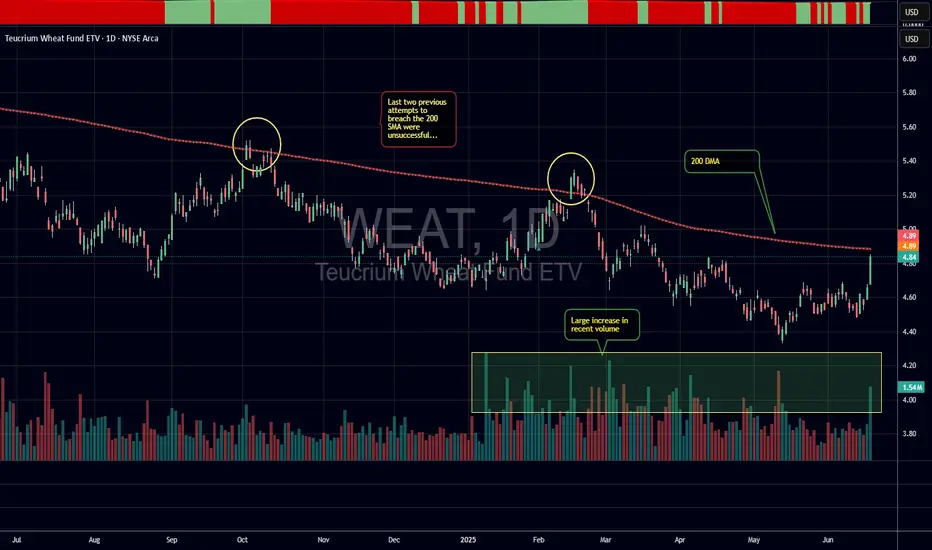
WEAT on the move?Wheat futures (ZW) have cleared a zone of resistance with a 4.6% one day move. As tracked by the WEAT ETF, current price seems to be heading for a retest of the 200 Daily SMA (currently at $4.90). The 200 Daily SMA has reversed previous attempts to break out in October 2024 and February 2025. Will third time be different?
Note that this ETF reached a high over $12 in 2022 when the Russian/Ukrainian war started.
Volume
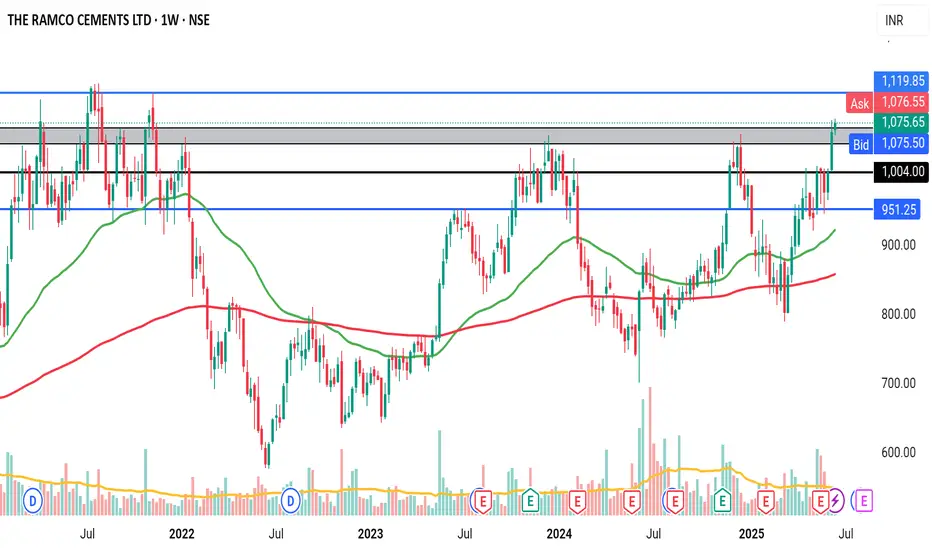
ASAHIINDIAASAHIINDIA has given symmetrical triangle breakout with unusual volume. Already took a momentum. Now as long as it is above upper channel line, i believe the momentum will continue till 980-1000 levels. Keep it on radar.

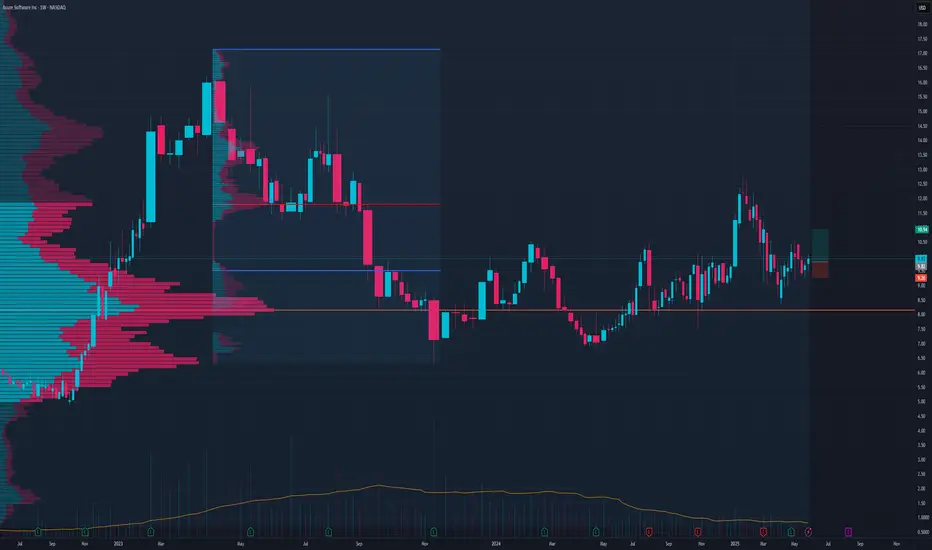
ASUR LongThis sector is bullish at the moment
Entry below 10$ at market open is preferred
TP 30%-65% at 1/2 Risk to reward and leave partial open
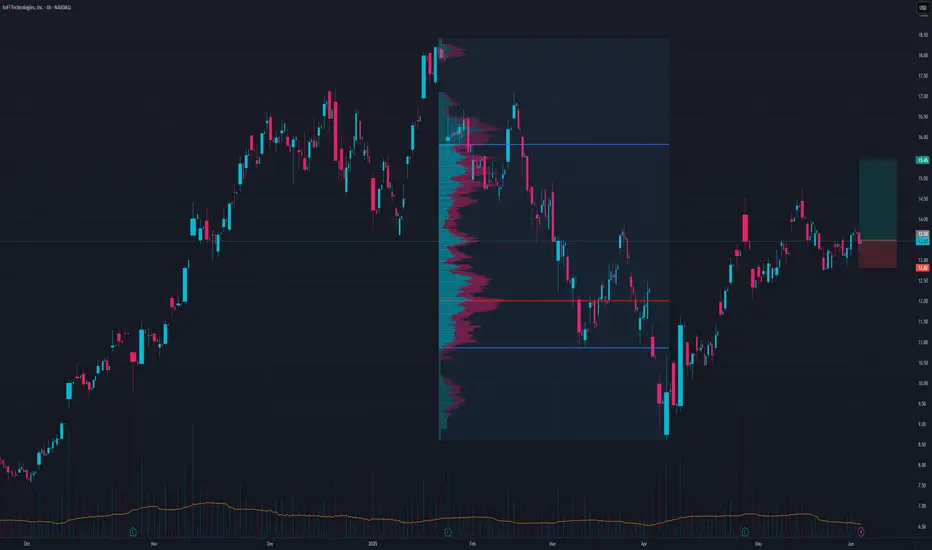
SOFI Long TradePreferred entry here or lower on market open
TP1 14.85
TP2 15.45
Feel free to let partial open after
Mixed Signals On GoldIt’s been a while since I’ve posted an idea and for anyone who follows my posts, unfortunately I timed my trades poorly with the bearish pivot so I have taken a step back, and am now seeing some interesting developments happening in the market.
For now, I’ll keep it brief. I wanted to post a quick analysis on TVC:GOLD ahead of the rate decision using elements of the Wyckoff method and Elliott Wave. If you asked me a month ago where I thought Gold was heading, I would have said ATH - and while that can still happen, I’m seeing weakness on today’s chart that is worthy of attention.
For starters, The A wave established the pullback in a typical 3-wave pattern that mostly stayed within the channel. The bullish breakout was tested twice, so I would interpret it as bullish - however the subsequent flat movement and rejection at resistance suggests that the rise from May 14th could be losing steam.
The current price ($3,382) is at a neutral level. From here, we could see several scenarios play out; a false bullish breakout, a true bullish breakout, or a break below the channel to retest demand. Breaking out of the channel could signal a Change of Character (CHoCH), and could indicate that smart money is distributing in a flat pattern. If the price breaks down key level of support would be at the Sign of Weakness (SOW), which has confluence with the extended lines of the Wave A channel.
If Gold is set to rise to ATH, I still think it will need to pull back to find large buying volume in the middle of the Wyckoff channel (white rays) first. We will see what happens today, but it’s starting to look like the bears may have the upper hand here.

How to Find Day Trading Momentum Plays...In this video I show the screener I use in order to find my momentum day trading setup. If you have any questions feel free to ask. Hope you enjoy!!

Imbalance, FVG & Short Trend Flag Strategy / Estrategia basada..*************************
* ENGLISH VERSION *
*************************
This analysis blends institutional structure with price action to identify high-probability zones on AMZN.
🔍 Setup Structure:
Imbalance breaks PH/L of the trend: Confirmation of institutional strength breaking a Previous High or Low, creating a liquidity imbalance.
Short Trend Flags: A corrective flag pattern within the impulse move, signaling continuation until the Fair Value Gap (FVG) is filled.
FVG Closure: Validates key zones where price must return to restore market balance.
IFVG: Institutional Fair Value Gap that also needs to be closed, showing deeper order flow activity.
Key Resistance & Support Zones: Act as liquidity magnets where price often reacts.
9:30am Opening Candle Against the Trend: This candle acts as a liquidity trap and potential reversal trigger.
🧠 Technical Notes:
FVG and IFVG used as targets and reaction zones.
Confirmation through opening volume and candlestick behavior.
Flags serve as entry triggers in trend direction.
🎯 Perfect for scalpers and day traders who trade clean structure with multi-layered confirmations (structure + liquidity + reaction).
*************************
* SPANISH VERSION *
*************************
Este análisis combina estructuras institucionales con acción del precio para identificar zonas de alta probabilidad en AMZN.
🔍 Estructura del Setup:
Imbalance rompe PH/L de la tendencia: Confirmación de fuerza institucional al romper un Previous High/Low, generando desequilibrio de liquidez.
Short Trend Flags: Patrón correctivo dentro del impulso que sirve como señal de continuación hasta cerrar el FVG (Fair Value Gap).
Cierre de FVG: Validación de zonas de interés donde el precio debe retornar para balancear el mercado.
IFVG: Imbalance Fair Value Gap que también necesita ser cerrado, indicando profundidad institucional.
Zonas clave de resistencia y soporte: Actúan como imanes de liquidez donde el precio suele reaccionar.
Apertura 9:30am contra la tendencia: Vela que actúa como trampa de liquidez y posible gatillo para reversión.
🧠 Notas Técnicas:
Uso de FVG y IFVG como targets y zonas de reacción.
Confirmación con el volumen de apertura y comportamiento de las velas.
Flags como patrón de entrada para seguir la dirección dominante.
🎯 Ideal para scalpers y day traders que siguen estructuras limpias con validaciones múltiples (estructura + liquidez + reacción).

EURUSD LONGPrice swept below support around 1.1473, grabbing liquidity and quickly bouncing back — this is a classic Wyckoff spring setup.
📌 Key Levels
Entry: Around 1.1500
Stop Loss: Below 1.1424 (spring low)
Target 1: 1.1567 (range high)
Target 2: 1.1614 (measured move)
🔍 Why I like this setup:
Fake breakdown (spring) and quick recovery
Buyers showed up right after the sweep
Expecting price to return to the top of the range and possibly break higher . This a trade we hold
💡 A spring is where smart money steps in after trapping sellers — I'm following them.
“I always say that you could publish my rules in the newspaper and no one would follow them. The key is consistency and discipline.”

BTCUSDT. Initiative Analysis Market OverviewHey traders and investors!
📍 Context
On the daily and 4H timeframes, the market is in a sideways range (Black lines = range boundaries).
Buyer initiative is active on 4H. The target initiative is 108,952.
However, on the daily timeframe, the seller initiative is in control, and a seller zone has formed. The seller zone is the red rectangle on the chart.
📊 Key actions
The buyer attempted to break out of the range on the daily timeframe twice, but both times the seller pushed the price back inside.
The price is currently interacting with the seller zone. Watching for the reaction.
🎯 Trade Idea
🔸 Long positions — with caution. Only valid if the price holds above 105,336, aiming for the target at 108,952.
🔸 Until that happens, the priority is on further downside, in line with the current seller initiative on the daily. It’s reasonable to look for short setups if the seller defends 105,336.
This analysis is based on the Initiative Analysis concept (IA).
Wishing you profitable trades!

6e signal for futures traderwe see 6E take lequidity 1/3RR
If you want see more signal, just add a comment

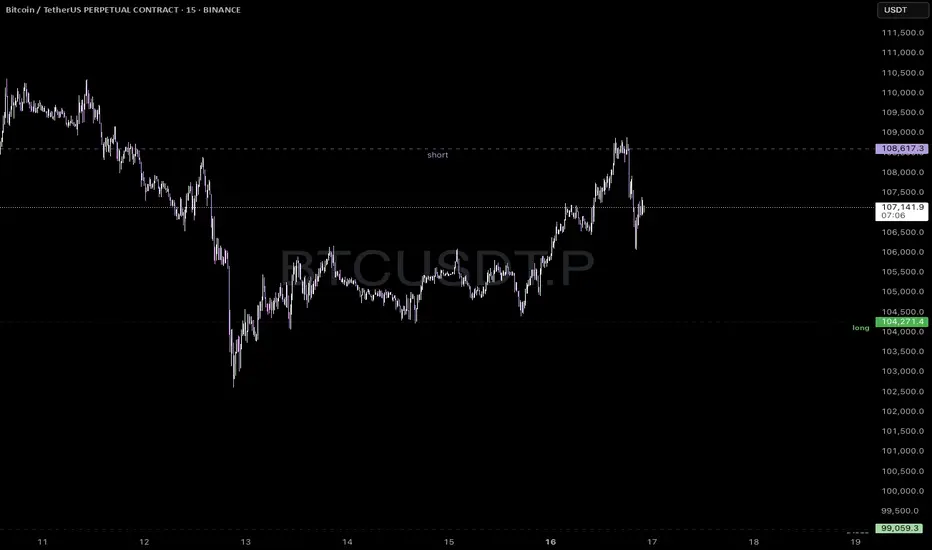
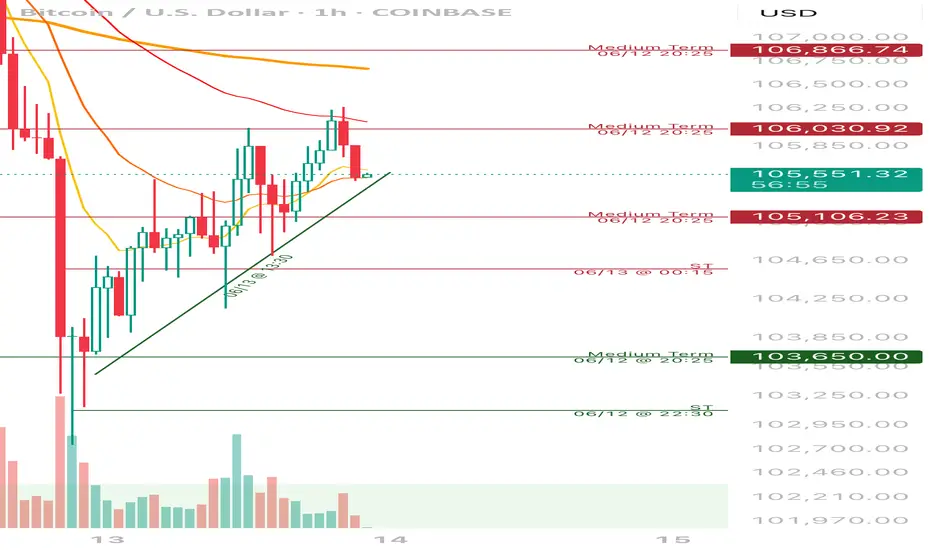
BTCUSDT ShortSet-up: Fade breakouts inside 2‑day 1 % VWAP band
Entry: $107 k‑$107.5 k
Stop: 0.5% -> 108k
Target: Re‑enter VWAP mean $105.5 k
R:R: 3:1
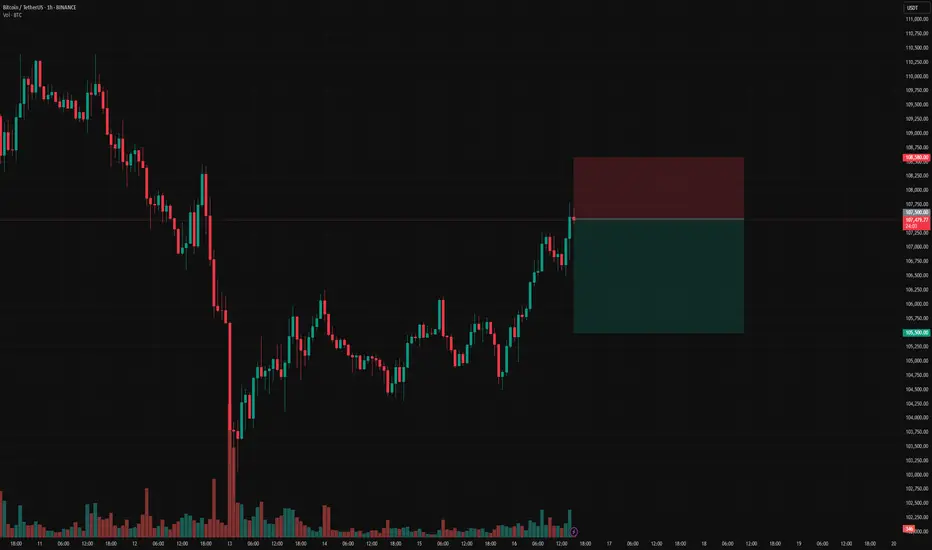
BTCUSD – Range Scalping Zones IdentifiedPrice tapped into a previous short zone near 108.6 and showed rejection. We’re watching for downside follow-through toward the 104.2 to 104.5 range where a potential long opportunity may form.
This chart outlines clean range-based levels for scalping. These zones line up with prior liquidity sweeps and local structure shifts. Scalpers can look to react at these levels depending on how price behaves when we get there.
Ideal for traders on lower timeframes like the 15m, but the concept applies across intraday setups. Always wait for confirmation before entering.
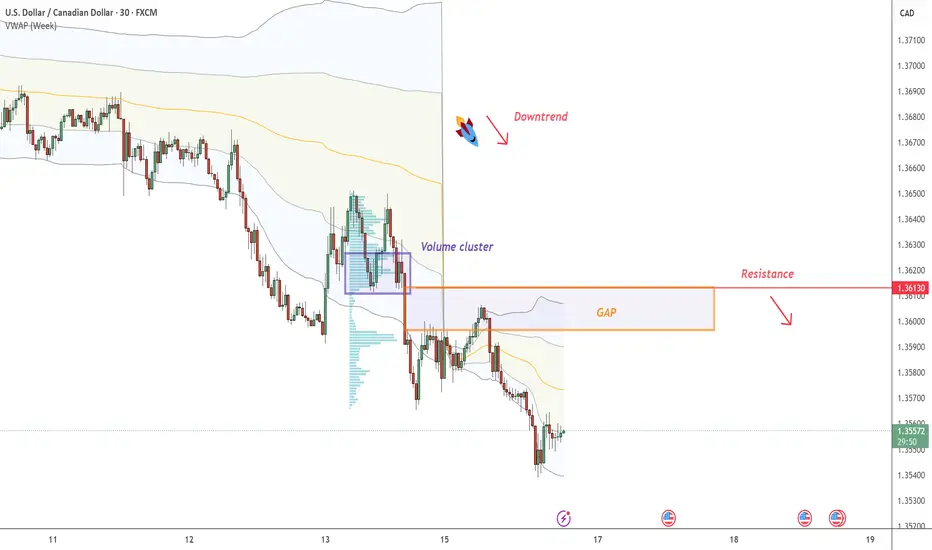
USD/CAD - Fair Value GAP On USD/CAD , it's nice to see a strong sell-off from the price of 1.36130. It's also encouraging to observe a strong volume area where a lot of contracts are accumulated.
I believe that sellers from this area will defend their short positions. When the price returns to this area, strong sellers will push the market down again.
Fair Value GAP (FVG) and Volume cluster are the main reasons for my decision to go short on this trade.
Happy trading,
Dale
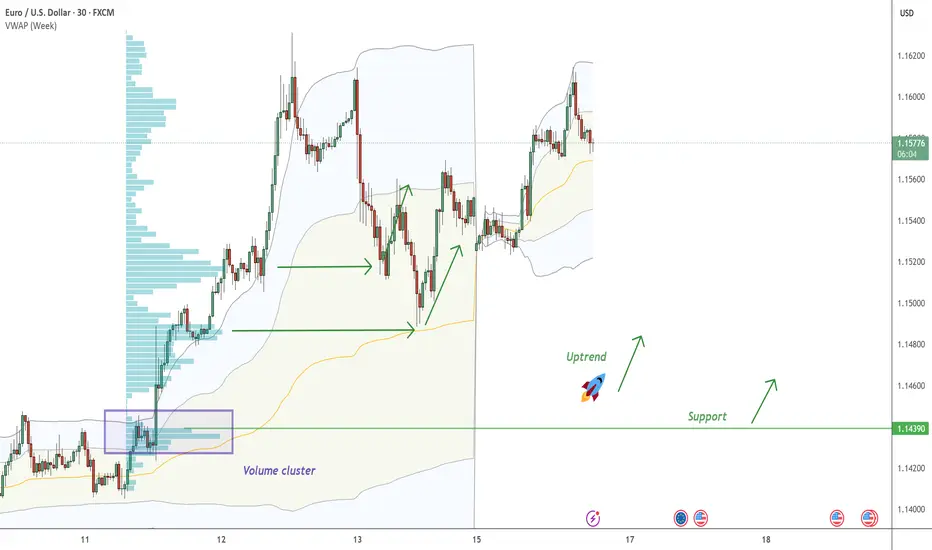
EUR/USD - continue with the UptrendOn EUR/USD , it's nice to see a strong buying reaction at the price of 1.14390.
There's a significant accumulation of contracts in this area, indicating strong buyer interest. I believe that buyers who entered at this level will defend their long positions. If the price returns to this area, strong buyers will likely push the market up again.
Uptrend and high volume cluster are the main reasons for my decision to go long on this trade.
Happy trading
Dale
Bulls entering cementClear breakout, crossed 50EMA, crossed strong resistance with good volume and big green candle. Has potential to break ATH.
MES Long - HVN, RejectionMES long trade idea.
Price went down after heat up of middle east conflict between Iran and Israel.
Rallied slowly afterwards for the whole day and created a HVN near the bottom.
I can think of a revisit of that area and a bounce to the upside.
Since the conflict is heating up further my risk will be reduced, and depending on the market open and a possible gap the idea might be invalid.

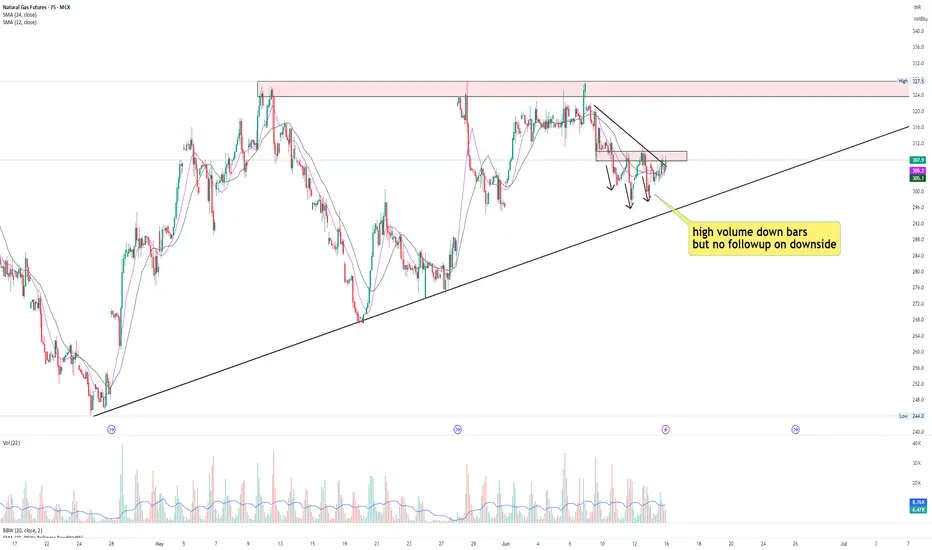
Naturalgas long tradeNaturalgas is resisting downside movement as witnessed on chart.
If you see the downward movement of Naturalgas, it is with relatively high volume but it is not coming down as expected from sellers and bouncing back up again as seen 3 times.
Now naturalgas has reached short term resistance zone of 307-310 from which it took support on 9th June, broke it on 10th June, took resistance on 11th and 12th June.
This might be a Change of Character zone for Naturalgas.
And now that Naturalgas is resisting downward movement, we might see breakout of this zone and probable upside movement.
Lastly it is also forming Ascending triangle which is still premature but just for reader's consideration.
Let's watch it on coming days.
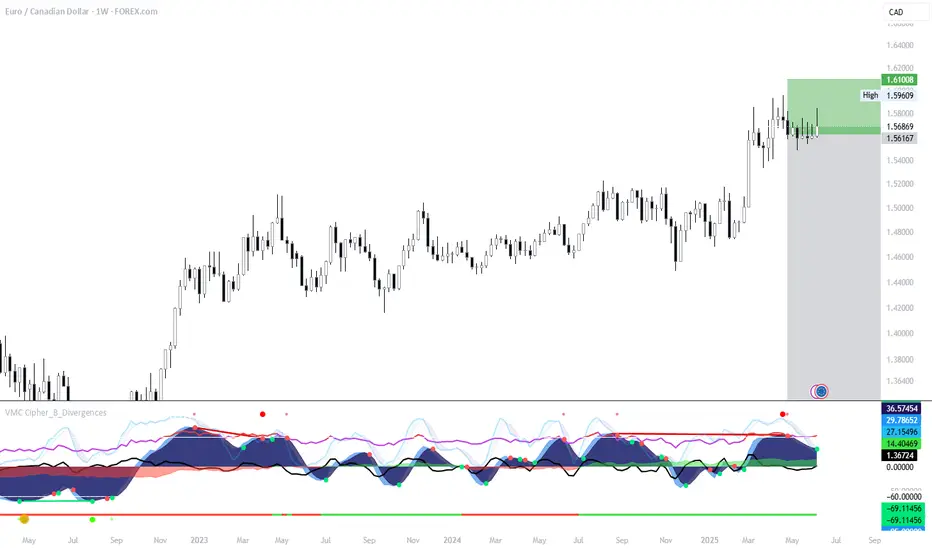
EUR/CAD Weekly Short Setup – Bearish Reversal Play
Initiated a short position on EUR/CAD from a key resistance zone after a significant upward move showing signs of exhaustion.
🔻 Entry: ~1.5689
🔻 Stop Loss: 1.6100 (Approx. 3.10%)
🎯 Take Profit: 1.3390 (Approx. 14.67%)
⚖️ Risk/Reward Ratio: 4.73
Price is reacting to a weekly supply zone with multiple confluences, including weakening bullish momentum on the VMC Cipher B indicator. The divergence signals a potential top, supporting a bearish outlook.
Looking for a move back to the lower range of the broader consolidation. Patience is key on this swing setup.
#EURCAD #ForexShort #SwingTrade #TechnicalAnalysis #RiskReward #TradingView
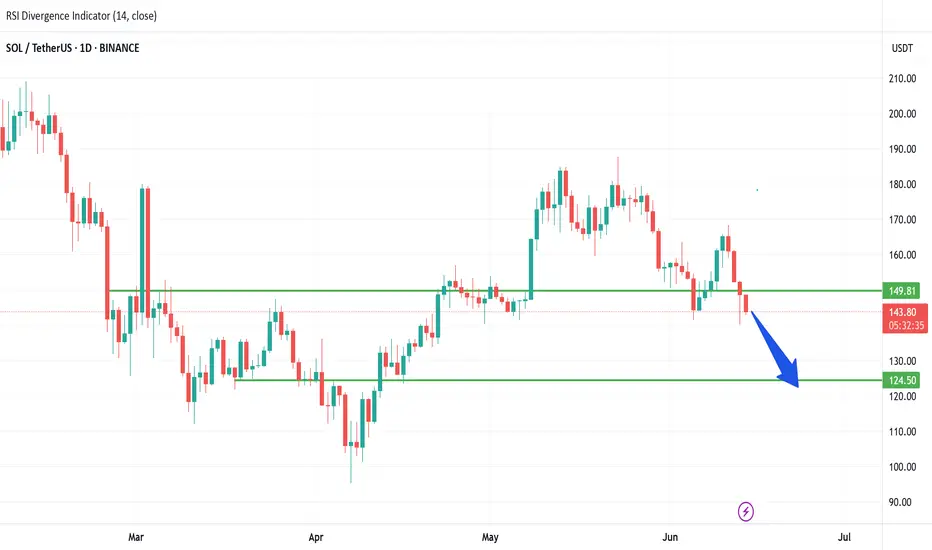
War Shakes Markets: SOL Dips Below Key Support — What’s Next?Solana (SOL) bulls are sweating. After a rough 3% daily drop, SOL has decisively broken below the critical $149–$150 support zone, with price currently hovering around $144. A powerful rejection from the $160 level last week now appears to be more than just a dip—it’s starting to resemble a trend reversal.
But that’s not all. There’s a geopolitical tremor behind the technicals.
Macro Heat: Israel–Iran Conflict Sends Shockwaves
Global markets are rattled after Israel’s latest strike on Iranian military facilities, prompting a missile-heavy retaliation from Tehran. As investors flee risk assets, the “war premium” is being priced into everything—from oil and gold to crypto.
This risk-off sentiment is putting extra pressure on altcoins like SOL, especially those already at key technical inflection points.
The Chart in Focus
Here’s the real-time breakdown:
Price Action: SOL has closed below the $149.81 support (a previous consolidation base). That zone is now likely to flip into resistance.
Volume: 24H volume remains elevated (273M+), suggesting sellers are still active—not just a low-liquidity dip.
RSI: The RSI is sitting at 37.99, creeping toward oversold territory but not there yet—leaving room for further downside.
Next Target: If momentum continues, all eyes are on the $124.50 level — a well-tested demand zone and potential bounce point.
The blue arrow on the chart isn’t just aesthetic—it’s a warning.
What to Watch Next
A daily close below $142 would solidify the breakdown and make a drop to the $124–$125 range highly probable.
However, if SOL reclaims $149 with strong volume, it could trap bears and launch a relief rally.
Keep an eye on macro headlines. If the Israel–Iran conflict escalates, expect more risk-off moves across the cryptocurrency market. Solana, like most altcoins, doesn't thrive in global uncertainty.
Conclusion:
The break below $149 isn’t just technical—it’s emotional. As fear grips markets globally, SOL is caught in the crossfire. Risk management matters now more than ever.
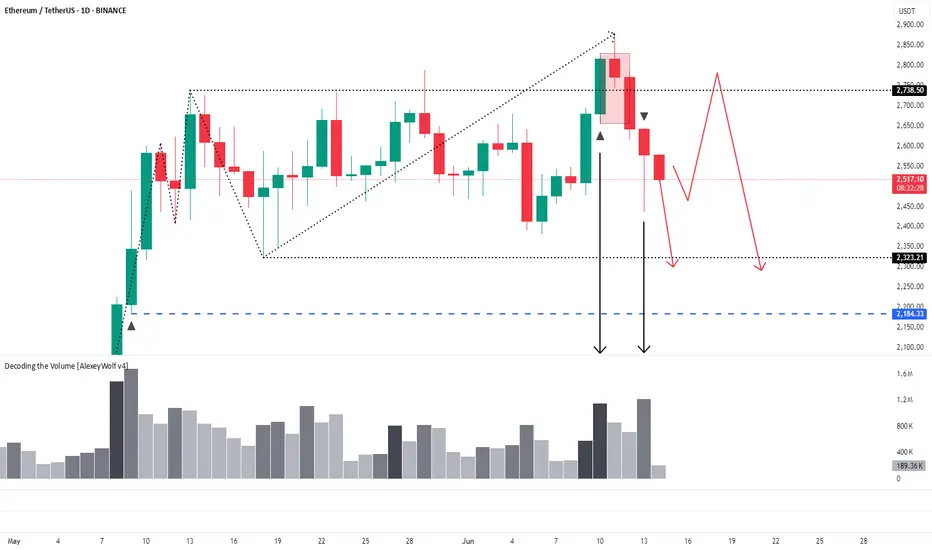
Ethereum. Daily Timeframe. Seller initiativeHey traders and investors!
📍 Context
• Market phase: Sideways range
• Current control: Seller initiative
📊 Key Price Action:
The price broke above the upper boundary of the range (2738) with a buyer KC candle, touching the 50% retracement level (2874) of the last weekly seller initiative (1).
However, the seller absorbed the buyer’s candle and pushed the price back inside the range (2), forming an IKC candle (3) — the highest volume candle within the seller’s initiative.
This sequence presents three bearish signals that support a potential continuation to the downside.
🎯 Trade Idea
Likely scenario: price tests the lower boundary of the range at 3,323.
🔸 In the meantime, it’s reasonable to look for short setups on lower timeframes within the current seller initiative.
🔸 If price reaches 3,323 and valid buyer patterns appear, this zone may offer a good opportunity for long entries.
This analysis is based on the Initiative Analysis concept (IA).
Wishing you profitable trades!
Range Bound Before BreakoutDaily: Nice hold on the reversal candle @50 EMA, 103k Support and strong FVG.
Nice volume to support this move when the drop was somewhat due to the attacks involving Israel and Iran.
-We are seeing a slightly lower high and a rejection from that 110 lvl. But as I said on the weekly, w/o a catalyst I think we’ll continue to bounce within the 100-110 range for a bit longer.
DEEPBOOK Spot Buy IdeaDEEP/USDT SPOT - 1D - BYBIT
Current Price: 0.14727 (Close)
24h Range: 0.13600 (Low) → 0.15582 (High)
Change: -5.47% (▼0.00853)
🔥 Extremely Bullish on DEEP!
Falling Wedge Pattern confirmed—breakout incoming!
If you’re not holding yet, consider buying at market price.
🎯 Targets:
First Target: $0.20 (Breakout confirmation)
Second Target: $0.25 (Mid-term resistance)
Final Target: $0.31 (Aggressive upside)
Follow me for more signals like this!