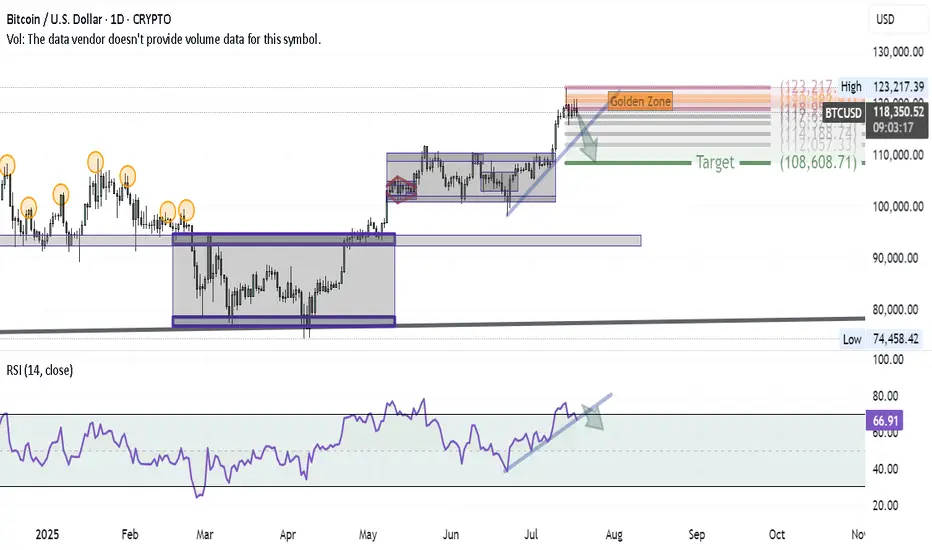
Bitcoin Correction Unfolding — First Wave in MotionAfter successfully hitting the BITCOIN target and anticipating a major correction in my previous ideas, here’s how the first wave of that correction is shaping up on the daily chart:
1- At the recent high, a Shooting Star candle formed — a classic reversal signal.
2- Using Volunacci analysis, the price retraced exactly to the Golden Zone, validating the first leg of the pullback.
3- The next step? A breakdown of the blue trendline would likely send us toward the Volunacci target at $108,600.
4- For confirmation, we're watching the RSI trendline — if it breaks down as well, it would strongly support the bearish continuation.
The setup is clean and developing as expected — it's all about following price and letting the chart guide the story.
Volunacci
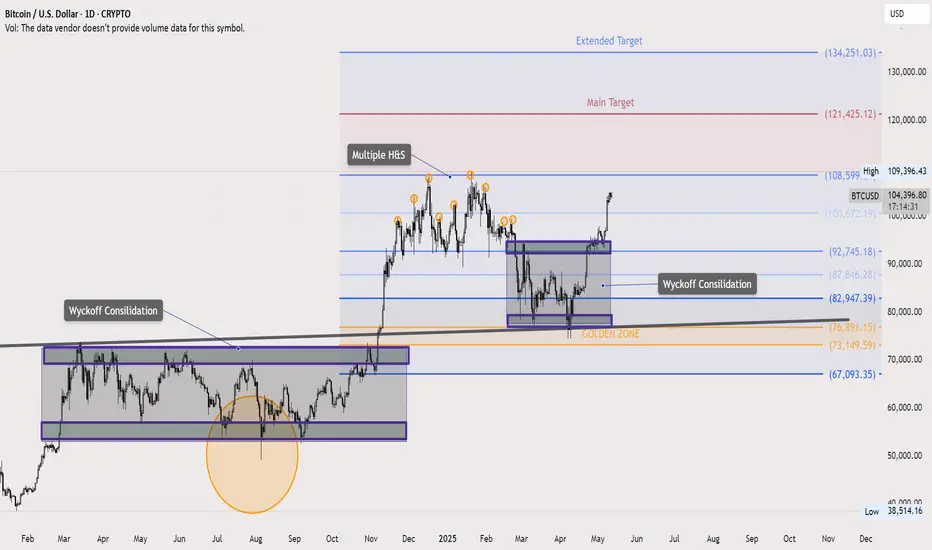
Bitcoin Update – Textbook Patterns Playing OutIn last week’s Bitcoin idea, I highlighted a key technical setup: price retested the neckline of a massive inverted Head & Shoulders pattern and launched a strong move upward. Let’s dive into what’s unfolding on the daily chart.
We’re seeing classic Wyckoff consolidation behavior—appearing right before the breakout and again after the neckline retest. Multiple smaller Head & Shoulders patterns have also formed and hit their targets cleanly.
The Volunacci pattern came alive after a precise bounce from the Golden Zone, adding more fuel to the bullish narrative.
Next major level in focus: $120K. Will Bitcoin reach it? Let the market decide.
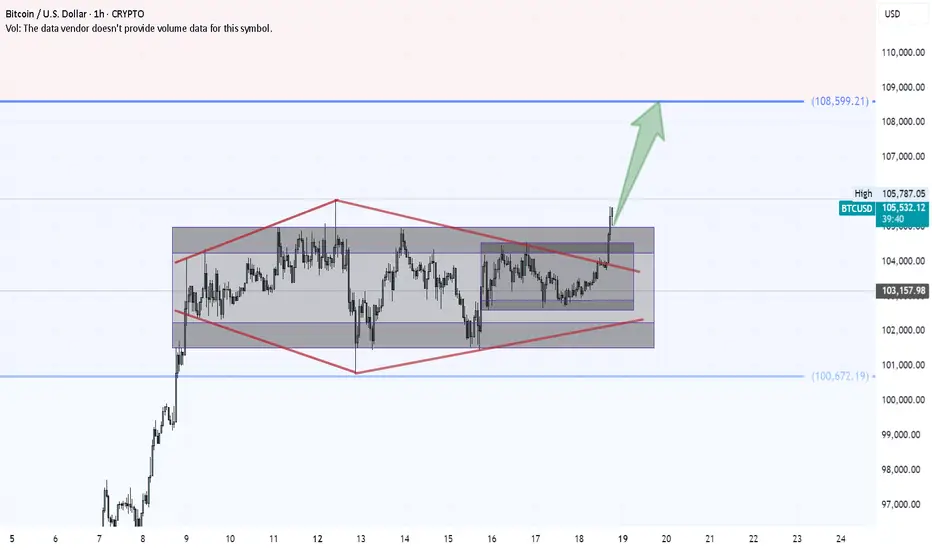
Bitcoin: Precision Breakout in MotionBitcoin is moving steadily toward its next major target—step by step.
A breakout from a rare double inside Wyckoff structure, confirmed by a diamond continuation pattern, has put the bulls back in control. The technical roadmap points us toward the next key level at $108,600.
Let's meet there!
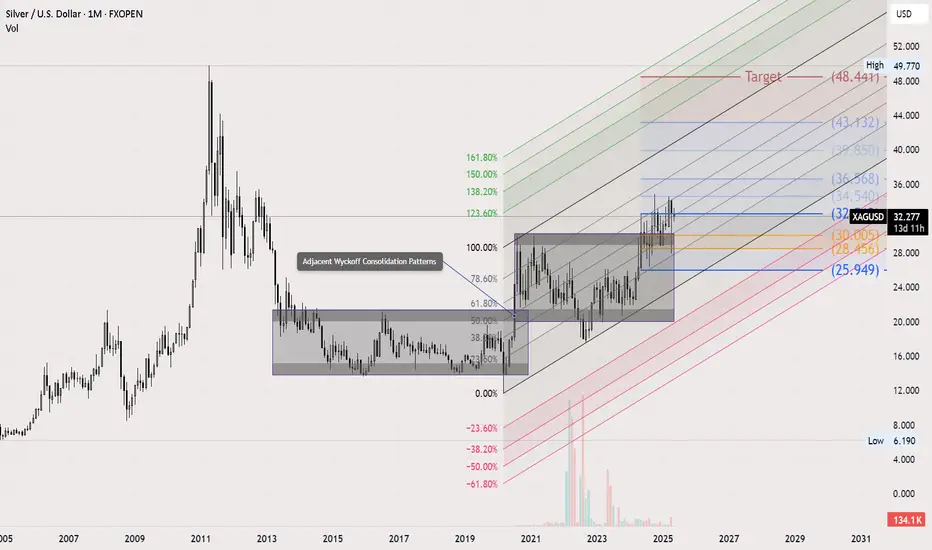
Silver Long-Term Outlook: Wyckoff, Fibonacci & Volunacci in PlayOn the monthly chart, Silver is showing a strong setup for long-term investors. We can clearly identify two adjacent Wyckoff accumulation patterns, signaling institutional accumulation phases.
Price action is following an ascending Fibonacci channel, reflecting a steady bullish structure. After breaking out of the second Wyckoff pattern, a Volunacci projection has formed—pointing toward a potential move to retest its historical high near $48.
This alignment of classic technical patterns with volume-based projection tools strengthens the long-term bullish case for Silver.