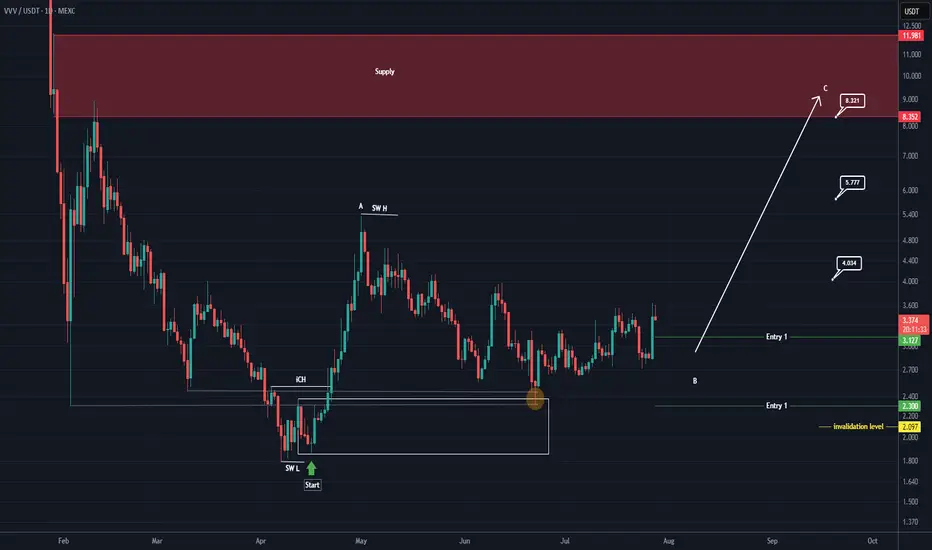
VVV Looks Bullish (1D)From the point where we placed the red arrow on the chart, it seems that the bullish phase VVV has begun.
This phase can be considered as an ABC structure.
We appear to be in the late stages of wave B.
We have identified two entry points to join the continuation of the bullish phase VVV. The likelihood of Entry 2 being reached is low, but you should split the volume you want to invest in this coin into two parts and keep some for Entry 2.
The targets are marked on the chart.
A daily candle closing below the invalidation level will invalidate this analysis.
For risk management, please don't forget stop loss and capital management
When we reach the first target, save some profit and then change the stop to entry
Comment if you have any questions
Thank You
VVVUSD
VVV Analysis (4H)A descending trendline has been broken, and we have a bullish CH on the chart.
In the support zone, we can look for buy/long positions up to the supply zone.
We also expect a downward reaction from the supply zone.
The closure of a 4-hour candle below the invalidation level will invalidate this outlook.
Do not enter the position without capital management and stop setting
Comment if you have any questions
thank you
