29.05.25 Morning ForecastPairs on Watch -
FX:AUDCAD
FX:EURUSD
TVC:USOIL
FX:GBPJPY
A short overview of the instruments I am looking at for today, multi-timeframe analysis down to what I will be looking at for an entry. Enjoy!
W-patterns

28.05.25 Morning ForecastPairs on Watch -
OANDA:AU200AUD
FX:GBPAUD
A short overview of the instruments I am looking at for today, multi-timeframe analysis down to what I will be looking at for an entry. Enjoy!

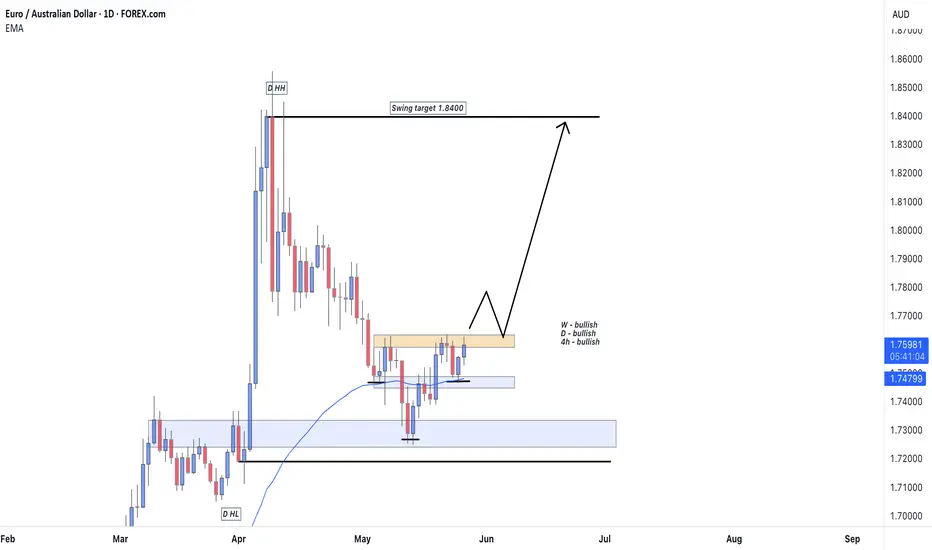
EURAUD Swing Trade (Long)After seeing price come into the premium of the daily structure and a strong level of daily support we are now seeing an inverted head and shoulders pattern, which can be seen on the daily and 4h timeframes.
If we see a daily candle break and close above the orange resistance zone (which is also the neckline of the inverted head and shoulders pattern) then i will be looking for price to come back to retest the neckline to target the daily HH (1.8400)
27.05.25 Morning ForecastPairs on Watch -
FOREXCOM:COFFEE
FX:GBPAUD
A short overview of the instruments I am looking at for today, multi-timeframe analysis down to what I will be looking at for an entry. Enjoy!

26.05.25 Morning ForecastPairs on Watch -
FOREXCOM:COFFEE
FX:GBPAUD
FX:EURAUD
A short overview of the instruments I am looking at for today, multi-timeframe analysis down to what I will be looking at for an entry. Enjoy!

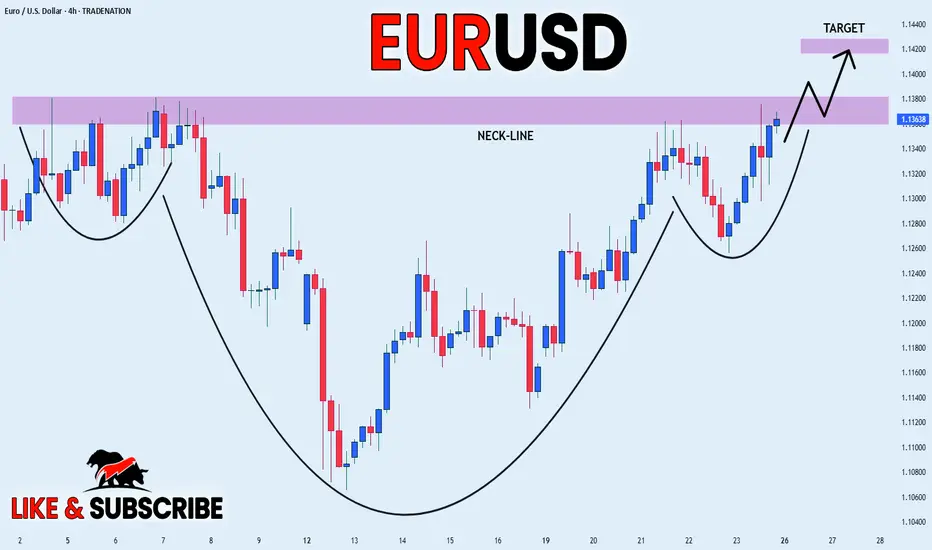
EUR_USD HEAD AND SHOULDERS|LONG|
✅EUR_USD has formed a
Head and Shoulders pattern
And the pair has now formed
The last leg of it, so we are
Bullish biased and IF we see
A bullish breakout of the
Neckline of 1.1380 next week
Then we will be expecting a
Further bullish move up
LONG🚀
✅Like and subscribe to never miss a new idea!✅
Disclosure: I am part of Trade Nation's Influencer program and receive a monthly fee for using their TradingView charts in my analysis.
23.05.25 Morning ForecastPairs on Watch -
FX:CADJPY
FX:AUDCAD
A short overview of the instruments I am looking at for today, multi-timeframe analysis down to what I will be looking at for an entry. Enjoy!

22.05.25 Morning ForecastPairs on Watch -
FX:EURUSD
FX:EURGBP
FX:GBPJPY
A short overview of the instruments I am looking at for today, multi-timeframe analysis down to what I will be looking at for an entry. Enjoy!

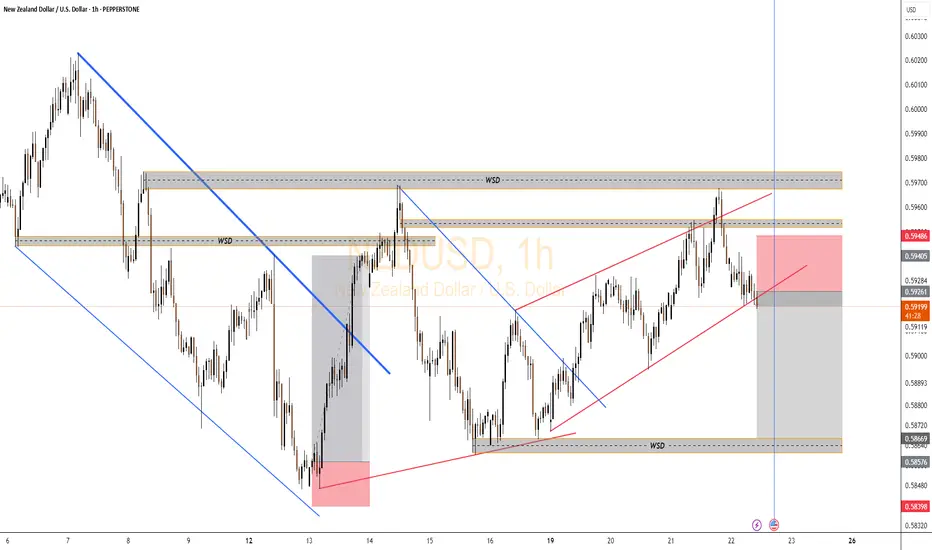
NZDUSD Bearish Setup🔍 Market Structure Analysis
WSD Zone Rejection (Top):
Price tapped a wick-based supply & demand (WSD) zone at the top around 0.59486.
That zone also aligns with the previous liquidity grab + mitigation of the OB.
Price is now rejecting that area — forming a lower high (LH) inside the zone → classic sign of distribution.
Rising Channel Break:
Price was rising inside the red ascending channel.
Currently showing bearish intent, with multiple internal BOS (breaks of structure).
If price closes below the channel, that confirms bearish expansion.
Downtrend from Premium Zone:
We're clearly in premium pricing, where institutions prefer to offload longs.
This area also completes a liquidity sweep of prior highs inside the WSD zone.
🧠 Trade Logic (Sell Setup)
🔺 Entry Zone: Inside or after rejection of WSD at 0.59486.
🛑 Stop Loss: Just above the WSD zone and local high.
🎯 Take Profits:
TP1: 0.58669 → Local support + lower WSD zone (reaction zone).
TP2: 0.58398 → Previous liquidity pool and external low.
🧾 R:R = Clean 1:4.5+, textbook SMC setup.
📌 Confluences for Bearish Bias
✅ Multiple WSD zones tested with bearish rejection.
✅ Rising channel inside premium is breaking.
✅ Mitigation + BOS on smaller TF.
✅ News candle marked by blue vertical line may act as final volatility spike before continuation.
✅ Price is near VWAP/50% equilibrium → Ideal for smart money to expand to downside.
🧯 Invalidation Conditions
❌ If price closes above 0.59486, we reassess the bias.
❌ A re-entry into the upper WSD with strong bullish volume invalidates the current bearish flow.
🔮 Forecast Summary
This is a classic distribution setup with liquidity engineered into a WSD zone, now showing early mitigation and markdown signs. Unless major manipulation occurs, expect price to expand toward the 0.58398 low in the next 24–48 hours.
21.05.25 Morning ForecastPairs on Watch -
FX:GBPAUD
FX:EURNZD
FX:GBPJPY
A short overview of the instruments I am looking at for today, multi-timeframe analysis down to what I will be looking at for an entry. Enjoy!

20.05.25 Morning ForecastPairs on Watch -
FOREXCOM:COFFEE
FX:EURUSD
FX:AUDJPY
A short overview of the instruments I am looking at for today, multi-timeframe analysis down to what I will be looking at for an entry. Enjoy!

19.05.25 Morning ForecastPairs on Watch -
FX:GBPJPY
FX:CADJPY
FOREXCOM:COFFEE
A short overview of the instruments I am looking at for today, multi-timeframe analysis down to what I will be looking at for an entry. Enjoy!

LUNC Bullish Inverted Head and Shoulders – Target Ahead!🚀 SEED_DONKEYDAN_MARKET_CAP:LUNC Bullish Inverted Head and Shoulders – Target Ahead! 📈
SEED_DONKEYDAN_MARKET_CAP:LUNC has formed a bullish inverted head and shoulders pattern. If confirmed, the first target could be the green line level! 📊
Let’s catch this breakout together! 💼💸

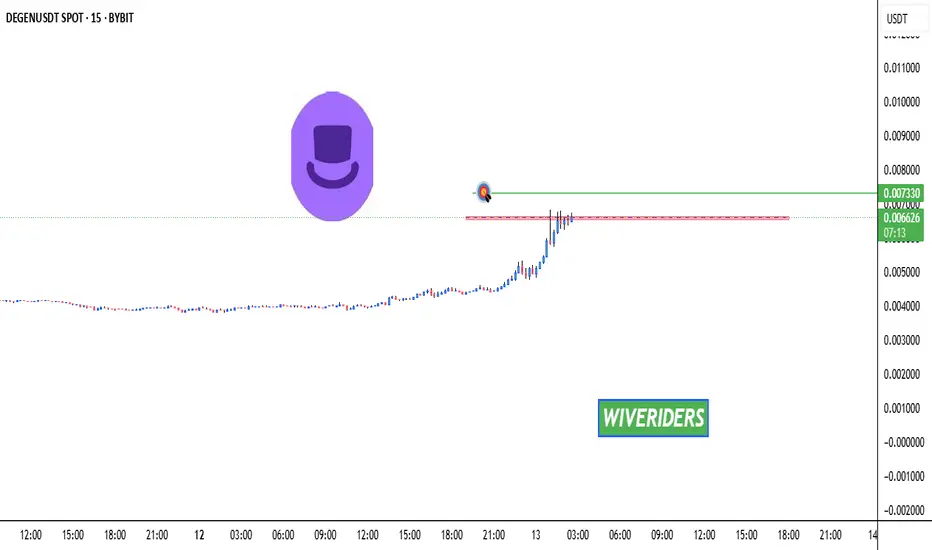
DEGEN Testing Red Resistance – Breakout Potential!🚀 DEGEN Testing Red Resistance – Breakout Potential! 📈
DEGEN has formed a red resistance zone, where we’re seeing some sellers stepping in. If the price breaks through, the trend could continue with the first target at the green line level! 📊
Let’s watch for that breakout together! 💼💸
CRV Head and Shoulders Pattern Formed – Breakout Confirmed🚨 CRV Head and Shoulders Pattern Formed – Breakout Confirmed 📉
CRV has formed a head and shoulders pattern and has already broken out of the neckline. This could signal the start of a potential downtrend, with further downside ahead. 📊
Let’s monitor this downtrend together! 💼💸

PENDLE Bearish Head and Shoulders – Potential Pullback at the Ne CRYPTOCAP:PENDLE Bearish Head and Shoulders – Potential Pullback at the Neckline 📉
CRYPTOCAP:PENDLE has formed a bearish head and shoulders pattern. We could see a potential pullback at the neckline before the price moves down to the green line level as the next target. 📊

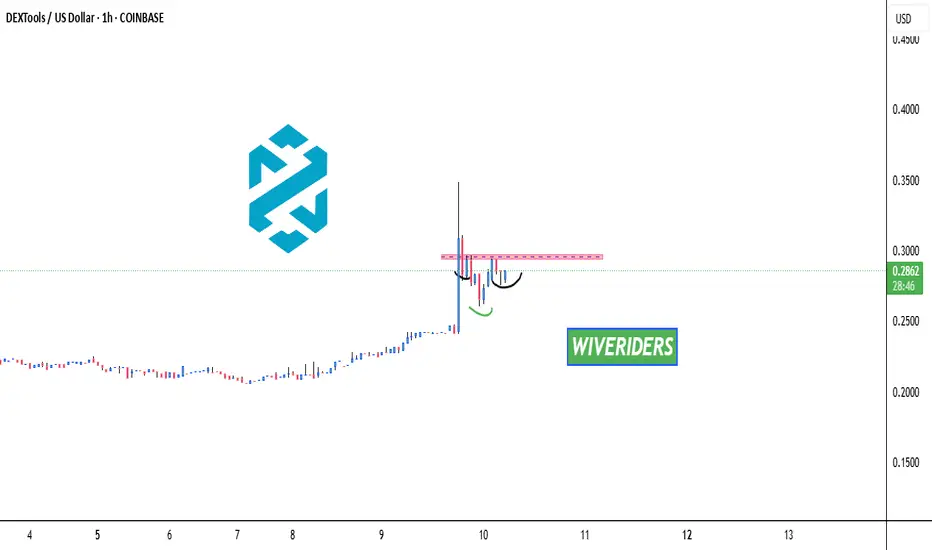
DEXT Potential Inverted Head and Shoulders – Bullish Setup! 🚀 $DEXT Potential Inverted Head and Shoulders – Bullish Setup! 📈
$DEXT is potentially forming an inverted head and shoulders pattern! 🧠 This bullish pattern could signal a strong move to the upside if confirmed. 📊
Let’s catch this breakout together! 💼💸
Bullish Cup with Handle🚀 SEED_ALEXDRAYM_SHORTINTEREST2:IO Forming Bullish Cup with Handle – Breakout Potential! 📈
SEED_ALEXDRAYM_SHORTINTEREST2:IO is forming a potential bullish cup with handle pattern! 🧠 If the price breaks the red resistance, the first target could be the green line level! 🔥
Let’s catch this breakout together! 💼💸

MANA Testing Red Resistance🚀 OTC:MANA Testing Red Resistance – Target Ahead! 📈
OTC:MANA is currently testing the red resistance zone. If the price breaks through, the target could be the green line level! 📊
Let’s watch this breakout together! 💼💸

09.05.25 Morning ForecastPairs on Watch -
FX:EURCAD
FX:USDCHF
FX:EURUSD
FOREXCOM:COFFEE
Heads up guys!! I will be heading to Greece today so next week my morning forecast videos may not be as consistent, due to internet and just not having my full equipment, so I will do my very best to get some forecasting posted for you all!
A short overview of the instruments I am looking at for today, multi-timeframe analysis down to what I will be looking at for an entry. Enjoy!

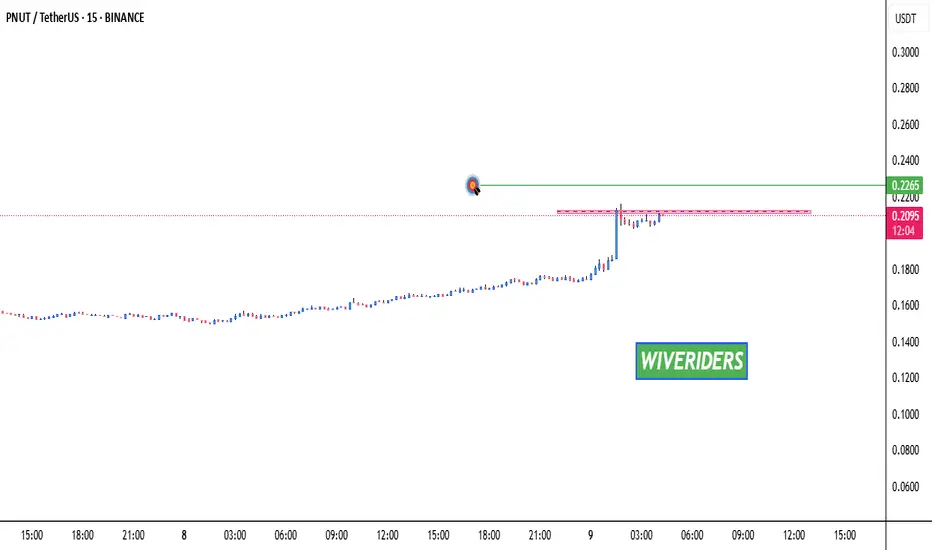
Testing Red Resistance – Breakout Potential!🚀 $PNUT Testing Red Resistance – Breakout Potential! 📈
$PNUT is currently testing the red resistance zone. If the price breaks through, the first target could be the green line level! 📊
Let’s catch this breakout together! 💼💸
08.05.25 Morning ForecastPairs on Watch -
FX:AUDCAD
FX:EURCAD
FX:USDCHF
FOREXCOM:COFFEE
A short overview of the instruments I am looking at for today, multi-timeframe analysis down to what I will be looking at for an entry. Enjoy!

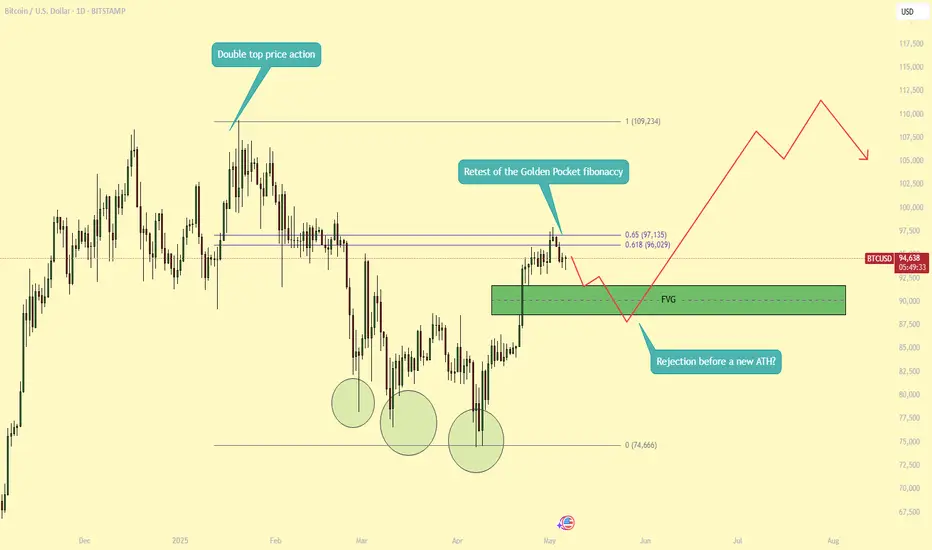
BTC - Will history repeat itself?In this description, I will compare the current price action of BTC with the market behavior seen in 2021. Both cycles share notable similarities in their structure.
-------------------------------
2021 bullmarket
During the 2021 bull market, BTC displayed classic topping price action. The chart showed slightly higher highs and higher lows, eventually forming a bearish Head & Shoulders pattern. This signaled a shift in momentum, and BTC subsequently broke down, confirming the bearish outlook.
At the lows later in 2021, Bitcoin’s price action became more corrective, with slightly lower lows and lower highs-often an early indication of a potential trend reversal. That reversal materialized as BTC launched into a strong impulse move to the upside, rallying all the way to the key Golden Pocket Fibonacci level before experiencing a modest retracement.
Following this healthy pullback, BTC gathered enough strength to break through resistance and surge to a new all-time high (ATH), which ultimately marked the peak of that bull cycle.
-------------------------------
This bullmarket
In the current bull market, BTC formed a classic double top pattern, echoing similar setups from previous cycles. After reaching highs near $110k BTC experienced a significant correction, dropping to around $74k. At this level, the price action turned corrective, with a series of slightly lower lows and lower highs-reminiscent of the consolidation seen at the 2021 market bottom.
During this consolidation, BTC established three notable lows, forming a potential base for a reversal. Following this corrective phase, BTC surged upward in a strong impulse move, reaching the critical Golden Pocket-the 61.8% to 65% Fibonacci retracement zone, which is widely regarded as a key area for potential reversals or continuation of trends.
Currently, BTC is consolidating near this Golden Pocket. Traders are watching closely to see if the price will face rejection here, as it did in 2021, or if it can break above and sustain a new uptrend. The outcome at this level will likely determine whether the next major move is a continuation to new highs or a deeper retracement.
-------------------------------
Conclusion
When comparing the corrections following the 2021 and 2025 peaks, the similarities are striking. Both cycles feature a bottom formed through a similar pattern, followed by a strong move up to the Golden Pocket Fibonacci level. The key question now is whether BTC will experience another corrective pullback before making a renewed attempt at the all-time high, or if it will break through resistance and continue its upward momentum. Only time will tell which path the market will choose.
-------------------------------
Thanks for your support.
- Make sure to follow me so you don't miss out on the next analysis!
- Drop a like and leave a comment!