S&P 500 Daily Chart Analysis For Week of August 22, 2025Technical Analysis and Outlook:
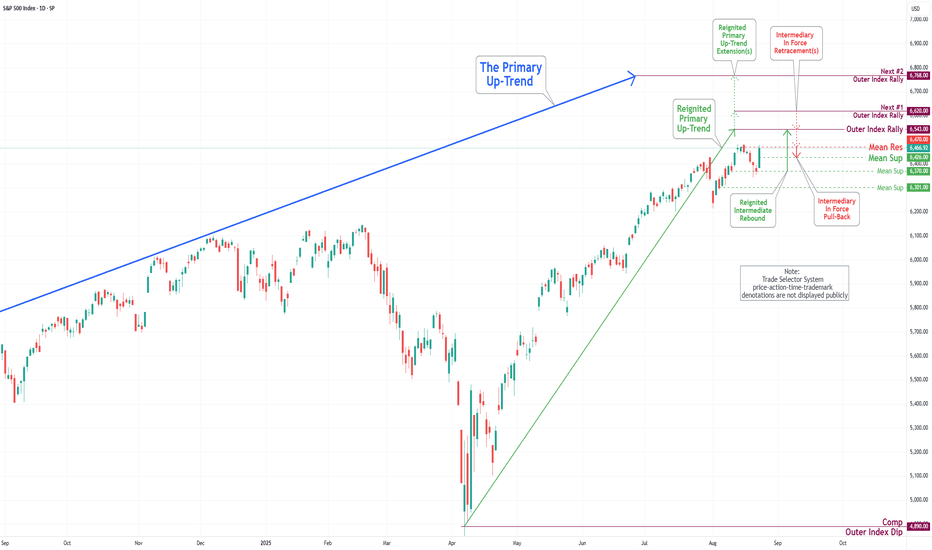
During the trading activity of the previous week, the S&P 500 Index experienced significant volatility before reestablishing its strong bullish trend. Initially, the Index faced a substantial decline, reaching our designated target of Mean Support at 6370. Subsequently, it rebounded vigorously, attaining our target of Mean Resistance at 6470, and is currently aiming for the Outer Index Rally target of 6543. It is essential to recognize, however, that there remains a possibility of a decline to Mean Support at 6426 before the upward trajectory resumes.
Wallstreet
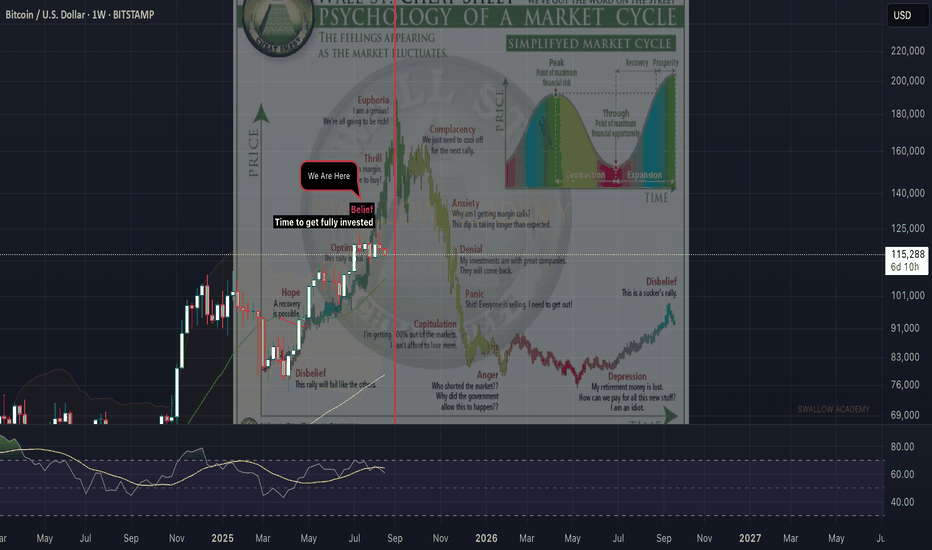
Bitcoin (BTC): Physiology of Market Cycle | Belief PhaseBitcoin is about to explode and so is the whole market. We are in the "Belief" stage with our bull market, where BTC is getting more and more exposure on socials, with people being very bullish on the markets; people again started to believe.
That being said, with our multiple analyses, we have determined the last time that the current bull run will end in 2026 and seems like here is another confirmation for it.
Without saying more, be ready—markets will explode very soon. Stack your altcoins and get ready!
Swallow Academy
Technical Analysis for US500 (S&P 500)Closing Price: 6447.8 (16th Aug 2025, 12:50 PM UTC+4)
Analysis Methods: Japanese Candlesticks, Harmonic Patterns (ABCD, M/W), Elliott Wave, Wyckoff, Gann Theory (Time/Square of 9/Angles), Ichimoku, RSI, Bollinger Bands, VWAP, Moving Averages (MA/EMA/SMA/WMA).
---------------------------------------------------------------------------------------------
1. Long-Term Trend (Weekly/Monthly)
Elliott Wave:
US500 is in Wave 5 of a bull cycle (Wave 3 peak: 6500, Wave 4 dip to 6200).
Target: 6600–6700 (1.618 extension of Wave 1).
Gann Price Forecasting:
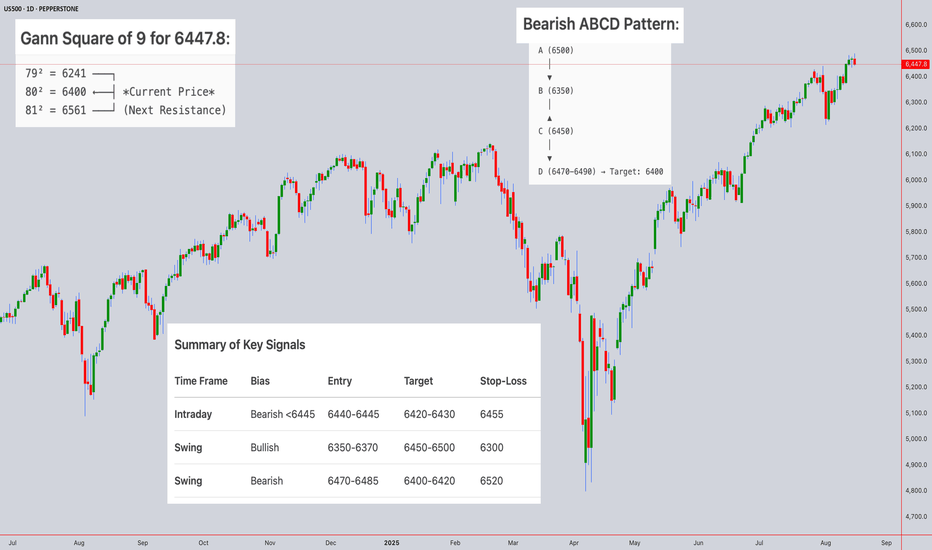
Square of 9: √6447.8 ≈ 80.30 →
Key resistance: 81² = 6561, support: 80² = 6400.
Break above 6561 targets 6724 (82²).
Ichimoku (Monthly):
Tenkan/Kijun: Bullish crossover (Tenkan: 6300 > Kijun: 6200).
Cloud: Price above Senkou Span (6100–6250) – bullish structure.
Moving Averages:
Weekly SMA(200): 6100 (major support).
Swing Outlook: Bullish but extended. Final Wave 5 targets 6600–6700.
2. Medium-Term Swing (4H/Daily)
Harmonic Patterns:
Bearish ABCD on Daily:
A: 6500 → B: 6350 → C: 6450 → D: 6470–6490 (1.272 BC extension).
Bullish Gartley (M Pattern) near 6350 (0.786 XA retracement).
Wyckoff Phase:
Distribution above 6450:
Upthrust at 6470 (16th Aug) on fading volume.
Lack of demand above 6460.
Gann Theory:
Time Window: Aug 19–22 (Square of 9 reversal cluster).
Price-Time Squaring: 6447.8 aligns with Aug 16 – consolidation likely.
Gann Angle: 1x1 support at 6420.
Indicators:
RSI(14) + Bollinger Bands (Daily):
RSI: 66 (neutral-bullish).
Price hugging upper BB(20,2) at 6475 – band expansion signals volatility.
VWAP (Weekly): 6380 (swing support).
Swing Trade Setup:
Short near 6470–6490 → Target 6400. Stop-loss: 6520.
Long near 6350 → Target 6500. Stop-loss: 6300.
3. Intraday Outlook (5M–4H)
Key Levels:
Resistance: 6460 (Gann 1x1), 6475 (daily high), 6490 (ABCD target).
Support: 6440 (VWAP), 6430 (Ichimoku cloud), 6420 (Gann angle).
Indicators:
Ichimoku (1H):
Tenkan: 6445, Kijun: 6435 → Price above both (weak bullish).
Cloud: Thin bullish (6425–6435) – intraday support.
RSI + Bollinger Bands (1H):
RSI(14): 59 (neutral).
Price testing mid-BB(20,2) at 6445 – break below signals bearish shift.
VWAP + MAs:
VWAP: 6442 (intraday pivot).
EMA(20): 6448 (resistance).
Candlestick Patterns:
4H Bearish Engulfing at 6465 → Reversal signal.
1H Evening Star at 6460 → Confirms weakness.
Gann Intraday Squaring:
Time Cycle: 14:00–16:00 UTC+4 (NY open) for volatility.
Price Harmony: Close below 6445 targets 6430 → 6420.
Intraday Trade Plan:
Sell below 6445 → Target 6430 (VWAP) → 6420 (Gann support).
Buy above 6465 only if RSI <65 → Target 6475.
Stop-Loss: 10–15 points.
Summary of Key Signals
Time Frame Bias Entry Target Stop-Loss
Intraday Bearish <6445 6440-6445 6420-6430 6455
Swing Bullish 6350-6370 6450-6500 6300
Swing Bearish 6470-6485 6400-6420 6520
Critical Events:
Gann Reversal Window: Aug 19–22 (watch for Fed minutes/Nvidia earnings).
Daily Close >6500 invalidates bearish patterns and targets 6561.
Risk Note: US500 is highly sensitive to tech earnings and Fed policy. Use tight stops during events.
Disclaimer: Technical analysis reflects historical patterns, not guarantees. Fundamental catalysts can override signals. Always use risk management.
For those interested in further developing their trading skills based on these types of analyses, consider exploring the mentoring program offered by Shunya dot Trade .( world wide web shunya dot trade )
I welcome your feedback on this analysis, as it will inform and enhance my future work.
Regards,
Shunya.Trade
world wide web shunya dot trade
⚠️ Disclaimer: This post is educational content and does not constitute investment advice, financial advice, or trading recommendations. The views expressed here are based on technical analysis and are shared solely for informational purposes. The stock market is subject to risks, including capital loss, and readers should exercise due diligence before investing. We do not take responsibility for decisions made based on this content. Consult a certified financial advisor for personalized guidance.
S&P 500 Daily Chart Analysis For Week of August 15, 2025Technical Analysis and Outlook:
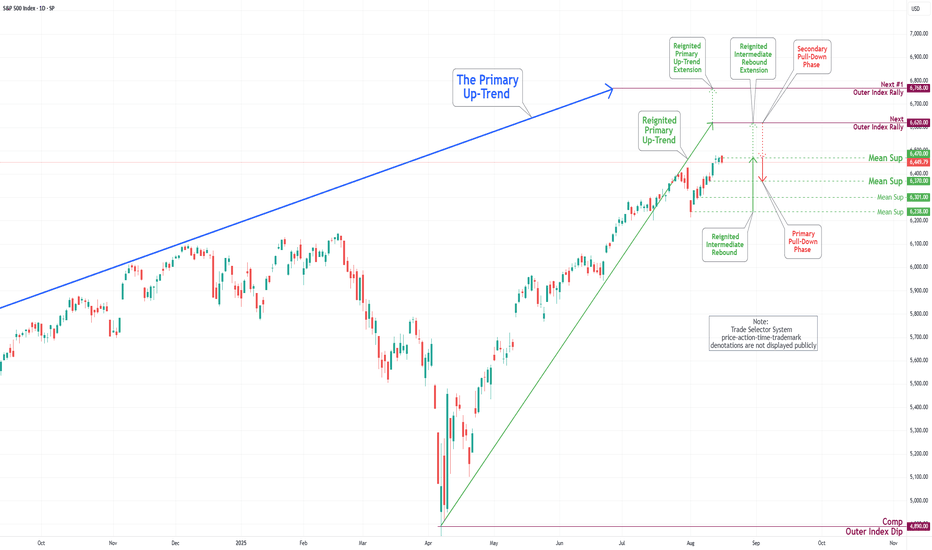
During the trading activity of the previous week, the S&P 500 Index exhibited a predominantly robust bullish trend, achieving a noteworthy marker by retesting the completed Outer Index Rally target of 6420, as outlined in last week’s Daily Chart Analysis. The primary objective now is to target the subsequent level, labeled the Outer Index Rally target, of 6620. On the downside, it is crucial to recognize that the current price movement is prone to retreat to Mean Support 6370 before the upward trajectory resumes.
S&P 500 Daily Chart Analysis For Week of August 8, 2025Technical Analysis and Outlook:
During the trading activity of the previous week, the S&P 500 Index exhibited a predominantly bullish trend and is poised to retest the completed Outer Index Rally target of 6420, as outlined in last week’s Daily Chart Analysis. The primary objective now is to target subsequent levels, specifically the next Outer Index Rally target of 6620 and beyond.
It is crucial to recognize that the current price movement may initiate a substantial pullback from the present price action, either before or following the attainment of the Outer Index Rally peak at 6420.
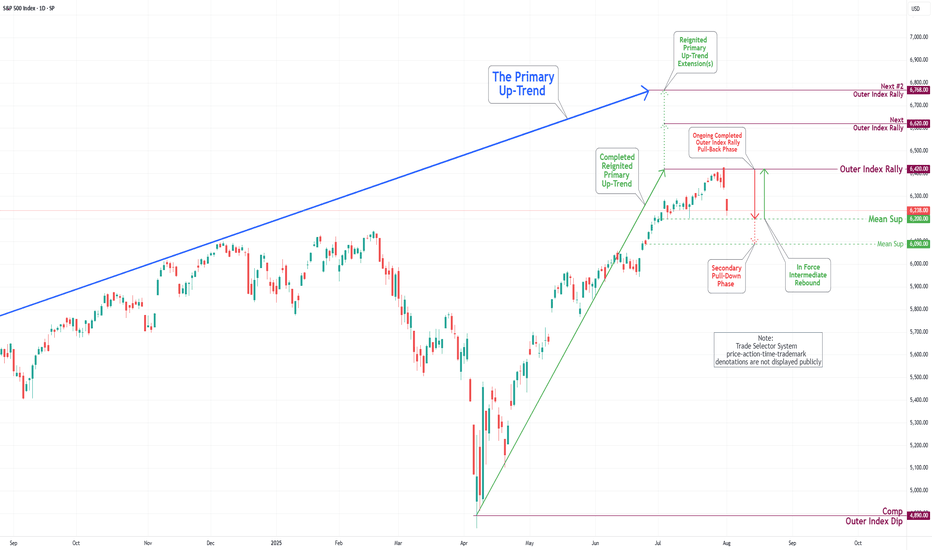
S&P 500 Daily Chart Analysis For Week of August 1, 2025Technical Analysis and Outlook:
During the trading activity of the previous week, the S&P 500 Index displayed a predominantly bearish movement after completing our Outer Index Rally target of 6420, as highlighted in the prior week’s Daily Chart Analysis, with the primary objective now being to plug our Mean Support at 6200.
It is essential to recognize that the current price movement may trigger a significant further pullback to the Mean Support level of 6090. Following this downturn, it is expected that the index will resume its upward momentum, aiming for a retest of the Outer Index Rally peak at 6420.
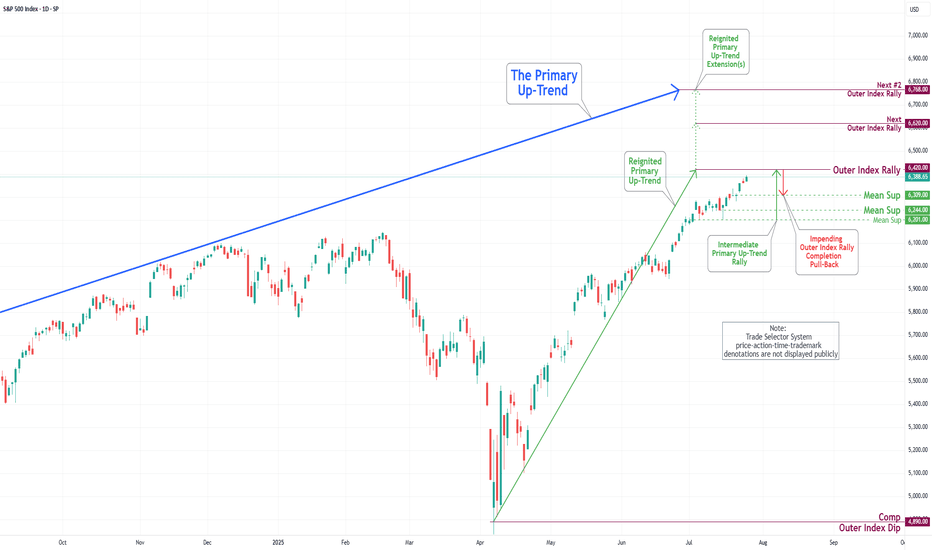
S&P 500 Daily Chart Analysis For Week of July 25, 2025Technical Analysis and Outlook:
In the trading activity observed last week, the S&P 500 Index exhibited a predominantly upward trajectory. It traded around the Key Resistance level of 6314. It successfully broke through this level, with the primary objective being to complete the Outer Index Rally at 6420, as outlined in the previous week's Daily Chart Analysis.
It is crucial to acknowledge that the current price movement may prompt a substantial pullback following the completion of the Outer Index Rally, with the main target identified as the Mean Support level of 6309. Following this potential downward adjustment, it is anticipated that the index will resume its upward trend, targeting a retest of the forthcoming completion of the Outer Index Rally at 6420.
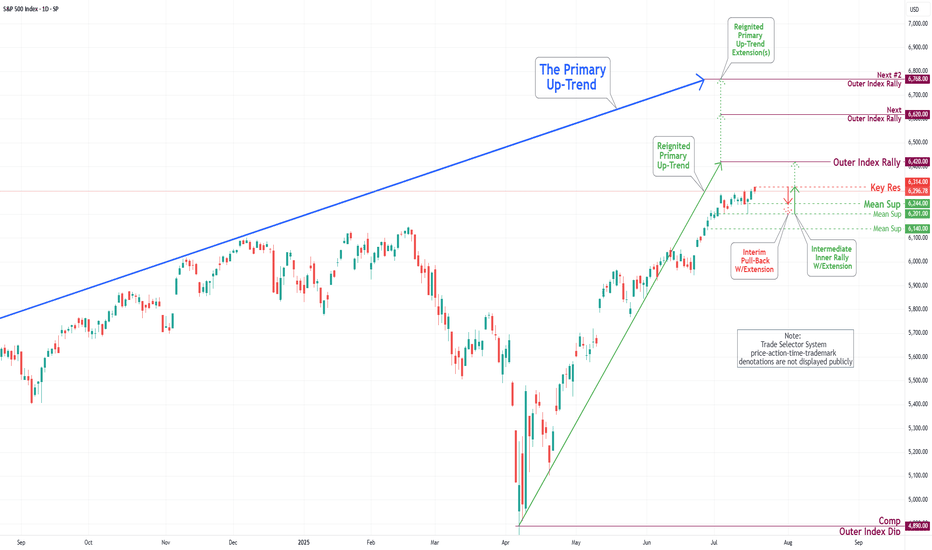
S&P 500 Daily Chart Analysis For Week of July 18, 2025Technical Analysis and Outlook:
During the current trading week, the S&P 500 Index has demonstrated a predominantly upward trajectory. It has successfully retested the Mean Support level at 6200 and established a new Key Resistance level at 6314. Currently, the index displays a bullish sentiment, with the objective for the Outer Index Rally set at 6420.
Nevertheless, it is essential to recognize that the current price action may result in a decline, potentially leading to a retest of the Mean Support at 6244 and extending to the Mean Support at 6201. Following this potential downward movement, it is anticipated that the index will resume its upward trend, driving the price action towards the Key Resistance level at 6314 and ultimately achieving the Outer Index Rally target of 6420.
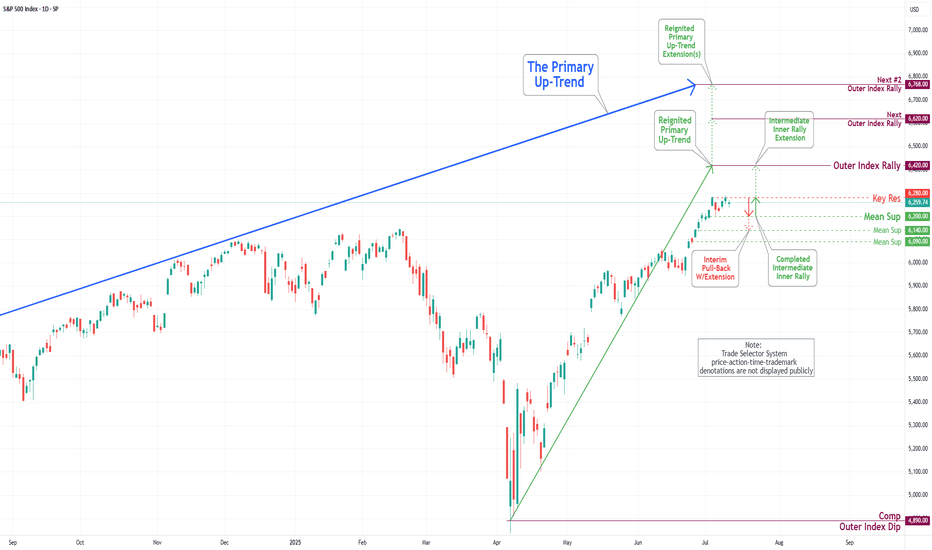
S&P 500 Daily Chart Analysis For Week of July 11, 2025Technical Analysis and Outlook:
During this trading week, the S&P 500 Index has shown a predominantly downward/upward course of action and created a new Key Resistance at 6280. Currently, the index exhibits a bullish bias, with the Outer Index Rally objective set at 6420. However, it is crucial to note that the current price action may cause prices to see in a new light from their current fluctuation to push toward the Mean Support at 6200 before resuming their upward movement.
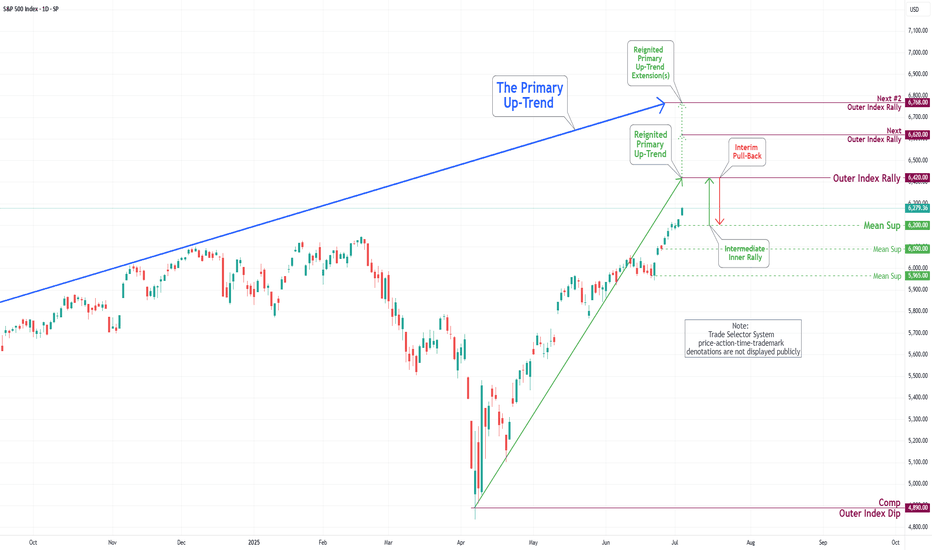
S&P 500 Daily Chart Analysis For Week of July 3, 2025Technical Analysis and Outlook:
During this abbreviated trading week, the S&P 500 Index has primarily shown an upward course, hitting and surpassing our target for the Outer Index Rally of 6235. Currently, the index demonstrates a consistent bullish trend, with the following objective for the Outer Index Rally set at 6420, followed by forthcoming targets of 6620 and 6768. Nevertheless, it is crucial to acknowledge the current price action may cause prices to retrace from their current fluctuation to test the Mean Support at 6200 before resuming their upward movement.
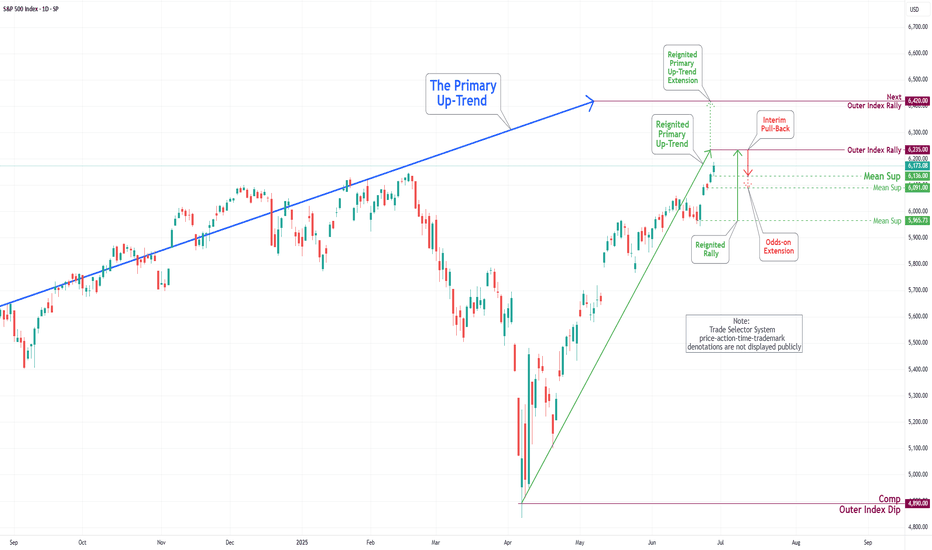
S&P 500 Daily Chart Analysis For Week of June 27, 2025Technical Analysis and Outlook:
During the current trading week, the S&P 500 Index has predominantly demonstrated an upward trajectory, surpassing the Mean Resistance level of 6046, the Outer Index Rally target of 6073, and the critical Key Resistance threshold of 6150. Currently, the index is exhibiting a bullish trend, indicating potential movement towards the Outer Index Rally objective of 6235. However, it is essential to note that there is a substantial probability that prices may retract from their current levels to test the Mean Support at 6136 before experiencing a resurgence.
S&P 500 Daily Chart Analysis For Week of June 13, 2025Technical Analysis and Outlook:
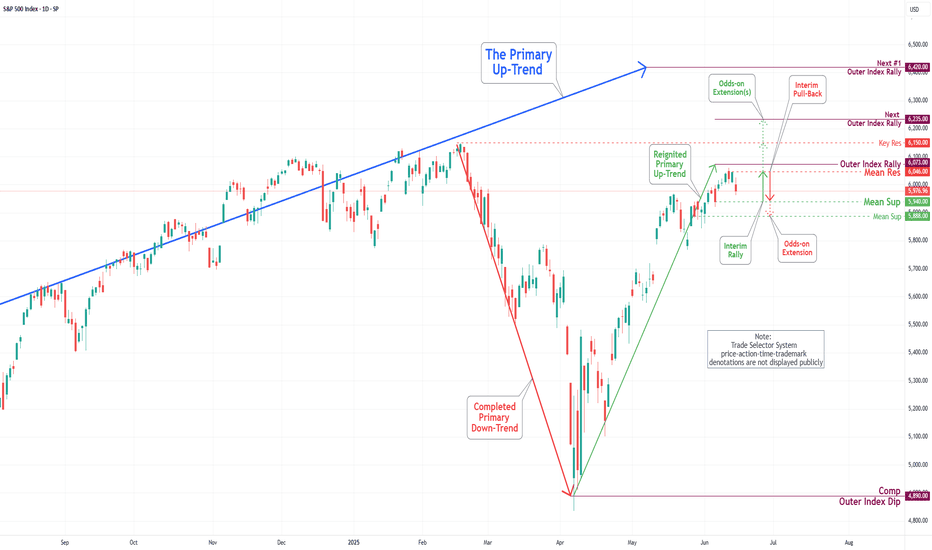
The S&P 500 Index has displayed both upward and downward movements throughout this week's trading session, narrowly missing the targeted Outer Index Rally level of 6073. Currently, the index is characterized by a bearish trend, warranting attention towards the Mean Support level of 5940, with additional critical support identified at 5888.
Conversely, there exists a significant potential that, upon reaching the Mean Support of 5940, the index may recover and rise to the Mean Resistance level of 6046. This upward movement could facilitate an interim rally, culminating in the completion of the Outer Index Rally at 6073 and enabling the index to address the Key Resistance level positioned at 6150.
S&P 500 Daily Chart Analysis For Week of June 6, 2025Technical Analysis and Outlook:
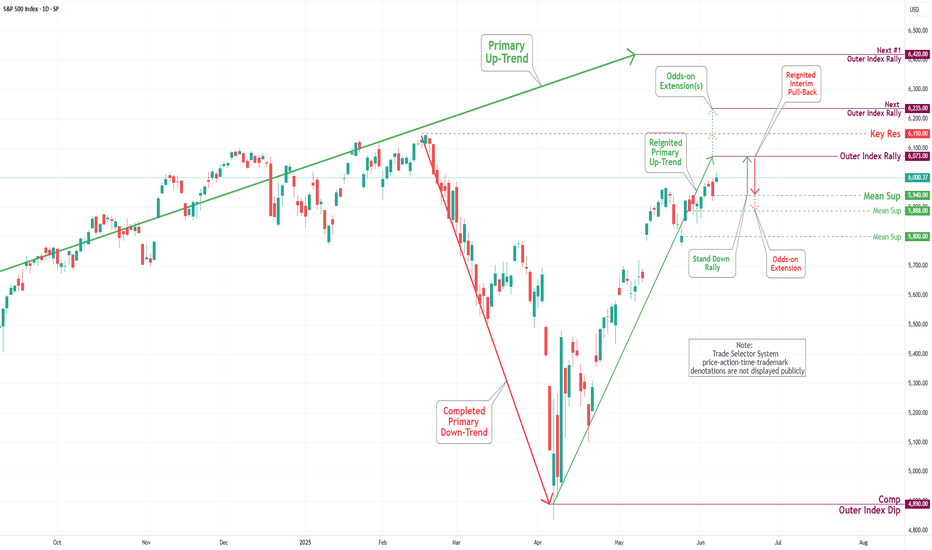
The S&P 500 Index has demonstrated an upward trajectory during this week's trading session, surpassing the established Outer Index Rally level of 5955 and the Key Resistance level of 5965. Currently, the index is exhibiting a bullish trend, with a focus on the Outer Index Dip target, set at 6073. Furthermore, additional critical levels have been identified, including Key Resistance at 6150 and the Next Outer Index Rally at 6235. Conversely, there is a potential decline in index prices from the current level or upon completion of the Outer Index Dip 6073, which may lead to a retest of the Mean Support at 5940, with the possibility of extending the pullback to the Mean Support at 5888.
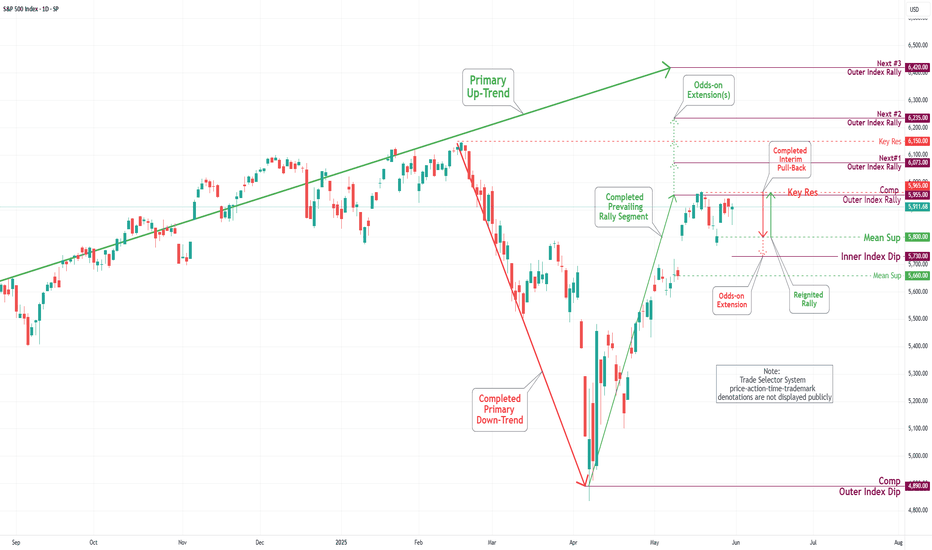
S&P 500 Daily Chart Analysis For Week of May 30, 2025Technical Analysis and Outlook:
The S&P 500 Index has undergone considerable price fluctuations during the trading sessions of this week, successfully reaching a critical target at the Mean Support level of 5800. Presently, the index is exhibiting an upward trend with a focus on the retest of the Inner Index Dip at 5955 and Key Resistance at 5965. Furthermore, additional significant levels have been identified, including the Next#1 Outer Index Rally at 6073, Key Resistance at 6150, and the Next#2 Outer Index Rally at 6235. Conversely, there is a potential for the index prices to downfall aiming to retest Mean Support 5800 and to complete the Outer Index Dip, noted at 5730.
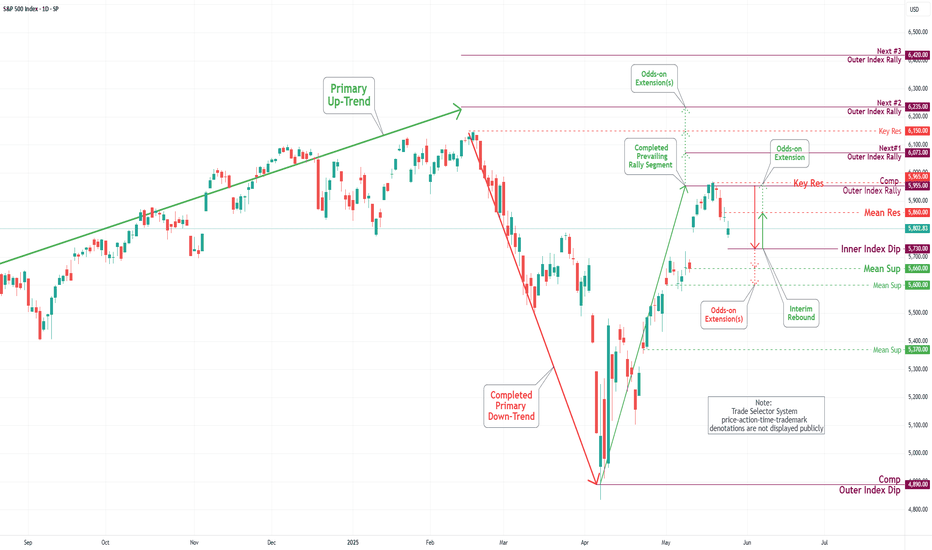
S&P 500 Daily Chart Analysis For Week of May 23, 2025Technical Analysis and Outlook:
The S&P 500 Index demonstrated a consistent downward trend during this week's trading session, reaching a significant target at the Mean Support level 5828. The index is currently trending lower, targeting the Inner Index Dip at 5730, with additional marks identified at the Mean Support levels of 5660 and 5600. Conversely, the index has the potential to rebound from its present position, advancing toward the Mean Resistance level of 5860 and retesting the previously completed Outer Index Rally at 5955.
S&P 500 Daily Chart Analysis For Week of May 16, 2025Technical Analysis and Outlook:
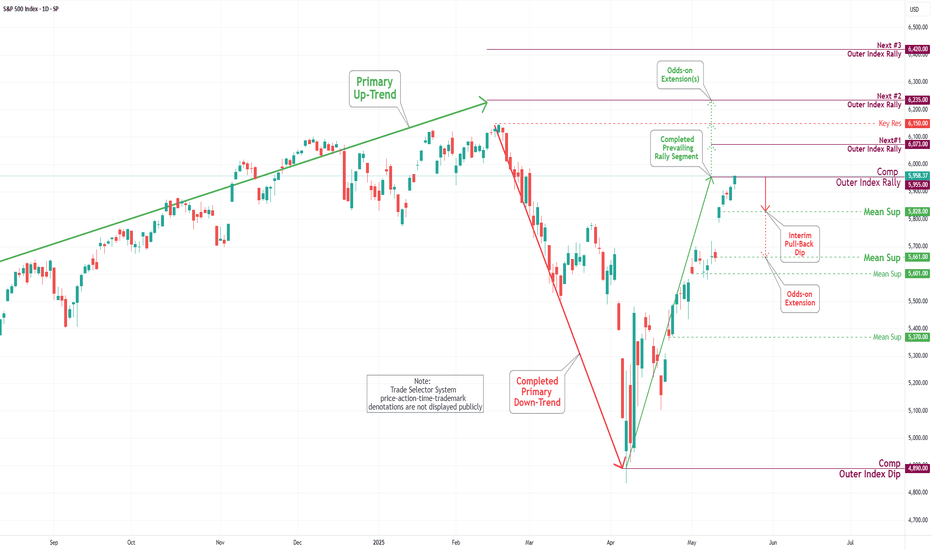
The S&P 500 Index showed a steady upward trend during this week's trading session, successfully reaching a key target at the Outer Index Rally level of 5955. However, it's important to note the significant downward trend due to letter completion, which could lead to a decline toward the Mean Support level of 5828. Additionally, there is a possibility of further drops to the Mean Support level of 5661. On the other hand, the index may continue to rise from its current level, potentially advancing toward the Inner Currency Rally target set at 6073.
