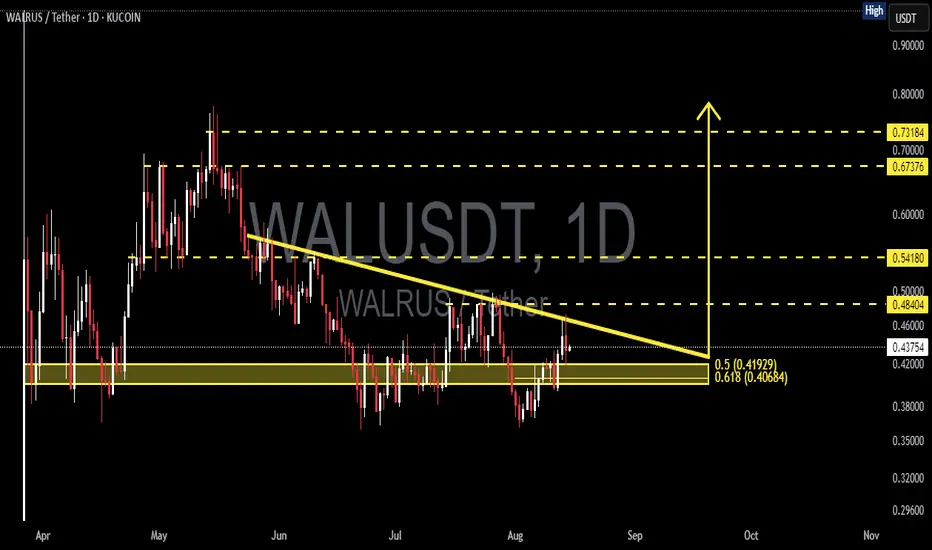
WALUSDT — Breakout or Breakdown? Golden Pocket the Key!Quick Context: Since May, price has formed a series of lower highs connected by a descending trendline (yellow). Beneath it lies a strong demand zone at 0.406–0.420, aligning with Fibonacci 0.5 (0.419) and 0.618 (0.407) — the golden pocket. Current price is around 0.435, pressing against the trendline and approaching the apex of the pattern.
Pattern & Key Levels
Main Pattern: Descending Triangle (downward-sloping top, relatively flat base/zone). Theoretically slightly bearish, but since it sits right on the golden pocket with compression, the probability of an impulsive breakout in either direction is high.
Major Demand / Support: 0.406–0.420 (golden pocket + base).
Immediate Resistance: descending trendline + 0.44–0.46 area.
Next resistance targets (yellow dashed lines): 0.484 → 0.542 → 0.674 → 0.732.
Downside supports if broken: 0.380 → 0.350 → 0.296.
Bullish Scenario
1. Confirmation: Daily close above the trendline and ideally > 0.460 (clear breakout confirmation).
2. Healthy Retest: Pullback to 0.44–0.46 / trendline, now acting as support.
3. Step Targets:
T1: 0.484
T2: 0.542
T3: 0.674
T4: 0.732
4. Bullish Invalidation: Daily close back below 0.420; strong invalidation if < 0.406 (loss of golden pocket).
Bearish Scenario
1. Rejection: Fails to break 0.44–0.46 / trendline and turns down.
2. Weakness Confirmation: Daily close below 0.406 (loss of base + golden pocket).
3. Downside Targets:
S1: 0.380
S2: 0.350
S3: 0.296
4. Bearish Invalidation: Daily close above 0.460 with a successful retest flips bias to bullish.
Execution Notes
Apex Break: The closer price gets to the apex, the higher the risk of false breaks — always wait for a daily close to confirm.
Volume: A valid breakout should be accompanied by increasing volume.
Risk Management: Place stops beyond the invalidation zones of your chosen scenario (below 0.406 for breakout longs; above 0.460 for rejection shorts).
> Summary: WALUSDT is being squeezed between the descending trendline and golden pocket 0.406–0.420. A daily close above 0.460 could open the path to 0.484/0.542, while a breakdown below 0.406 may trigger a drop towards 0.380–0.350.
Not financial advice; purely for educational and technical reference.
#WALUSDT #Walrus #CryptoTA #PriceAction #DescendingTriangle #Fibonacci #SupportResistance #Breakout #RiskManagement
WALUSD
WAL/USDT – Major Breakout Unfolding! 70% Upside Potential?After weeks of compressed price action and relentless seller pressure, WAL is showing signs of a potential explosive move. Is this the breakout bulls have been waiting for?
🧩 Chart Pattern: Descending Triangle — With a Bullish Twist
Over the past 3 months, WAL has formed a descending triangle, typically known as a bearish continuation pattern.
But here’s the twist — WAL is breaking out upwards, signaling potential trend reversal instead.
The pattern shows higher lows meeting a horizontal resistance around $0.47–$0.48, a classic sign that buyers are gaining strength.
This setup suggests buyers are slowly overpowering the selling pressure, leading to a high-probability breakout scenario.
🟡 Strong Accumulation Zone: $0.42–$0.45
This range has consistently acted as a strong support base since mid-April.
Every dip into this zone has been met with strong buyback and increasing volume.
It likely represents a smart money accumulation zone before a larger markup phase.
🚀 Breakout Target: Where Could Price Go?
Measured move from the triangle's height projects a move of ~$0.25. From the breakout level at ~$0.48, this gives a technical target around $0.73.
🎯 Bullish Price Targets:
1. TP1: $0.543 — First breakout validation zone
2. TP2: $0.650 — Previous May resistance level
3. TP3: $0.731 — Measured move target from triangle
4. Extended Target: $0.967 – $0.977 — Prior liquidity and local high zone
With sustained volume, $1.00+ isn’t off the table.
---
🔻 Bearish Scenario:
If this breakout turns into a fakeout:
Price may revisit the support zone at $0.45–$0.42.
Breakdown below this zone opens risk toward:
🧨 $0.36 — Mid-range demand zone
Further breakdown could lead to $0.30–$0.28
Confirmation of a fakeout: A strong 12H close below the yellow box support with increasing sell volume.
🔍 Additional Bullish Confirmation Signals:
Volume should spike significantly above average to validate breakout.
RSI, MACD, or EMA crossover can help strengthen the bullish thesis if aligned.
✅ Summary
WAL/USDT is currently at a pivotal breakout moment. A confirmed move above the descending triangle could trigger a major trend reversal, with targets between $0.65 and $0.73 in sight. This setup could be one of the cleanest breakout opportunities on the charts right now.
#WALUSDT #CryptoBreakout #TechnicalAnalysis #BullishSetup #DescendingTriangle #AltcoinWatch

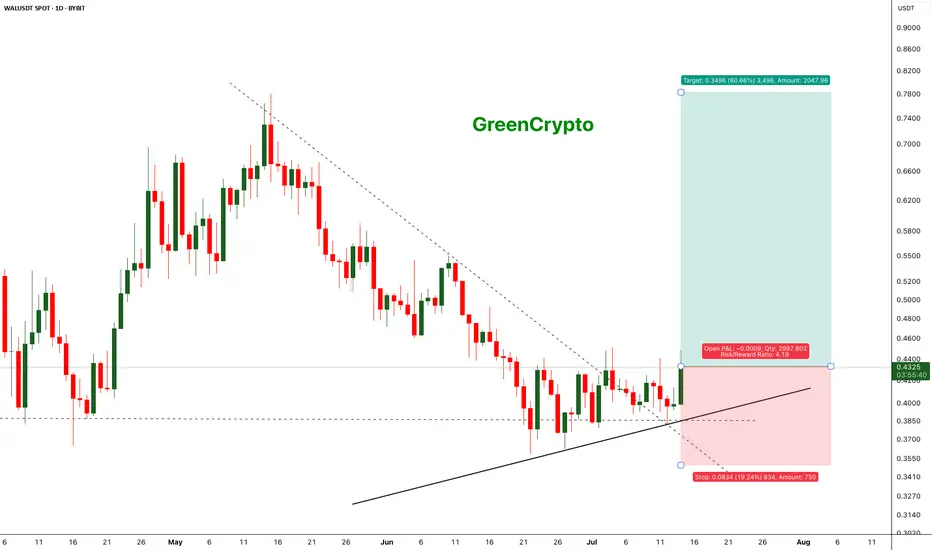
WALUSDT - Change in the trend and let's capture itWAL is currently showing a change in the trend, after a continous downtrend finally we are seeing change in the trend.
Price has held the support strongly and now we are seeing the reversal.
We have decent trade opportunity here.
Entry Price: 0.4319
StopLoss: 0.3500
TP1: 0.4828
TP2: 0.5292
TP3: 0.6374
TP4: 0.7817
Cheers
GreenCrypto