The cloud with the help of the Tenkan we will rise!!Shit is about to get real.
I was telling folk to look at BTC @ $19....
This could be the time.
NOT FINANCIAL ADVICE
Wave3

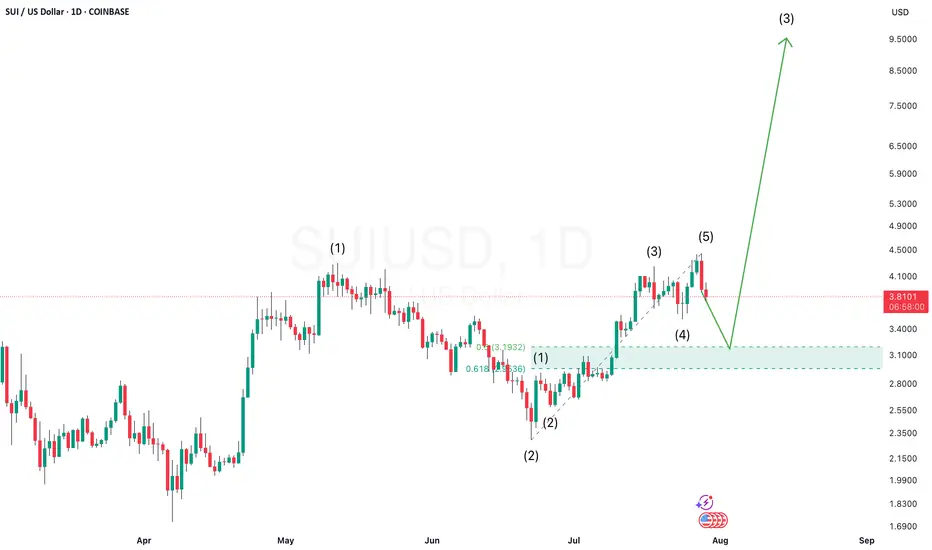
SUIUSD Setting Up for a Potential 1-2, 1-2 Pattern — Wave 3 BlasSUIUSD appears to be forming a classic 1-2, 1-2 Elliott Wave setup — a bullish structure that often precedes an explosive third wave rally.
In this pattern, we first see a motive Wave 1 followed by a corrective Wave 2, then another smaller-degree Wave 1 and 2 within the larger Wave 3. This kind of nested structure shows strong underlying bullish momentum building up in layers.
Once the second minor Wave 2 completes, SUI could launch into a powerful third wave of Wave 3, typically the strongest and most extended move in the sequence. That’s the breakout phase where price accelerates rapidly, often leaving late buyers behind.
Watch for confirmation
Potential Reversal Ahead: Elliott Wave AnalysisHello friends,
Welcome to RK_Chaarts,
Today we're going to analyze chart of stock named IDFC First Bank, based on Elliott wave theory.
Today, we're analyzing the chart of IDFC First Bank using Elliott Wave theory. On the chart, we've marked the Elliott Waves, indicating that:
- Red wave 1 and 2 (Minor degree) have ended
- Price is unfolding into red wave 3 (Minor degree)
- Black wave ((i)) and ((ii)) (Minute degree) have completed
- Black wave ((iii)) (Minute degree) is ongoing
- Blue wave (i) and (ii) (Minuette degree) have finished
- Blue wave (iii) (Minuette degree) is in progress
- Red wave i, ii, and iii (Subminuette degree) have completed
- Possibly in the correction phase of red wave iv (Subminuette degree)
We observe that the price gapped up, retraced to correct wave iv, and is now supported by the gap zone. Along with 200Exponential Moving Average is also at Gap level which can also provide a good Support to same view.
Our estimate suggests a high probability of a price reversal. However, market uncertainties exist.
Potential price targets: 81, 93, and 100+
Nearest invalidation level: 73.09 (wave iv should not overlap wave i)
Please note that this analysis is for educational purposes only. I'm not a SEBI-registered analyst, and you should consult your financial advisor before trading or investing.
Let's see how the market unfolds. This entire study is shared solely for educational purposes. Thank you so much.
I am not Sebi registered analyst.
My studies are for educational purpose only.
Please Consult your financial advisor before trading or investing.
I am not responsible for any kinds of your profits and your losses.
Most investors treat trading as a hobby because they have a full-time job doing something else.
However, If you treat trading like a business, it will pay you like a business.
If you treat like a hobby, hobbies don't pay, they cost you...!
Hope this post is helpful to community
Thanks
RK💕
Disclaimer and Risk Warning.
The analysis and discussion provided on in.tradingview.com is intended for educational purposes only and should not be relied upon for trading decisions. RK_Chaarts is not an investment adviser and the information provided here should not be taken as professional investment advice. Before buying or selling any investments, securities, or precious metals, it is recommended that you conduct your own due diligence. RK_Chaarts does not share in your profits and will not take responsibility for any losses you may incur. So Please Consult your financial advisor before trading or investing.

KSMUSDT D – Start of Wave 3? After a clear 5-wave impulsive move up, KSMUSDT seems to have completed a deep ABC correction, potentially marking the end of Wave 2.
📉 Wave 1: We had a clean five-wave move from the bottom, which fits classic Elliott Wave structure.
📉 Wave 2: The correction that followed was much deeper than the ideal Fibonacci retracement zone. However, crucially, it never violated the low of Wave 1, which means it still holds valid under Elliott Wave rules. The correction unfolded as a textbook ABC pattern, with Wave C digging deep into the previous structure — showing panic selloff and possibly a final capitulation.
🔄 Key Development Now:
The resistance trendline of the correction has just been broken, suggesting potential momentum shift. This could mark the beginning of Wave 3, which is typically the strongest and most impulsive wave in Elliott Wave theory.
📈 Potential Target for Wave 3: Around the 39.5.80–42.00 area based on Fibonacci projections, but this is an early assumption and requires confirmation by price action and volume.
⚠️ Important Risk Note:
Despite this bullish technical setup, the current market remains risky. The bounce is fresh, and confirmation is still lacking. There's still the possibility of a deeper retest or invalidation of this count if price closes below the base of Wave 1.
🧠 Trade Plan:
- Wait for follow-through confirmation.
- Manage risk carefully — this is an early entry scenario.
- A stop below the recent low (~11.30) would be logical for this wave count.
📊 What do you think? Is this the beginning of a powerful Wave 3, or just another fakeout?
💬 Drop your thoughts or alternate wave counts in the comments!

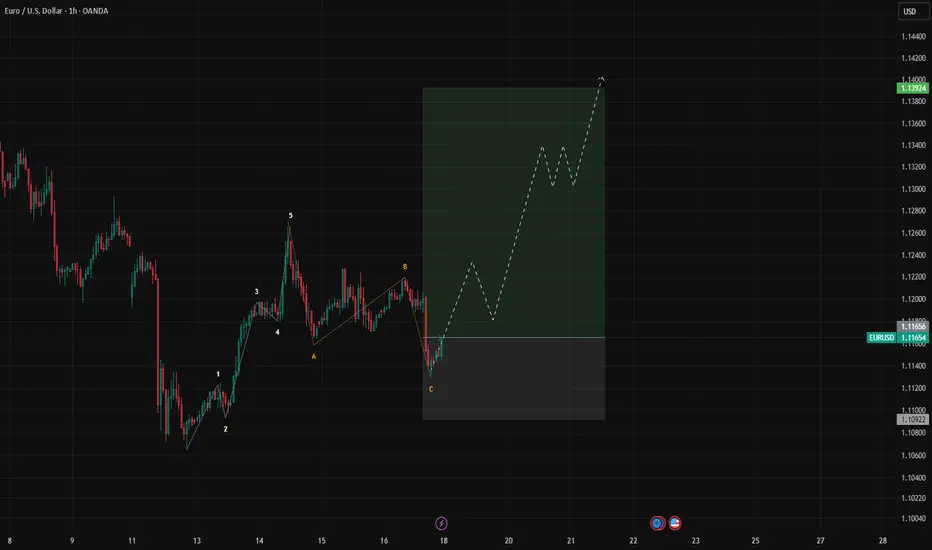
EUR/USD 1H AnalysisWhat we’ve got here on EUR/USD looks like a clean Elliott Wave setup shaping up.
There’s a strong 5-wave move up that likely forms Wave 1, followed by a simple ABC correction — that gives us Wave 2.
Now price is reacting from that C point, and this could be the beginning of Wave 3, which is usually the most powerful part of the trend.
🟩 Entry Zone: 1.114 – 1.12
🎯 TP: 1.14
🛑 SL: 1.109
⚖️ Risk/Reward Ratio: 1:3
💡 Note: Always manage your risk and confirm with your own analysis before entering any trade.
Keep an eye on it — could be a solid setup if it confirms. Drop your thoughts if you're trading this too 👇
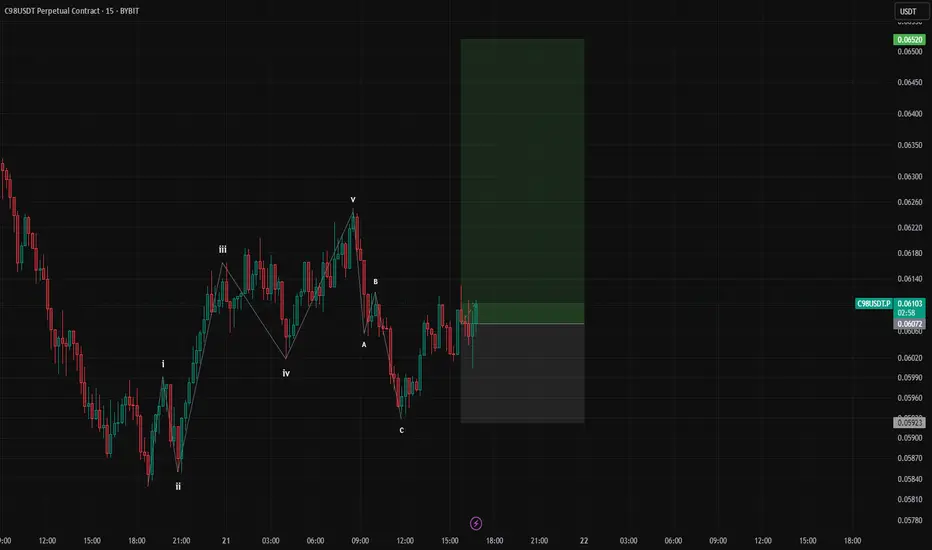
C98/USDT 15M ANALYSISHey Traders! 👋
I'm tracking a potential impulsive Elliott Wave structure on C98/USDT.
📈 Wave Count So Far:
- We completed a clean 5-wave impulsive move up — labeled i through v.
- This was followed by a classic zigzag (ABC) correction, forming what looks like a textbook
Wave 2.
- The corrective structure appears complete, and price is now holding above key support.
🔍 Current Expectation:
I'm now looking for Wave 3 to unfold, which typically brings the strongest momentum in the Elliott Wave sequence.
Trade Setup:
🟢 Entry Zone: 0.06 – 0.0615
🔴 Stop Loss: 0.05923
🎯 Target Price: 0.0652
💡 Note: Always manage your risk and confirm with your own analysis before entering any trade.
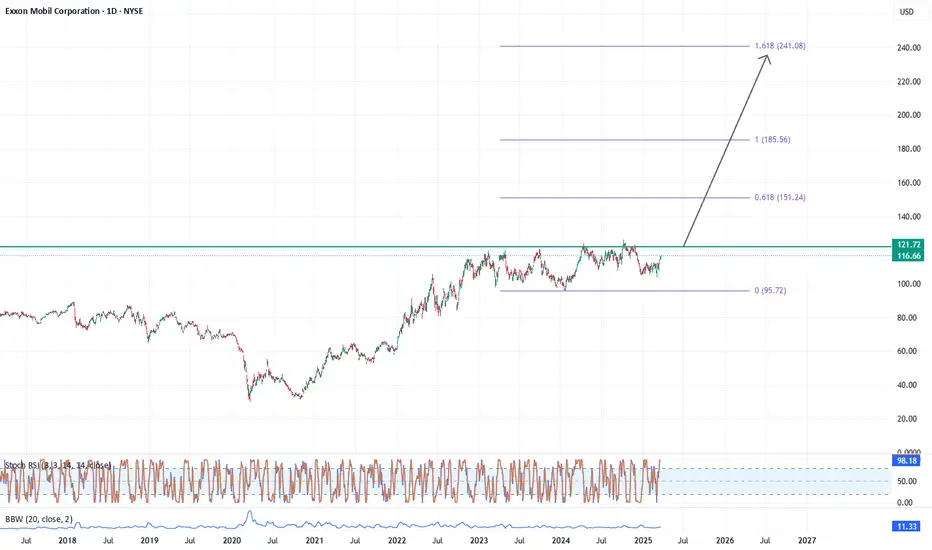
XOM to Double!Could be completing a Wave 2 correction formation. Appears to be a Reverse Head and Shoulders with a neckline just above 120. If, in fact, we are beginning a 3rd Wave, a 1.618 of Wave 1 move would put XOM at 240.
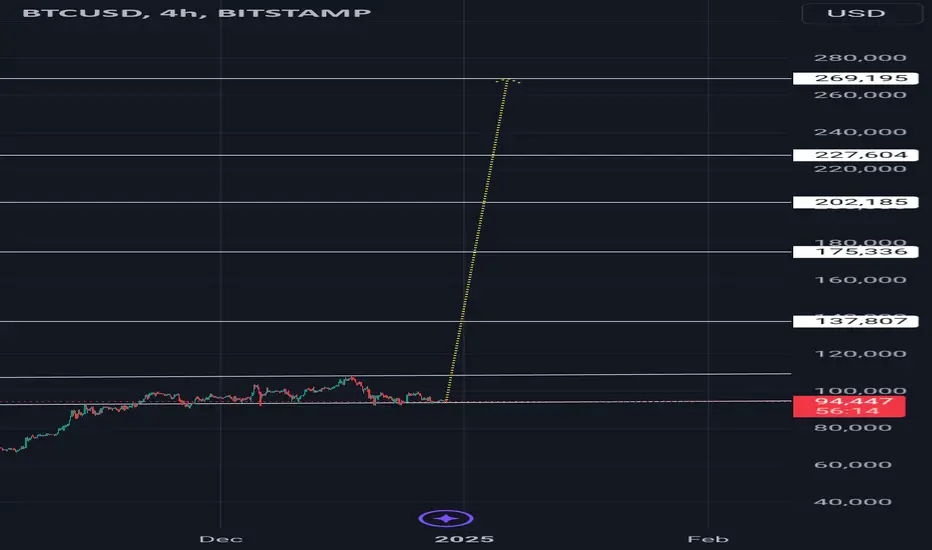
#btc #btcusd #elliottwave long buy setup wave 3 25Jan25This count is based on my assumptions so anything can happen not a trading or financial advice just for educational purposes only kindly do your own ta thanks trade with care good luck.
Elliott wave theory. Already 5 waves done!Looking for Impulse Down.
EurAud Wave 1,2,3,4 & 5 done, Will it go on to finish waves A, B, and C? I am anticipating wave C will be completed as well. Elliott wave theory. Make sure you have your own rules on RR and follow them. This is just a trading idea to help you gain better knowledge. If you have any question ask me in comments.
Learn & Earn!
Wave Trader Pro

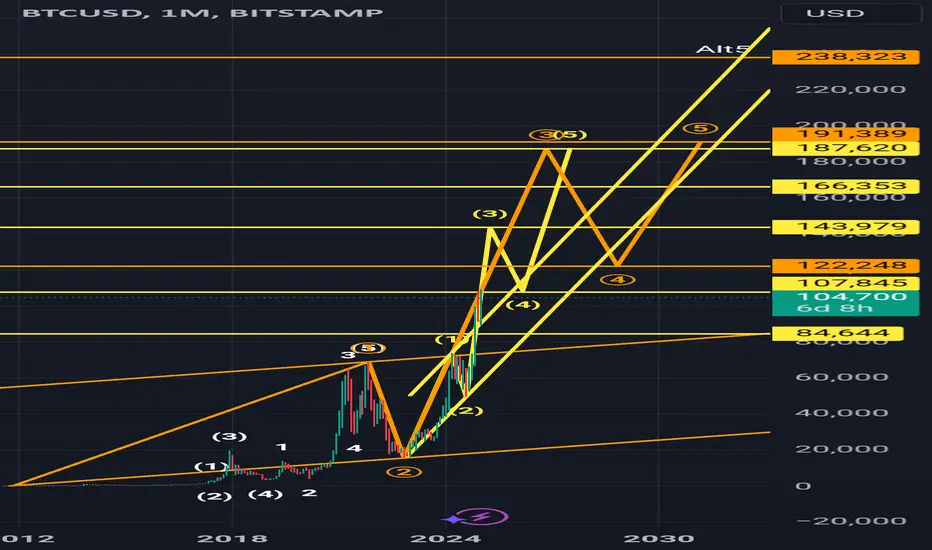
#btc #btcusd #elliottwave long buy setup wave 3 29Dec24This count is based on my assumptions so anything can happen not a trading or financial advice just for educational purposes only kindly do your own ta thanks trade with care good luck.
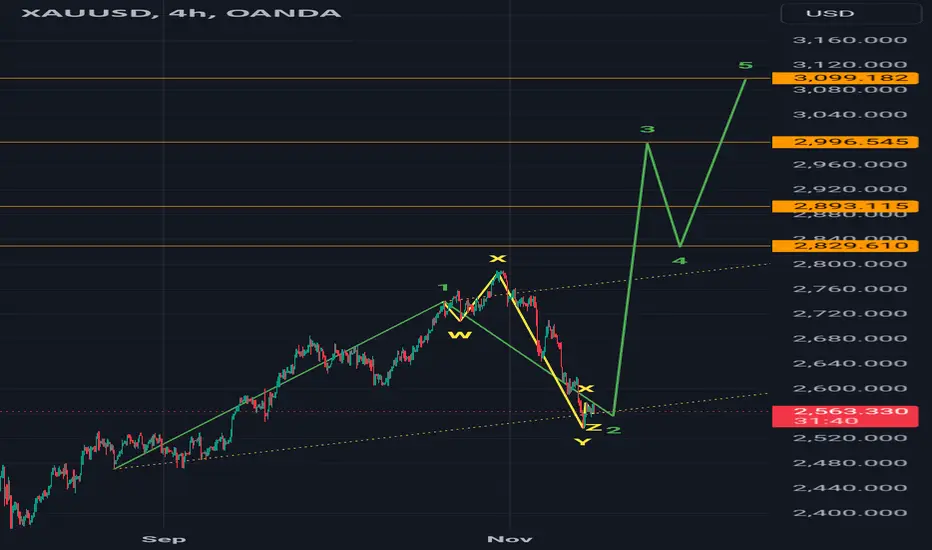
#xauusd #elliottwave long buy setup wave 3 of 5 12Dec24This count is based on my assumptions so anything can happen not a trading or financial advice just for educational purposes only kindly do your own ta thanks trade with care good luck.

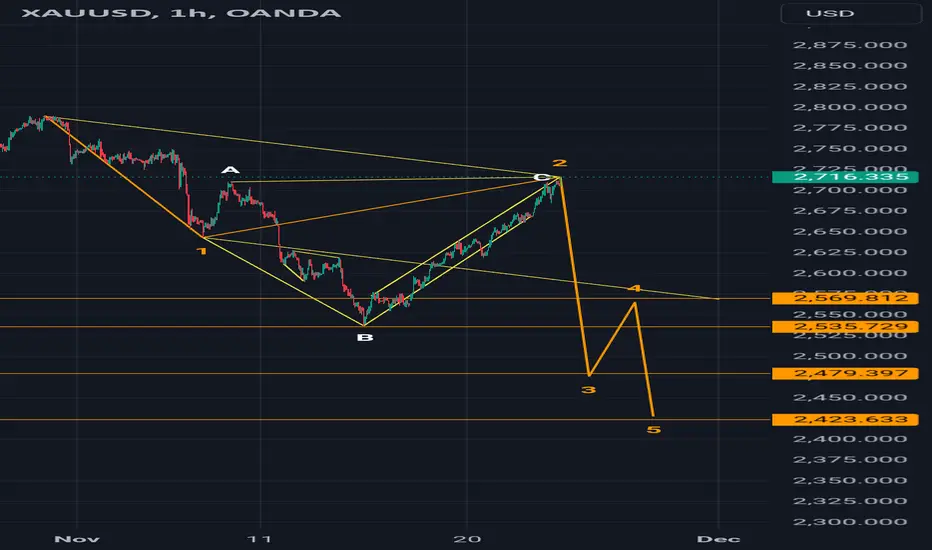
#xauusd #elliottwave short sell setup wave 3 12Dec24This count is based on my assumptions so anything can happen not a trading or financial advice just for educational purposes only kindly do your own ta thanks trade with care good luck.

#btc #btcusd #elliottwave long buy setup wave 3 9Dec24This count is based on my assumptions so anything can happen not a trading or financial advice just for educational purposes only kindly do your own ta thanks trade with care good luck.

#xauusd #elliottwave long buy setup wave 5 of 3 of 3 of 1This count is based on my assumptions so anything can happen not a trading or financial advice just for educational purposes only kindly do your own ta thanks trade with care good luck.

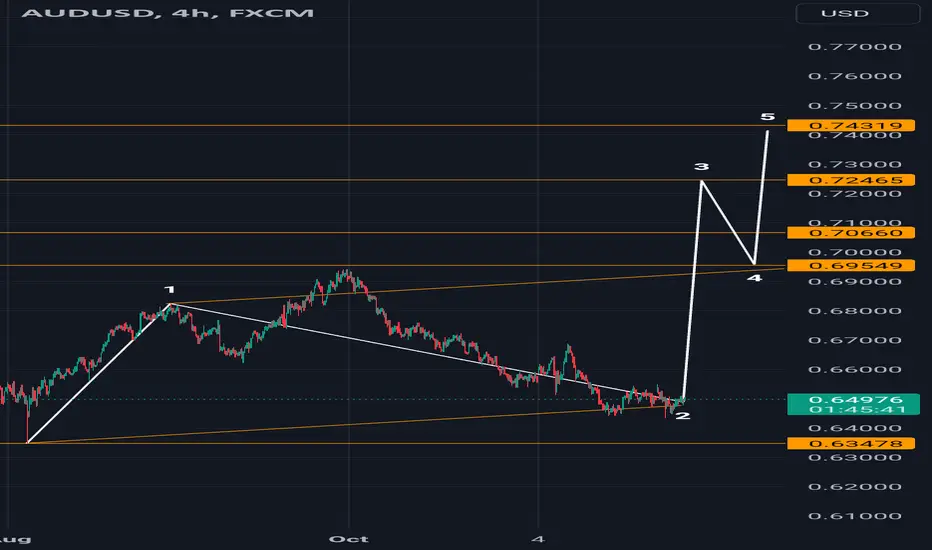
#Audusd #elliottwave long buy setup wave 3 4h 28Nov24This count is based on my assumptions so anything can happen not a trading or financial advice just for educational purposes only kindly do your own ta thanks trade with care good luck.
#xauusd #elliottwave long buy setup wave 3 25Nov24This count is based on my assumptions so anything can happen not a trading or financial advice just for educational purposes only kindly do your own ta thanks trade with care good luck.

#xauusd #elliottwave short sell setup wave 3 25Nov24This count is based on my assumptions so anything can happen not a trading or financial advice just for educational purposes only kindly do your own ta thanks trade with care good luck.
#xauusd #elliottwave short sell setup wave 3 4h 22Nov24 This count is based on my assumptions so anything can happen not a trading or financial advice just for educational purposes only kindly do your own ta thanks trade with care good luck.
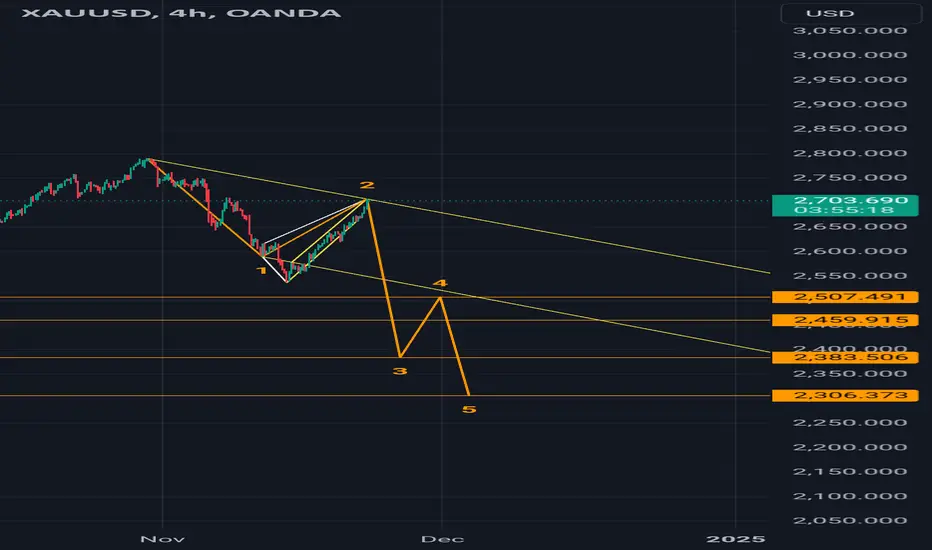
#xauusd #elliottwave short sell setup wave 3 4h 21Nov24This count is based on my assumptions so anything can happen not a trading or financial advice just for educational purposes only kindly do your own ta thanks trade with care good luck.

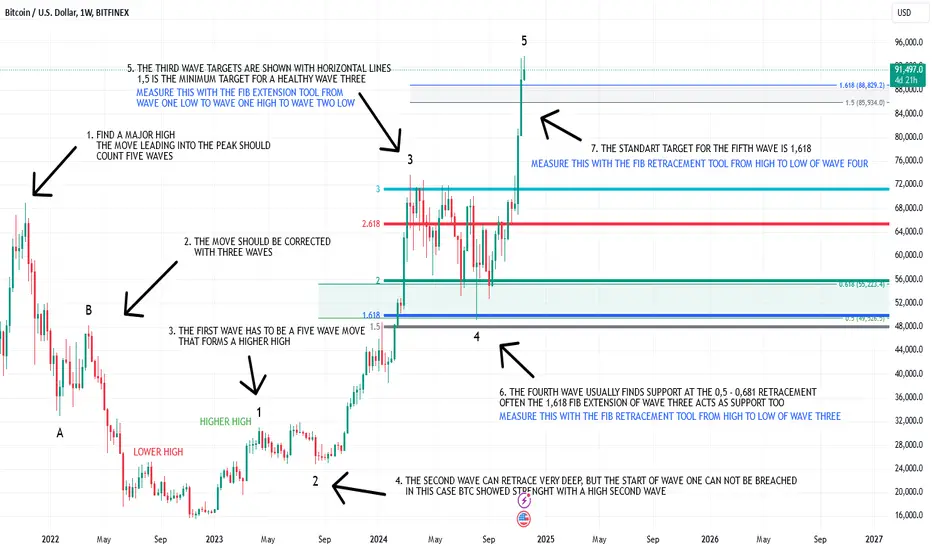
Elliot waves meets Fibonacci [Educational]Hello everyone,
today I like to share how I use elliot waves combined with fibonacci to analyze the market.
The standard rules are:
- Wave 2 can now be lower then the start of wave 1
- Wave 3 should be the longest
- Wave 4 should not breach the high of wave 1
But to have a more objective view there are also price targets to be reached within the different waves. It's a complex subject to show in one chart, so feel free to ask in the comment section if you have any questions.
#xauusd #elliottwave long buy setup wave 3 4h 15Nov24This count is based on my assumptions so anything can happen not a trading or financial advice just for educational purposes only kindly do your own ta thanks trade with care good luck.
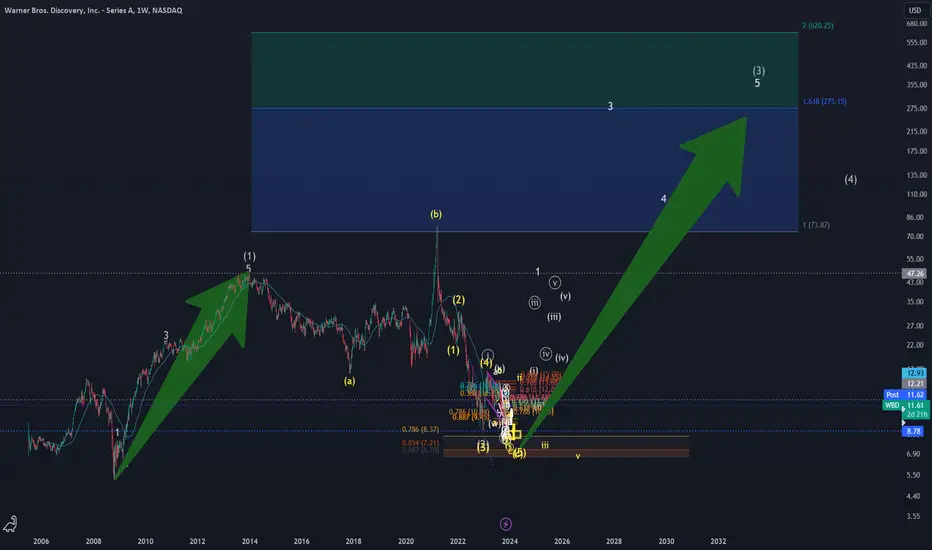
WBD bottoming in process, turnaround soon? Target 70 USD +Following WBD for quiet a few years, and we could witness now a bottoming process, where either we have the lows already in, or we should be near to it.
On the several year-prospect we had already a wave 1 (or A wave) to the upside, with a wave 2 several year pullback as either as a-b-c (with an overshooting b wave to the upside), or a WXY structure.
Yellow route is the alternative route for now, which highlights one more bigger swing lows arriving (and that currently we might be in yellow wavecounts, where price action SHOULD hold the 8.30-8.40 USD mark and not break below comfortably. (Secondary scenario)
Primary scenario where I watching primary a bottoming process is the white route where the white big wave (2) is already in at ~8.80 USD. As the weekly and daily MACD/RSI showing bullish divergence, and also the runup having clearly impulsive characteristic from that bottom, I am leaning towards this scenario.
Be aware, yellow is still not invalidated though. I am re-publishing the idea, since the previous one got flagged for house-rule-violation.
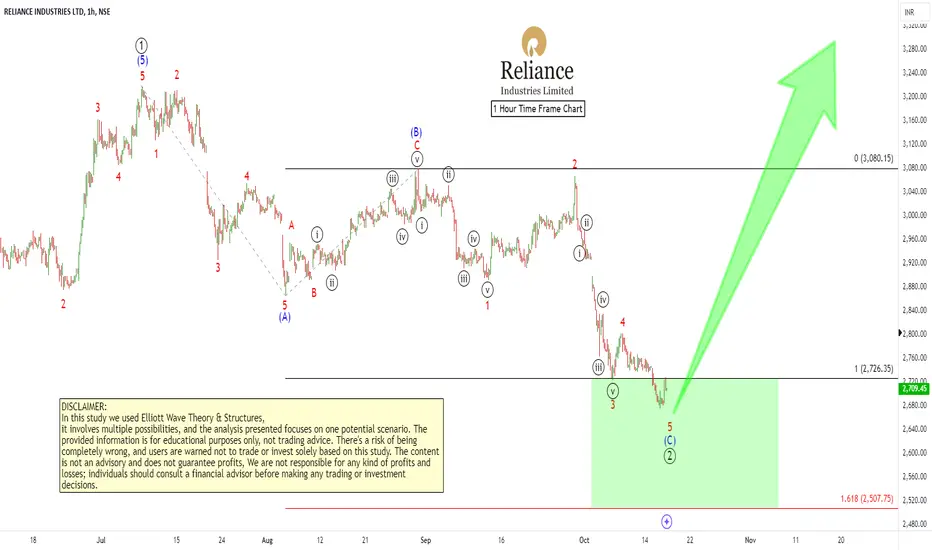
Elliott Wave Outlook for RELIANCETechnical Analysis of Reliance Industries (RELIANCE) based on Elliott Waves
This analysis is based on Elliott Wave Theory and is for educational purposes only. It does not constitute financial advice. Investing involves risk, and past performance is not indicative of future results. Always consult with a financial advisor before making any investment decisions.
Elliott Wave Analysis
The provided chart of Reliance Industries (RELIANCE) outlines a potential Elliott Wave pattern within a 1-hour timeframe. Elliott Wave Theory suggests that financial markets move in predictable and repeatedly patterns based on investor psychology.
Key Observations:
1. Impulse Wave: The primary uptrend appears to be an impulse wave, a five-wave structure.
Wave 1: The initial uptrend from the low point.
Wave 2: A minor correction or pullback.
Wave 3: A strong extension of the uptrend.
Wave 4: A smaller correction.
Wave 5: The final wave of the impulse, often ending with a climactic price movement.
2. Corrective Wave: The current downward movement was a zigzag corrective pattern.
Wave A: The initial decline.
Wave B: A minor retracement.
Wave C: The expected continuation of the downward trend.
Potential Scenario:
If the current corrective pattern zigzag finishes here or near, then further wave ((3)) is to start post completion of wave (C) of ((2)), and it would not go sudden upside, because any impulse wave unfolds in five subdivisions, so wave (1) of wave ((3)) can start any time post completion of wave (C) of wave ((2)).
Note: This analysis is based on a specific interpretation of the Elliott Wave pattern. Other analysts might have different interpretations. It's crucial to use multiple tools and indicators to confirm your analysis.
Additional Considerations:
Fundamental Analysis: Consider factors like company earnings, industry trends, and economic indicators to support your technical analysis.
Risk Management: Always use stop-loss orders to limit your potential losses.
Diversification: Don't put all your eggs in one basket. Diversify your investments across different assets.
Remember: Elliott Wave analysis is a complex tool that requires practice and experience. It's essential to approach it with caution and always consider the potential risks involved in trading.
I am not Sebi registered analyst.
My studies are for educational purpose only.
Please Consult your financial advisor before trading or investing.
I am not responsible for any kinds of your profits and your losses.
Most investors treat trading as a hobby because they have a full-time job doing something else.
However, If you treat trading like a business, it will pay you like a business.
If you treat like a hobby, hobbies don't pay, they cost you...!
Hope this post is helpful to community
Thanks
RK💕
Disclaimer and Risk Warning.
The analysis and discussion provided on in.tradingview.com is intended for educational purposes only and should not be relied upon for trading decisions. RK_Charts is not an investment adviser and the information provided here should not be taken as professional investment advice. Before buying or selling any investments, securities, or precious metals, it is recommended that you conduct your own due diligence. RK_Charts does not share in your profits and will not take responsibility for any losses you may incur. So Please Consult your financial advisor before trading or investing.