Decentraland: Where Are the Bulls?Decentraland’s MANA has recently struggled to sustain the upward momentum of wave iii in orange. Nonetheless, our primary scenario remains that this move should eventually push the altcoin above the $0.40 resistance level. Overall, we anticipate the full five-wave orange sequence could extend beyond the next key threshold at $0.85 before the larger blue wave (i) reaches its peak. Conversely, our 25% likely alternative scenario still allows for a new wave corrective low below the $0.19 support.
📈 Over 190 precise analyses, clear entry points, and defined Target Zones - that's what we do (for more: look to the right).
Waveanalyses

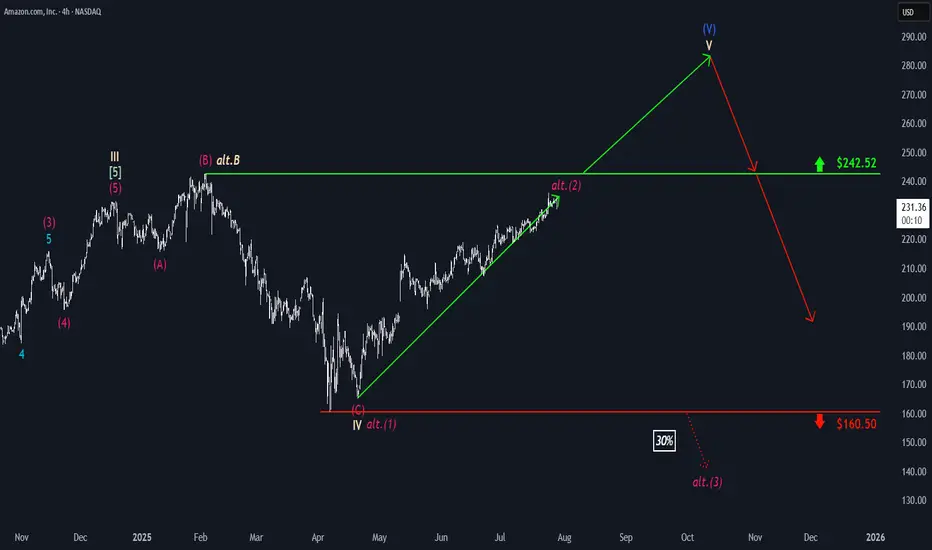
Amazon: Extending the Rally...Amazon maintaines its strong upward momentum. As this trend continues, the large blue wave (V) is expected to complete well above the resistance level at $242.52. However, an alternative scenario with a 30% probability remains on the table: in this case, the magenta corrective wave alt.(2) would peak below the $242.52 resistance, and a significant pullback below support at $160.50 would be anticipated afterward. In this scenario, the high of beige wave alt.B would have been set at $242.52, after which the stock would enter the broader downward movement of wave alt.C .
📈 Over 190 precise analyses, clear entry points, and defined Target Zones - that's what we do (for more: look to the right).
XRP: PullbackRipple’s XRP has once again seen a significant pullback since last Monday, raising the possibility that the high of turquoise wave B may already be in. For now, however, we continue to allow room for this corrective move to extend up to resistance at $4.09, before turquoise wave C drives the altcoin lower toward the magenta wave (2) low. With XRP still trading well above the $0.38 support level, the next upward impulse—magenta wave (3)—should then begin to take shape. Alternatively, there is a 33% chance that this bullish move has already started; however, this scenario would only be confirmed by a decisive break above the $4.09 level.
📈 Over 190 precise analyses, clear entry points, and defined Target Zones - that's what we do (for more: look to the right).

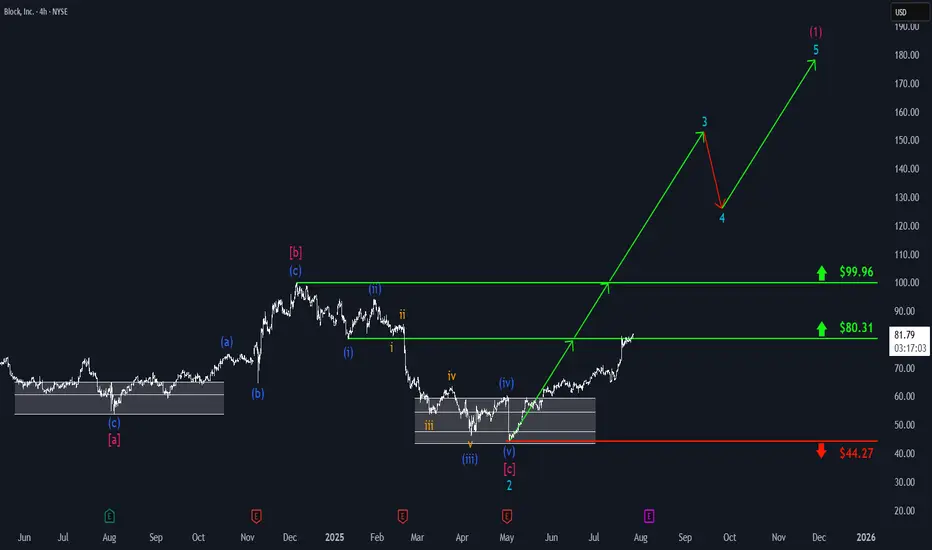
Block: Key Resistance HitBlock has made a strong upward move, reaching resistance at $80.31. Thanks to this positive momentum in our primary scenario, we fully focus on further gains as part of turquoise wave 3, which is expected to push the price decisively above the next resistance at $99.96. The subsequent pullback in wave 4 should also occur above this level, before wave 5 ultimately completes magenta wave (1) – marking the first major leg up in the ongoing bullish impulse.
📈 Over 190 precise analyses, clear entry points, and defined Target Zones - that's what we do (for more: look to the right).
Visa: Waiting in the Wings Visa has entered a phase of sideways consolidation — but this does not affect our primary scenario. We continue to see the stock moving within magenta wave , which is expected to complete the larger turquoise wave 4 inside our turquoise Target Zone between $308.09 and $292.19. After that, we anticipate a renewed upward impulse. Turquoise wave 5 should then push the stock beyond the resistance levels at $375.51 and $394.49. Meanwhile, we are keeping two alternatives on our radar. The first has a 35% probability and assumes the correction is already over, meaning turquoise wave alt.4 is complete. The second is a more bearish scenario (32% probability) visible on the daily chart. It suggests that the high of green wave alt. may already be in, which would imply that the ongoing alt. wave is headed toward a lower low below the $234.30 support level.
📈 Over 190 precise analyses, clear entry points, and defined Target Zones - that's what we do (for more: look to the right).

S&P500: Rally ContinuesYesterday, the S&P 500 managed to notch modest gains once again. In line with our primary scenario, the ongoing magenta wave (B) is likely to continue climbing toward resistance at 6,675 points. Once this corrective upswing reaches its peak—still below that level—we anticipate a pullback as part of wave (C), which should drive the index below support at 5,127 points. Beneath this threshold, our green long Target Zone spans from 4,988 to 4,763 points. We expect the low of wave (C) and the conclusion of the broader green wave to occur within this range. From there, a sustained rally is expected to unfold in wave , which should lift the index above resistance at 6,675 points and complete the cyclical blue wave (III). As a result, this price range can be considered for long entries. The alternative scenario, which calls for a direct breakout above the 6,675-point level without a prior pullback, remains in play with a 40% probability.
📈 Over 190 precise analyses, clear entry points, and defined Target Zones - that's what we do (for more: look to the right).

ETH: Eyes Resistance, But Correction Still LoomsEthereum has also seen a modest pullback since yesterday morning, but here too, it’s too soon to confirm a high for turquoise wave B. Accordingly, we anticipate further gains in this corrective rally—potentially up to resistance at $4,107—before the subsequent turquoise wave C takes over and drives the price down into the green long Target Zone ($935.82–$494.15). Within this range, we primarily expect the low of the wave- correction, which has now lasted more than four years, setting the stage for a long-term trend reversal to the upside. According to to our alternative scneario, magenta wave alt.(1) would complete with the next high. The following pullback, attributed to wave alt.(2), would then only extend into the slightly adjusted magenta Target Zone ($2,622–$1,914) before a move to new all-time highs (probability: 35%).
📈 Over 190 precise analyses, clear entry points, and defined Target Zones - that's what we do (for more: look to the right).

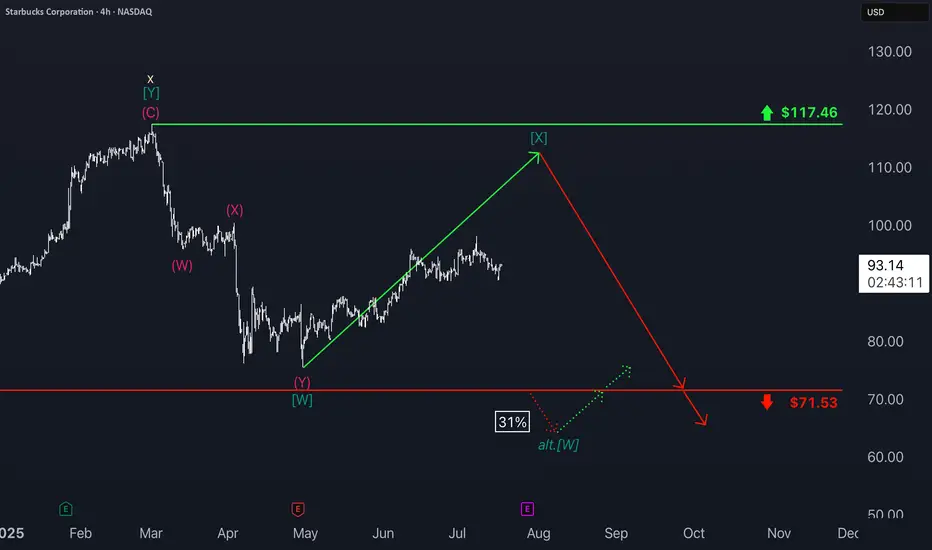
Starbucks: Sideways Trend Continues Starbucks shares have remained in a sideways range over the past two weeks. This does not alter our primary outlook: We continue to see the stock in the dark green wave , which is expected to peak near the resistance level at $117.46. After reaching this high, we anticipate a move lower, with the stock dropping below the support at $71.53. However, since the intermediate high has not yet been established, an alternative scenario remains on the table: With a 31% probability, the dark green wave alt. could take hold first, driving the price below the $71.53 mark ahead of schedule.
📈 Over 190 precise analyses, clear entry points, and defined Target Zones - that's what we do (for more: look to the right).
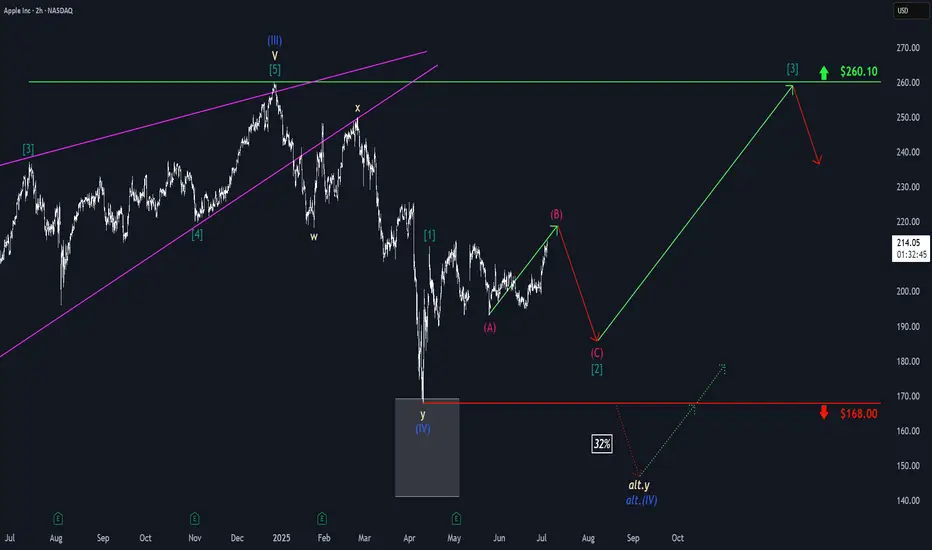
Apple: Consolidation Before Potential Breakout Toward $260Apple shares have recently pulled back into a consolidation phase. We see further upside potential in magenta wave (B) before a pullback occurs as part of the same-colored wave (C), which is expected to target the low of green wave . After that, we anticipate a new upward move: Green wave should take over—remaining above support at $168—and drive the stock toward the next major resistance at $260.10. However, if the price drops back below the $168 support level, our alternative scenario comes into play: in that case, we would expect a lower low for blue wave alt.(IV), with a probability of 32%.
📈 Over 190 precise analyses, clear entry points, and defined Target Zones - that's what we do (for more: look to the right).

Netflix: Hovering Just Below Key Target ZoneNetflix has rebounded over the past two sessions after falling below the beige Short Target Zone ($1,270–$1,432) and is now trading just beneath it. A renewed push into this range could complete turquoise wave 3, followed by a corrective wave 4 likely dipping below $1,180. Alternatively, with a 33% probability, turquoise wave alt.3 may already have peaked, opening the door for an immediate drop through $1,180. A broader correction in beige wave IV is expected once wave III concludes, before upside resumes in wave V.
📈 Over 190 precise analyses, clear entry points, and defined Target Zones - that's what we do (for more: look to the right).

Tesla: Still Pointing LowerTesla shares have recently staged a notable rebound, gaining approximately 10%. However, under our primary scenario, the stock remains in a downward trend within the turquoise wave 5, which is expected to extend further below the support level at $215.01 to complete the magenta wave (3). This move is part of the broader beige wave c. However, if the stock continues to rally in the near term and breaks through resistance at $373.04 and $405.54, we would need to consider that wave alt.(II) in blue has already been completed (probability: 38%).
📈 Over 190 precise analyses, clear entry points, and defined Target Zones - that's what we do (for more: look to the right).

₿itcoin: Pushing Higher—But Watch for a Reversal AheadAfter taking a brief pause over the weekend, Bitcoin resumed its upward momentum early this morning, trading within the blue Target Zone between $117,553 and $130,891. This marks the first time the cryptocurrency giant has traded above the key $120,000 level. Within this zone, and in line with our primary scenario, we continue to anticipate the peak of the corrective wave B rally, followed by a trend reversal to the downside. We expect a significant wave C decline, targeting the lower blue zone between $62,395 and $51,323. As such, prices in the upper blue Target Zone may present an opportunity to take (partial) profits on existing long positions and, where appropriate, to initiate potential short positions as a hedge. These shorts could be protected with a stop 1% above the upper boundary of the zone, given there remains a 35% probability that Bitcoin could break directly above the $130,891 resistance and set a new high as blue wave alt.(i).
📈 Over 190 precise analyses, clear entry points, and defined Target Zones - that's what we do.

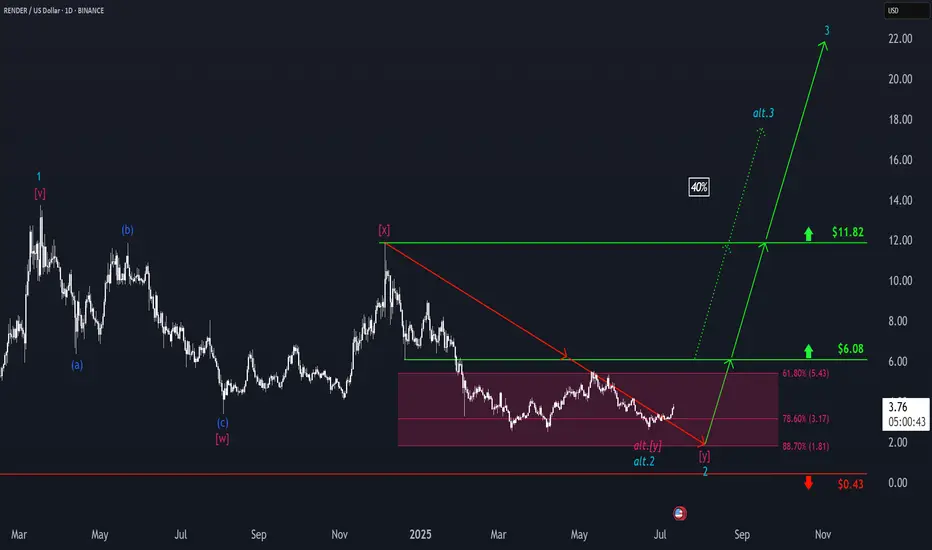
RENDER: Is the Correction Over?RENDER has surged nearly 20% at its peak recently. This prompts the question of whether the wave 2 correction low may already be in place. We continue to consider this scenario as our alternative outlook, in which we would anticipate direct gains above the resistance levels at $6.08 and $11.82 (probability: 40%). However, our primary expectation remains that a new low will be set within our magenta Target Zone (coordinates: $5.43–$1.81) before the projected upward moves unfold.
📈 Over 190 precise analyses, clear entry points, and defined Target Zones - that's what we do.
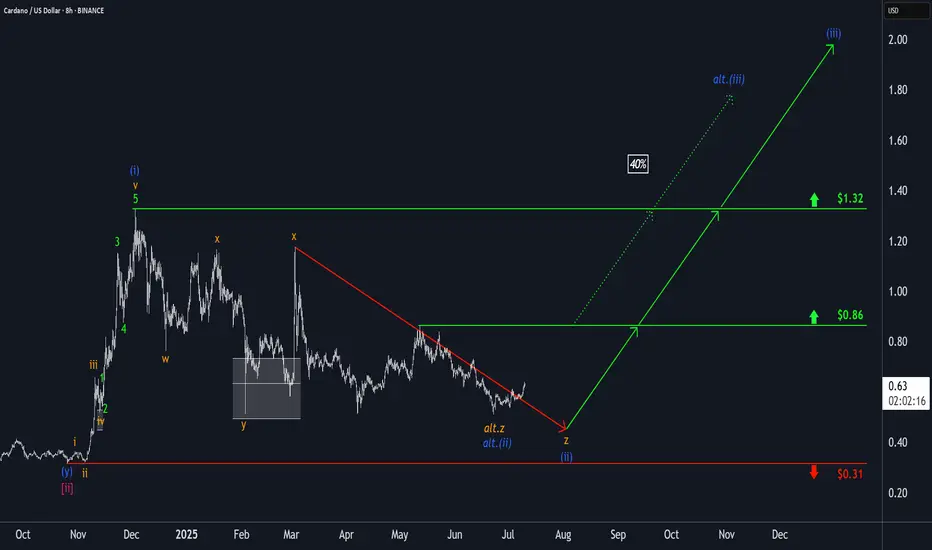
Cardano: Eyeing Alternative Rally ScenarioCardano’s ADA token has realized further gains. As a result, we’ve increased the probability of our alternative scenario—in which the low of the wave (ii) correction is already in place—to 40%. For ADA to take this “shortcut,” the next step would be to break above resistance at $0.86, followed by a move past the $1.32 level. For now, however, we’re maintaining our primary outlook and are preparing for a new low in blue wave (ii). In this scenario, the price should hold above support at $0.31.
📈 Over 190 precise analyses, clear entry points, and defined Target Zones - that's what we do.
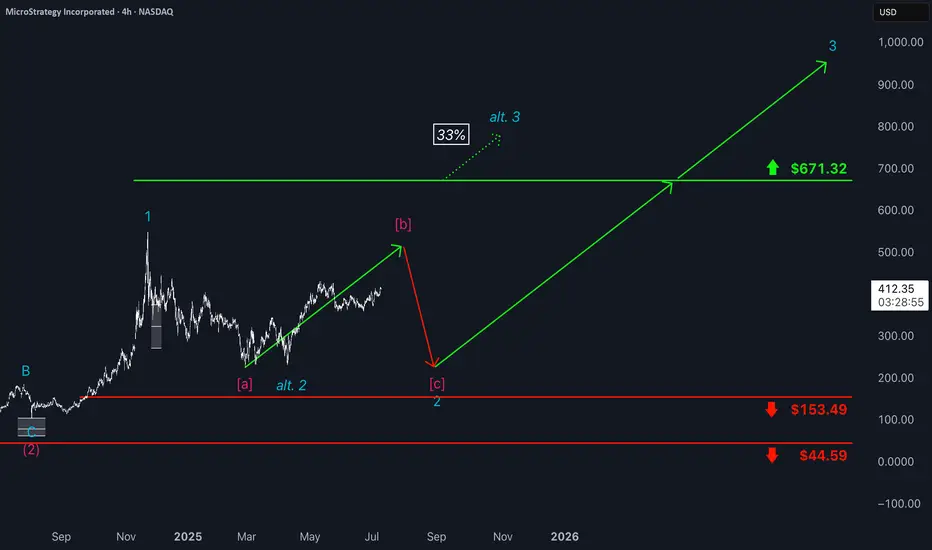
Microstrategy: Renewed Upside MicroStrategy has continued to face downward pressure recently but is now showing more decisive signs of an upward move. We still see greater upside potential in the current magenta wave , though we expect the peak to form below resistance at $671.32. Afterward, the bearish wave should complete turquoise wave 2—while still holding above support at $153.49. Wave 3 should then usher in a longer upward phase, with momentum likely to ease only well above the $671.32 level. At the same time, there remains a 33% probability that the stock has already entered this upward phase. In that scenario, turquoise wave alt. 2 would already be complete, and the price would move directly above $671.32 as part of wave alt. 3.
📈 Over 190 precise analyses, clear entry points, and defined Target Zones - that's what we do.
₿itcoin: ATHBitcoin recently marked a new all time high. Our primary expectation is for an even bigger breakout to the upside, allowing green wave B to reach its peak within the upper blue Target Zone between $117,553 and $130,891. After this corrective high, we anticipate a sharp sell-off during green wave C, which should drive Bitcoin down into the lower blue Target Zone between $62,395 and $51,323—where we also expect the low of the larger orange wave a. This move should, for now, signal the start of another corrective rally along orange wave b, with a retest of the freshly marked all-time high well within reach. Once this countertrend move concludes, another significant decline should follow as orange wave c develops, targeting the low of the higher-level blue wave (ii). Alternatively, there remains a 30% chance that the preceding wave alt.(i) is still in progress, which could result in a direct breakout above resistance at $130,891.
📈 Over 190 precise analyses, clear entry points, and defined Target Zones - that's what we do.

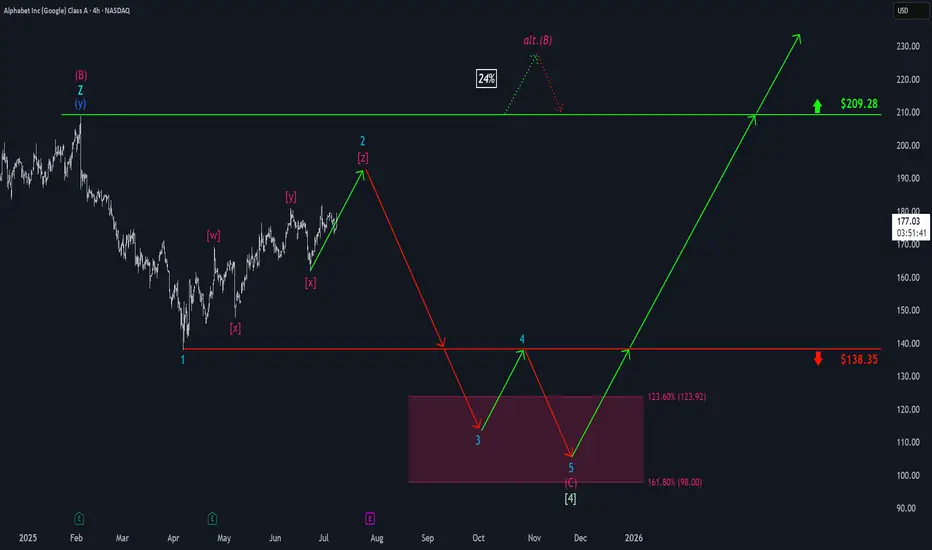
Google: Upcoming TopWe locate Google in turquoise wave 2 (of a downward impulse). In more detail, we see the stock developing a complex - - - pattern and expect turquoise wave 2 to conclude imminently with wave . All the while, the price should maintain a safe distance from resistance at $209.28. Looking ahead to turquoise wave 3, we anticipate sell-offs down into our magenta Target Zone between $123.92 and $98, before wave 4 likely triggers a temporary rebound up to the $138.35 level. Ultimately, the entire turquoise downward impulse should bottom out again in the magenta zone, which would also mark the completion of waves (C) in magenta and in green. Since a new larger upward phase should begin afterward, the magenta zone presents an opportunity to establish long positions. However, if Google were to break above the $209.28 resistance next, we would have to expect a new high for magenta wave alt.(B) —which would only temporarily postpone the anticipated sell-off though (probability: 24%).
📈 Over 190 precise analyses, clear entry points, and defined Target Zones - that's what we do.
Airbnb: Downtrend Set to Resume SoonSince our last update, Airbnb has experienced a rebound, which diverted the stock from the anticipated sell-off. However, the price is expected to soon resume its downward trajectory and, as the next key step, break through support at $108.60. This move should complete turquoise wave 3, with all subsequent waves of this downward impulse likely to unfold below this level. Ultimately, the stock is expected to finish the broader correction of the beige wave II.
📈 Over 190 precise analyses, clear entry points, and defined Target Zones - that's what we do.

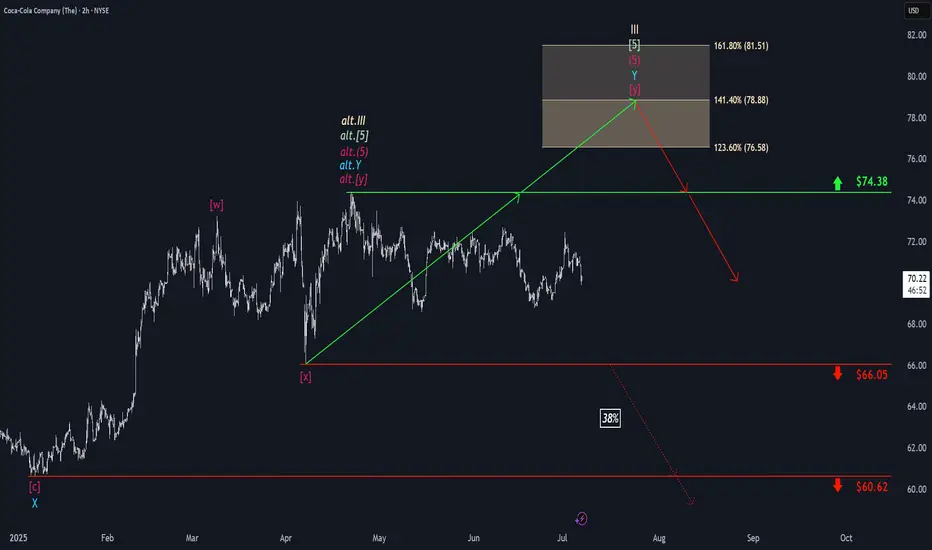
Coca-Cola: Nearing Final Wave III HighDespite recent sell-offs, we still expect Coca-Cola to reach a final high of magenta wave within our beige Target Zone between $76.58 and $81.51, which should also mark the completion of the broader beige wave III. However, an alternative scenario—with a 38% probability—remains in play: in this case, the top of beige alt.III would have already occurred, and a direct decline below $60.62 would likely follow. In either scenario, once the high of beige wave III is established, we anticipate a significant correction.
📈 Over 190 precise analyses, clear entry points, and defined Target Zones - that's what we do.
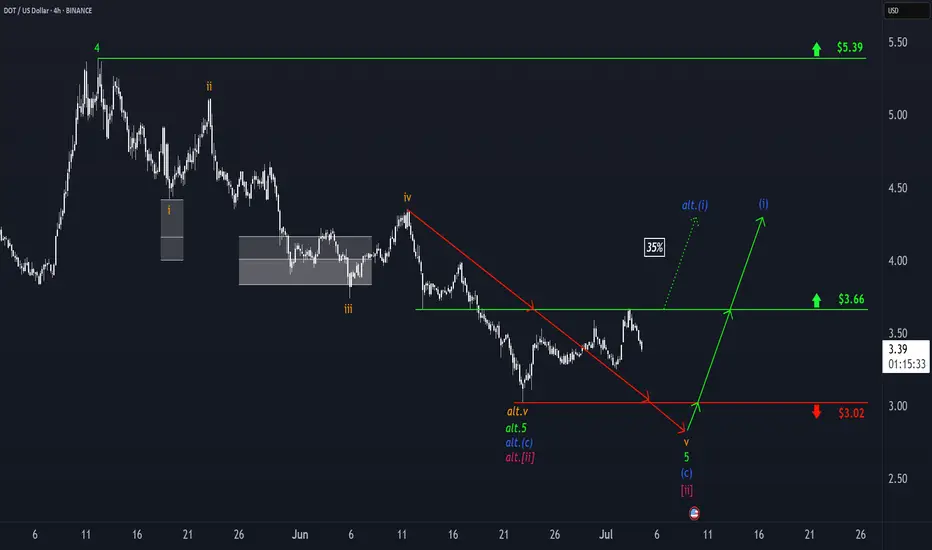
Polkadot: Bottom Already in?Given Polkadot’s recent sharp rebound toward resistance at $3.66, we consider it 35% likely that magenta wave alt. has already bottomed at $3.02. This would be confirmed by a meaningful breakout above said $3.66 level. Our primary scenario, however, still calls for lower lows as part of wave – with a break below the same $3.02 support.
📈 Over 190 precise analyses, clear entry points, and defined Target Zones - that's what we do.
Ethereum: Eyeing New Highs?Ethereum has surged recently and continues rising in turquoise wave B. The next target is a break above the June high, with potential upside to resistance at $4,107. A direct breakout above this level (27% probability) would suggest green wave alt. ended in April. However, our main scenario expects a reversal below $4,107, with turquoise wave C likely dragging ETH into the Long Target Zone between $935.82 and $494.15 to complete wave .
📈 Over 190 precise analyses, clear entry points, and defined Target Zones - that's what we do.

Apple: More Room to RunWe still allow more room for Apple’s magenta wave (B) to extend upward before wave (C) takes over, pulling the stock toward the low of green wave . Thereafter, green wave should start (above $168) and initiate the next advance, lifting the stock toward resistance at $260.10. A break below $168, however, would activate our alternative scenario, in which blue wave alt.(IV) targets a deeper low (32% probability).
📈 Over 190 precise analyses, clear entry points, and defined Target Zones - that's what we do.
NVIDIA: More Room in Wave BNvidia’s strong rally over recent weeks lifted the stock above resistance at $153.13. Despite a brief pullback on Tuesday, we still expect beige wave B to extend toward $178.39. Afterward, beige wave C should initiate a substantial correction, likely finding its low above $81.98 to complete blue wave (IV). If Nvidia rallies directly through $178.39, that would support our alternative view that blue wave alt.(IV) has already bottomed (37% probability).
📈 Over 190 precise analyses, clear entry points, and defined Target Zones - that's what we do.
