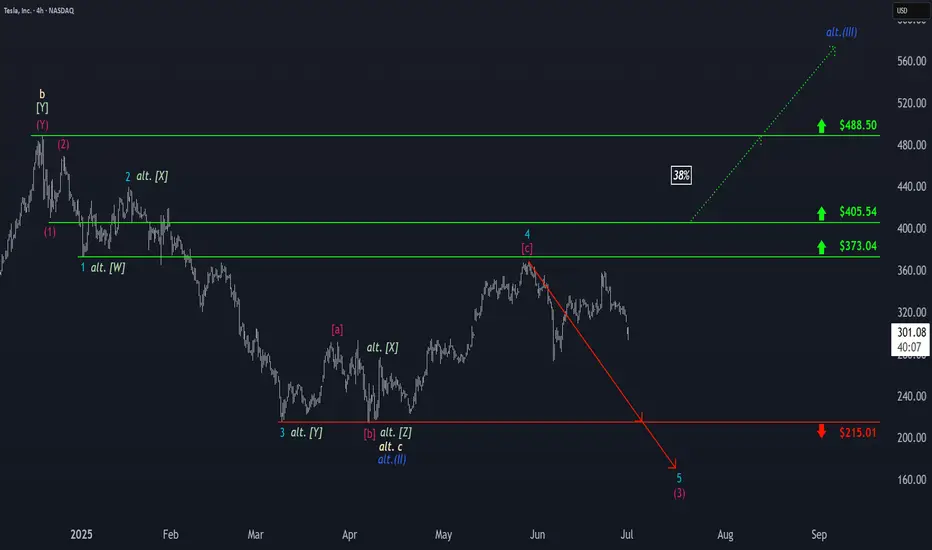
Tesla: Back on Track?Tesla has resumed downward momentum, aligning with our primary scenario and moving away from resistance at $373.04. As part of the ongoing turquoise wave 5, we expect continued selling pressure: it should break below the $215.01 support. This would complete magenta wave (3) of the current bearish impulse. A reversal back above $373.04 – and especially a breach of $405.54 – would force us to adopt the 38% likely alternative scenario. Under this count, the correction low of blue wave alt.(II) would be already in, and Tesla would now be rallying in wave alt.(III) .
📈 Over 190 precise analyses, clear entry points, and defined Target Zones - that's what we do.
Waveanalyses
NASDAQ: Minor Pullback, Still on TrackOn Friday, the Nasdaq experienced a slight pullback, which was quickly absorbed at the start of the week. Currently, the index is still developing the turquoise wave B, which should top out just below resistance at 23,780 points, signaling the start of the bearish wave C. This move should lead to the low of the magenta wave (4) within our turquoise Target Zone between 17,074 and 15,867 points. Alternatively, there is a 42% probability that wave alt.(4) is already complete. In this scenario, the magenta wave alt.(5) could carry the index immediately above the mentioned resistance.
📈 Over 190 precise analyses, clear entry points, and defined Target Zones - that's what we do.

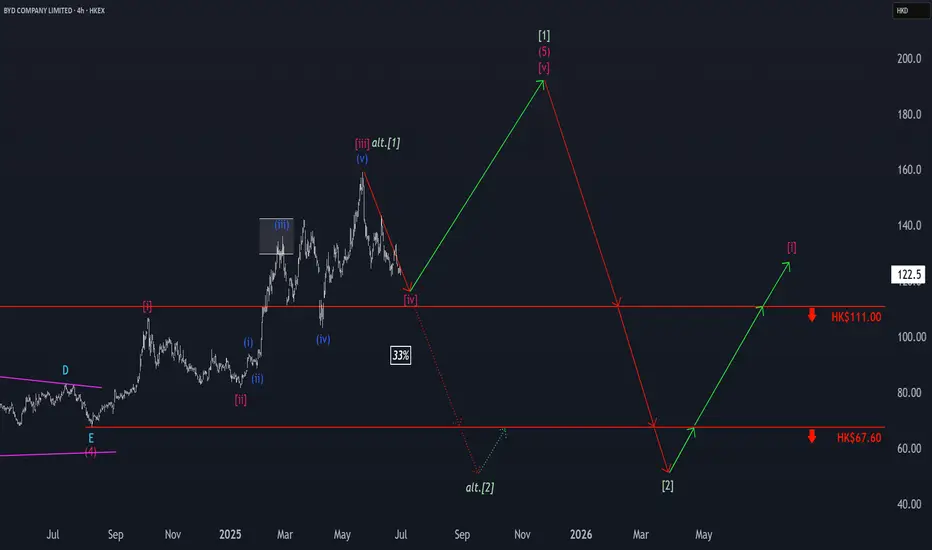
BYD: Heading for the Low!BYD remains on a downward trajectory, with the current leg expected to carve out the low of magenta wave while staying above key support at HK$111. Under our primary scenario, this level should trigger a strong upward reversal, which should set the stage for the completion of the broader green wave . Only after this upside move do we expect a deeper correction, which should eventually break through support at HK$111 and HK$67.60 to form the low of green wave . That said, we can’t rule out an earlier breakdown. There’s a 33% probability that the high of green wave alt. is already in. In this case, the price could breach support sooner, suggesting the low of wave alt. may form ahead of schedule.
📈 Over 190 precise analyses, clear entry points, and defined Target Zones - that's what we do.
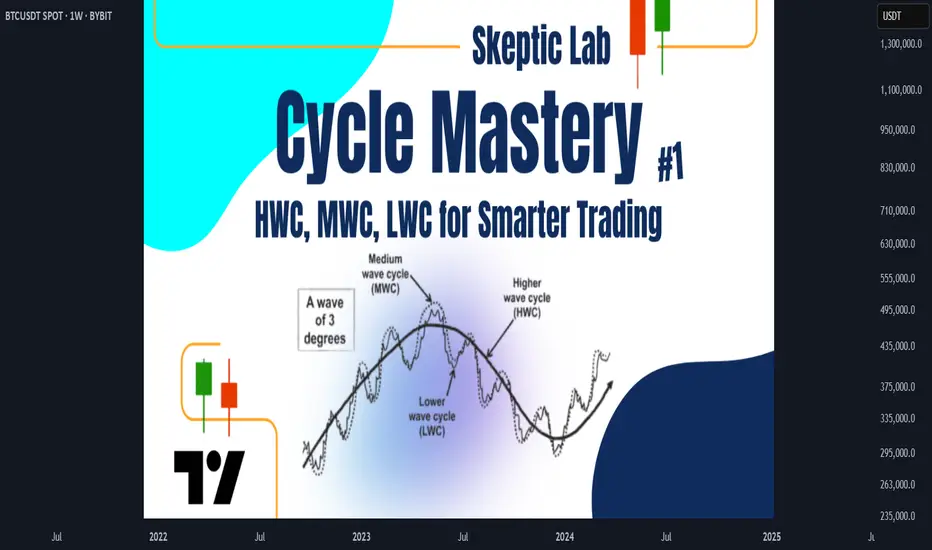
Skeptic| Cycle Mastery Part 1: HWC, MWC, LWC for Smarter TradingUnderstanding Higher Wave Cycle ( HWC ), Minor Wave Cycle ( MWC ), and Low Wave Cycle ( LWC ) is the key to making informed trading decisions, simplifying when to go long , short , or stay out . This Part 1 masterclass introduces these cycles, their relative nature, and how to align them with your strategy for precise entries and effective risk management . Let’s break it down. 📊
The Three Cycles: HWC, MWC, LWC
We trade across three market cycles:
HWC (Higher Wave Cycle) : The big-picture trend, like Bitcoin’s yearly uptrend.
MWC (Minor Wave Cycle): A medium-term trend, often an uptrend or corrective phase within the HWC.
LWC (Low Wave Cycle): The short-term daily trend, which can be range-bound, uptrend, or downtrend.
Knowing these cycles helps you decide when to e nter long, short, or avoid trading altogether, ensuring you align with the market’s rhythm.
Defining Your Cycles: It’s Relative
The main question before diving in: What timeframes are HWC, MWC, and LWC? The answer is relative—it depends on your strategy. Think of it like a temperature scale: 0°C isn’t “no heat” but a reference point (water’s freezing point). Similarly, your cycles are defined by the largest timeframe you analyze:
HWC: Your highest timeframe (e.g., Weekly for long-term traders).
MWC: The next level down (e.g., Daily).
LWC: Your shortest timeframe (e.g., 4-Hour or 1-Hour).
Ask yourself: What’s the largest timeframe I check? Set your HWC there, then scale down for MWC and LWC based on your trading style. This relativity ensures your cycles fit your unique approach.
While shorter cycles (LWC, MWC) form the HWC, the HWC’s power dominates, influencing smaller cycles. Let’s explore how to trade based on these relationships.
Trading Scenarios: When to Act
Scenario 1: HWC Uptrend, MWC Range
When the HWC is in an uptrend and the MWC is range-bound:
Action: Enter a long position on the first MWC wave when the LWC breaks the ceiling of the MWC range (e.g., a box breakout).
Why? The HWC’s bullish power supports the move, likely triggering an MWC uptrend. This makes the first wave a strong, low-risk entry.
Example: If the LWC (e.g., 4-hour) breaks the MWC range ceiling with a strong candle, you can confidently go long, backed by the HWC uptrend.
Scenario 2: HWC Downtrend, MWC Range
When the HWC is in a downtrend and the MWC is range-bound:
Action: Skip the first MWC wave. If the LWC breaks the MWC range ceiling, avoid going long—the bearish HWC could reject the move, resuming its downtrend.
Wait for the Second Wave: Let the MWC return to a range after the first wave. If the LWC breaks the range ceiling again, go long with confidence—the HWC’s influence is less likely to disrupt this second wave.
Risk Management Tips (if you trade the first wave against the HWC):
Reduce Risk: Lower your position size to minimize exposure.
Take Profits Early: Close the position or secure most profits (e.g., scale out) once you hit your R/R target, as volatility is high.
Wider Stop-Loss: Set a larger stop-loss to account for potential HWC-driven reversals, as stop-loss hunts are common in this scenario.
Adjusting Stop-Loss Size Based on Cycles
Aligned Cycles (HWC, MWC, LWC in Same Direction): When all three cycles align (e.g., all uptrend), set a tighter stop-loss relative to market conditions. Gradually scale out profits instead of closing the position, as the trend’s strength supports higher R/R (e.g., 5 or 10).
HWC Against MWC/LWC: If the HWC opposes the other cycles (e.g., HWC downtrend, MWC/LWC uptrend), use a wider stop-loss. The HWC’s power could reverse the LWC, lowering your win rate if stops are too tight. Expect volatility and plan accordingly.
Final Vibe Check
This Cycle Mastery Part 1 equips you to time MWC waves with precision, aligning HWC, MWC, and LWC for smarter entries. By mastering when to trade the first or second wave, you’ll avoid traps and maximize your edge. Part 2 will dive deeper with examples—stay tuned! At Skeptic Lab, we trade with no FOMO, no hype, just reason. Protect your capital—stick to 1%–2% risk per trade. Want Part 2 or another topic? Drop it in the comments! If this guide sharpened your game, hit that boost—it fuels my mission! 😊 Stay disciplined, fam! ✌️
💬 Let’s Talk!
How will you time your MWC waves? Share your thoughts in the comments, and let’s crush it together!
S&P500: Target Zone DeactivatedThe S&P 500 extended its bullish trend yesterday, moving beyond our now-deactivated (formerly magenta) Target Zone. Existing positions remain intact, as the stop set 1% above the upper boundary has not been triggered. In our updated primary scenario, we anticipate continued upward movement within magenta wave (B), potentially reaching the resistance at 6675 points. Once this peak is established, we expect a corrective decline to begin in the form of wave (C), which should guide the index into the green Long Target Zone between 4988 and 4763 points. There, the larger green wave is expected to complete. A sustained breakout above the 6675-point level would shift the outlook in favor of the alternative scenario. In that case, green wave alt. would be considered complete—a trajectory we currently assign a probability of 40%.
📈 Over 190 precise analyses, clear entry points, and defined Target Zones - that's what we do.

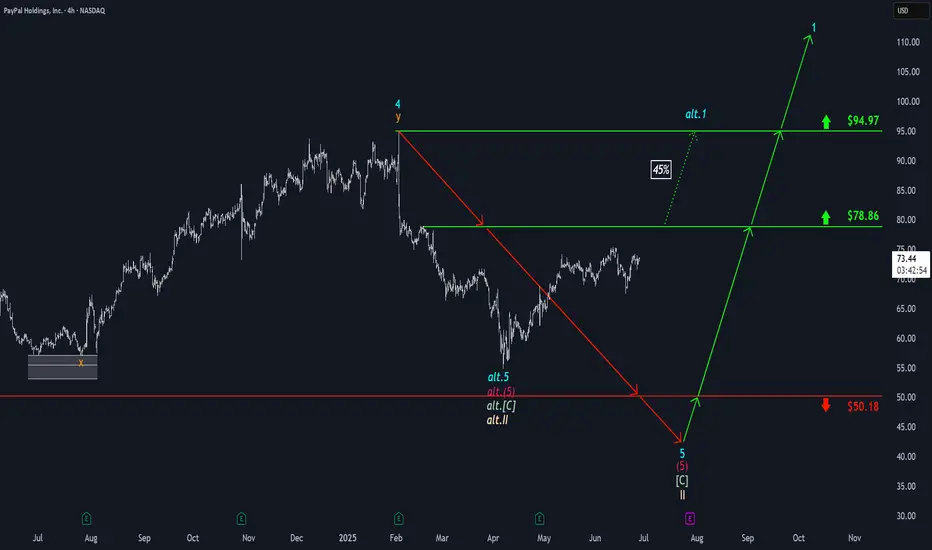
PayPal: Bears Losing Control – AgainPayPal (PYPL) has faced renewed downside pressure since our last update, but the bears failed to maintain control for long. The stock quickly rebounded toward key resistance at $78.86. If this level is decisively breached, we will consider the broader correction complete with the alternative low of beige wave alt.II. This would position the stock in the early stages of a new bullish impulse – wave alt.1 – with a 45% probability assigned to this scenario. However, under our primary scenario, we still envision wave II reaching its regular low below support at $50.18. Thus, renewed selling pressure is expected to push the price beneath that level in the near term. Once the low is in place, we reckon with a new impulsive advance.
📈 Over 190 precise analyses, clear entry points, and defined Target Zones - that's what we do.
Nasdaq: At the Upper EdgeYesterday, the Nasdaq climbed above resistance at 22,475 points. Currently, the index is positioned outside our turquoise Target Zone (coordinates: 21,751 – 22,425 points), which remains active. Stops for short positions 1% above the zone have not yet been triggered. Our primary scenario remains intact for now: technically, there is room for wave B to reach the next resistance at 23,229 points. Following the B-wave peak, a downtrend is expected with the corrective wave C. With a 42% probability, we anticipate that wave alt.(4) is already complete, and the index may break directly higher within the magenta-colored wave alt.(5), surpassing the 23,229-point mark.
📈 Over 190 precise analyses, clear entry points, and defined Target Zones - that's what we do.

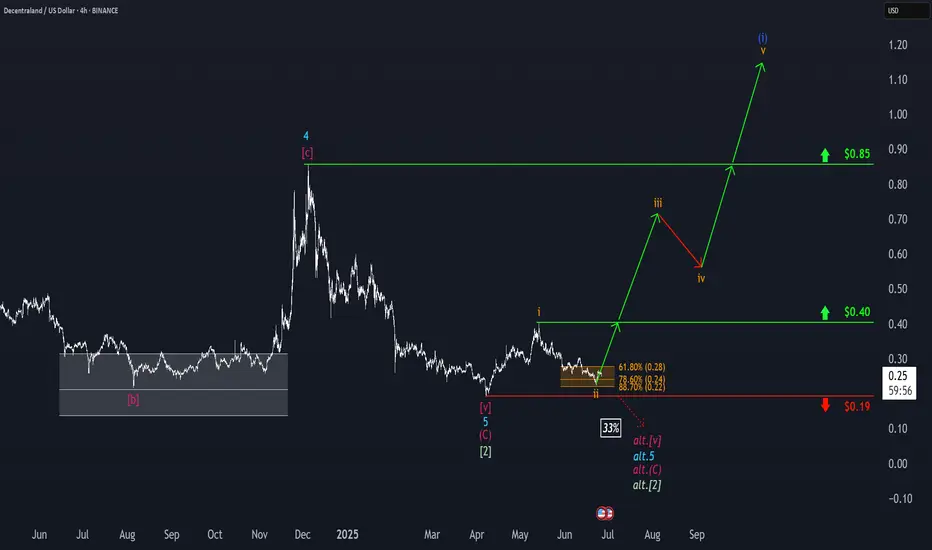
Decentraland: Bottom Confirmed!Decentraland (MANA) has delivered a convincing upward reaction within our orange Target Zone ($0.28 – $0.22), confirming the low of orange wave ii. Under the primary scenario, the token is now advancing in wave iii of the same degree. This leg should propel MANA toward resistance at $0.85, with the full five-wave orange sequence expected to surpass that level before completing blue wave (i). That said, we still assign a 33% probability to the alternative scenario, which would imply one final corrective dip below support at $0.19.
📈 Over 190 precise analyses, clear entry points, and defined Target Zones - that's what we do.
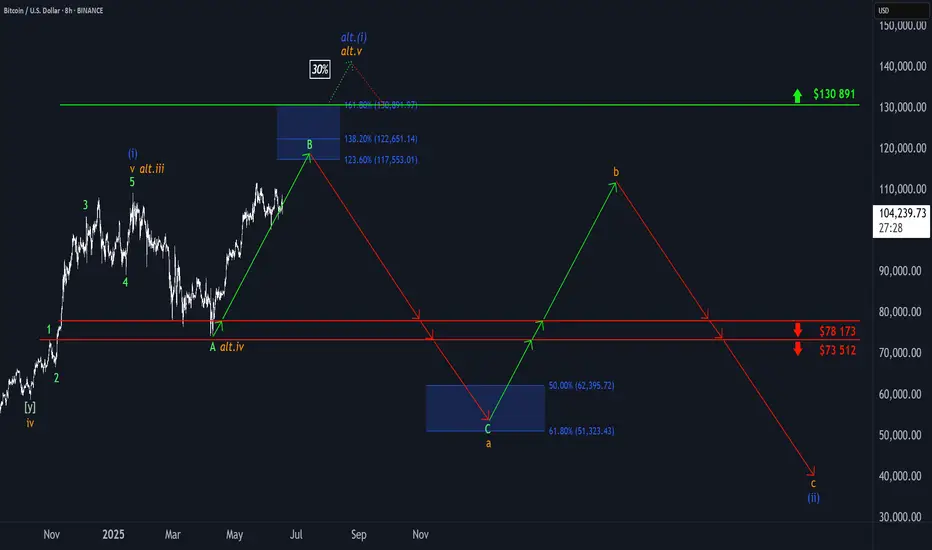
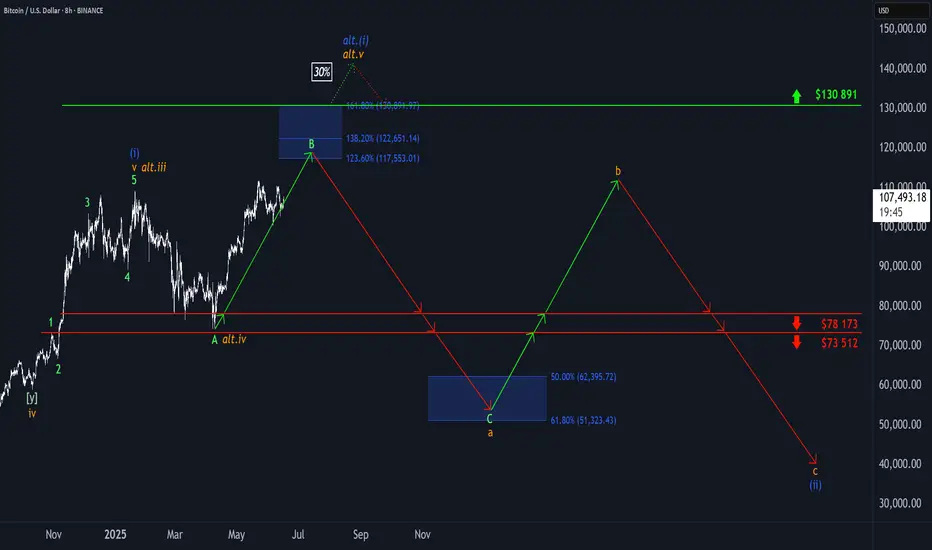
₿itcoin: Grinding higherBitcoin has extended its recent rally, reclaiming the $106,000 level in the last few hours. While short-term setbacks remain possible, our primary scenario continues to point higher: prices should aim for the upper blue Target Zone between $117,553 and $130,891. Within this zone, BTC should complete green wave B before initiating a corrective decline in wave C, which should extend into the lower blue Target Zone between $62,395 and $51,323. At the low of major wave a, a temporary recovery in wave b is likely, preceding the final downward push that should mark the end of the broader wave (ii) correction. Our alternative scenario (30% probability) suggests that Bitcoin remains within blue wave alt.(i). If true, a breakout beyond the upper blue Target Zone could occur.
📈 Over 190 precise analyses, clear entry points, and defined Target Zones - that's what we do.

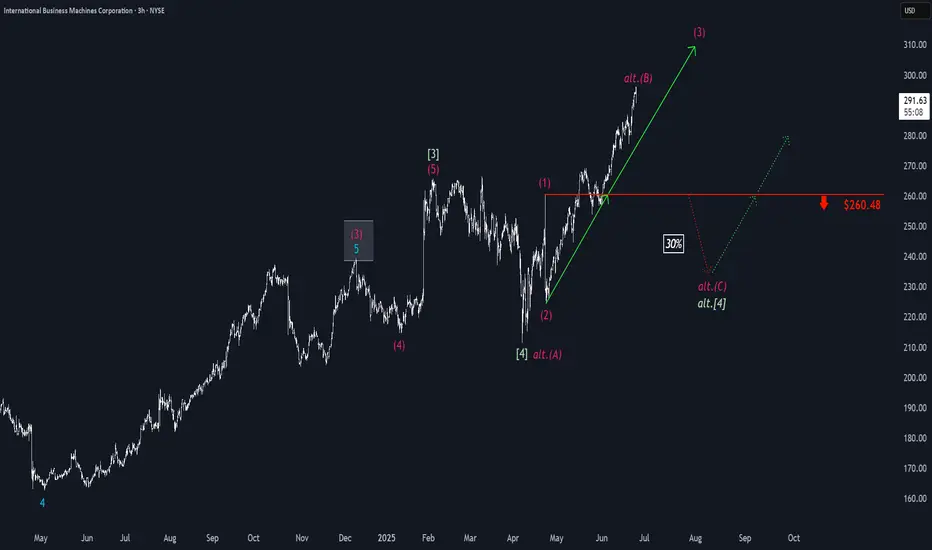
IBM: Still BullishAfter the increases over the recent weeks, we still place IBM within the magenta wave (3) and expect a bit more bullish headroom in the short term. However, in our medium-term alternative scenario, we would see a larger pullback with the green wave alt. . Such a detour is considered 30% likely and would be confirmed by a drop below the support at $260.48.
📈 Over 190 precise analyses, clear entry points, and defined Target Zones - that's what we do.
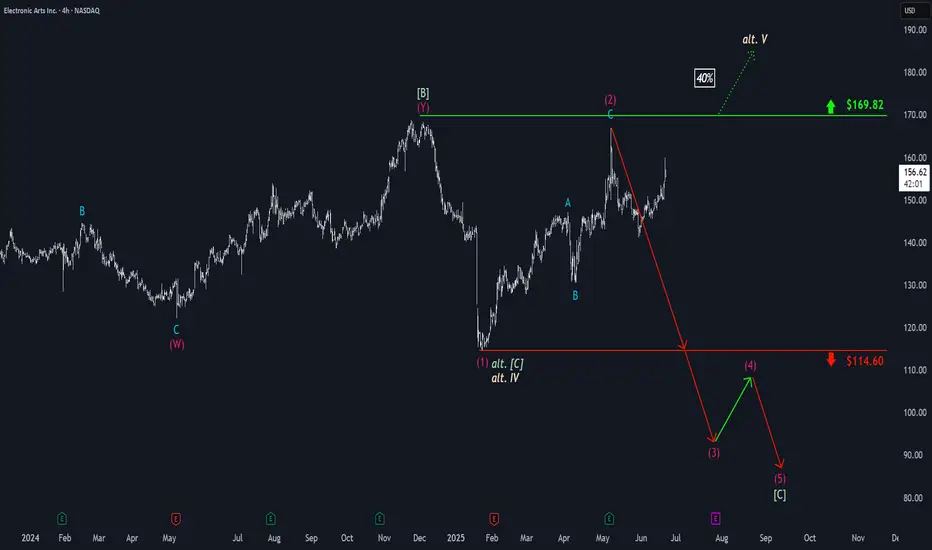
Electronic Arts: Under PressureEA has shown notable upward pressure, diverging from our expected downside continuation. Despite the recent strength, our primary scenario remains valid: we still anticipate an extension of the ongoing magenta five-wave decline, with wave (3) expected to break below support at $114.60. The remaining legs of this impulsive sequence should also stay beneath that threshold, ultimately forming the low of the broader green wave . However, if bullish momentum persists and pushes the stock above resistance at $169.82, we will shift to the alternative scenario (40% probability). This path suggests green wave alt. – and by extension, beige wave alt.IV – has already concluded, and that EA is now in the early stages of wave alt.V, a significant new uptrend.
📈 Over 190 precise analyses, clear entry points, and defined Target Zones - that's what we do.
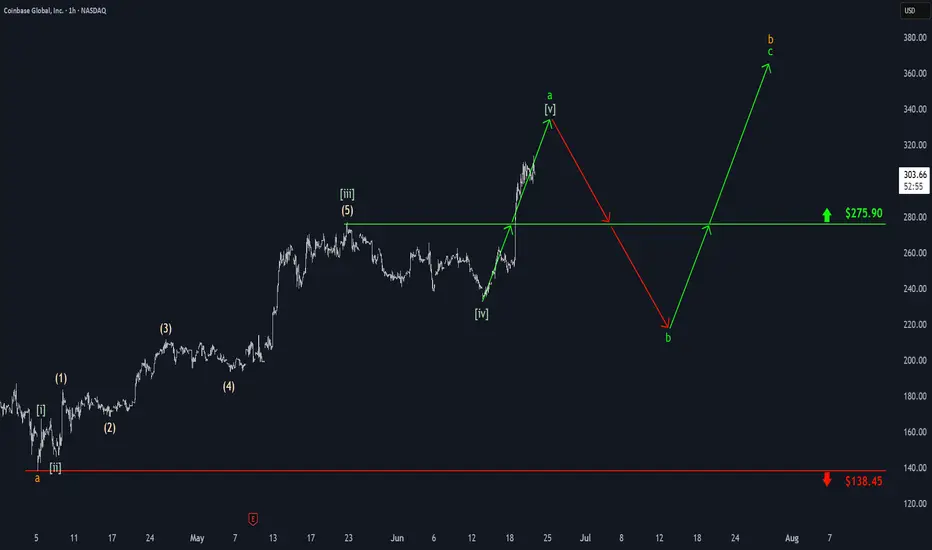
Coinbase: Surging HigherCoinbase has surged sharply above the $275.90 level, prompting us to consider green wave finished. Now, we see the stock advancing in wave , which still has more upside potential to finalize light green wave a. Afterward, we expect a corrective pullback in wave b, which may dip below $275.90, before green wave c resumes the advance, thus completing orange wave b distinctly above $275.90.
📈 Over 190 precise analyses, clear entry points, and defined Target Zones - that's what we do.
₿itcoin: PullbackBitcoin has experienced significant selling since Friday, briefly slipping below the $100,000 mark. We previously mentioned that a sharper pullback wouldn't surprise us. Whether prices will drop a bit further remains to be seen for the moment. Ultimately, we still expect Bitcoin to climb into the upper blue Target Zone (coordinates: $117,553 – $130,891) before a broader C-wave sell-off occurs, pushing the price down to the lower blue Target Zone (coordinates: $62,395 – $51,323). There, we anticipate the low of the larger orange wave a, which should mark the start of another corrective upward move. Afterward, we're preparing for the last downward leg of blue wave (ii). However, if Bitcoin directly surpasses the resistance at $130,891 – and thus our upper blue Target Zone – we'll locate it still in blue wave alt.(i) (30% probability).
📈 Over 190 precise analyses, clear entry points, and defined Target Zones - that's what we do.

ETH: Hardly Any Volatility Not much has happened for Ethereum since yesterday. According to our primary scenario, wave B in turquoise should imminently push higher, theoretically up to resistance at $4,107. Once these corrective rises conclude, wave C should take over, driving ETH down to complete the large green wave in the Target Zone below ($935.82 – $494.15). The low of this multi-year correction should lay the foundation for subsequent wave increases, likely causing new record highs above the $10,000 mark, as the weekly chart suggests. In our alternative scenario, ETH would embark on this bullish journey earlier. Currently at 27% probability, this alternative assumes the corrective low was already established at $1,385, which would imply a direct breakout above $4,107.
📈 Over 190 precise analyses, clear entry points, and defined Target Zones - that's what we do.

GOLD (XAUUSD) – Wave b Complete? Preparing for Wave c RallyGold tapped into the key demand zone and swept sell-side liquidity (SSL) beneath wave (iii) lows.
A five-wave decline appears complete, with wave (v) of b terminating just below the o.618 fib extension at 3344.86.
🟢 Wave c projection now in focus — looking for a 5-wave impulsive rally to develop.
Targeting the Sell Zone between the 0.5–0.764 retracement (3395.87–3425.07).
🧠 Structure Notes:
✅ Imbalance Zone (IMB) formed during the breakdown has now been tapped
🔻 SSL swept + bullish reaction = potential change of state
🟢 Wave (i) and (ii) projection underway – price needs to maintain structure above 3357.43 for bullish continuation
Targets: 3408.81 (0.618 Fib)
Invalidation below: 3340.31
Momentum and RSI divergence support reversal

₿itcoin: Holding steadySince our last update, Bitcoin has traded in a relatively stable range. As expected, there's still a strong case for the crypto leader to climb into the upper blue Target Zone between $117,553 and $130,891. However, a deeper pullback below the $100,000 mark remains a real possibility before that move unfolds. Regardless of the path it takes, we continue to expect Bitcoin to reach this upper zone, completing green wave B. From there, a corrective wave C—also in green—is likely to follow, driving the price down toward the lower blue Target Zone between $62,395 and $51,323. This move would mark the end of the broader orange wave a. For now, we’re watching for a potential b-wave recovery before the final leg lower toward the bottom of blue wave (ii) takes shape. That said, there's still a 30% chance that blue wave (i) isn’t done yet and could extend significantly above $130,891 before any meaningful correction begins.
📈 Over 190 precise analyses, clear entry points, and defined Target Zones - that's what we do.

Amazon: Continuing to RiseWith Amazon’s recent climb, prices are edging closer to the top of wave (1) in magenta. However, there is still a bit of upside potential in the short term before wave (2) makes its corrective move. Our primary scenario does not anticipate a new low below $160.50. Instead, we expect wave (3) in magenta to eventually surpass resistance at $242.52. Under our alternative scenario, there is a 30% chance we could see new lows below $160.50. In this case, wave alt.B in beige would have peaked at $242.52, prompting us to focus on a magenta downward impulse.
📈 Over 190 precise analyses, clear entry points, and defined Target Zones - that's what we do.

₿itcoin: SetbackBitcoin has come under selling pressure in recent hours. We cannot rule out that a deeper dip may precede the next leg higher into the upper blue Target Zone between $117,553 and $130,891. Once green wave B concludes in this range, we anticipate a wave C decline into the lower blue Target Zone between $62,395 and $51,323 to complete the larger orange wave a. From there, a corrective rally in orange wave b is expected, which should set the stage for a final leg lower to finalize blue wave (ii). Meanwhile, we’re still monitoring the alternative scenario (30% probability), in which blue wave alt.(i) is still in progress. In this case, BTC would stage an immediate breakout above resistance at $130,891.
📈 Over 190 precise analyses, clear entry points, and defined Target Zones - that's what we do.

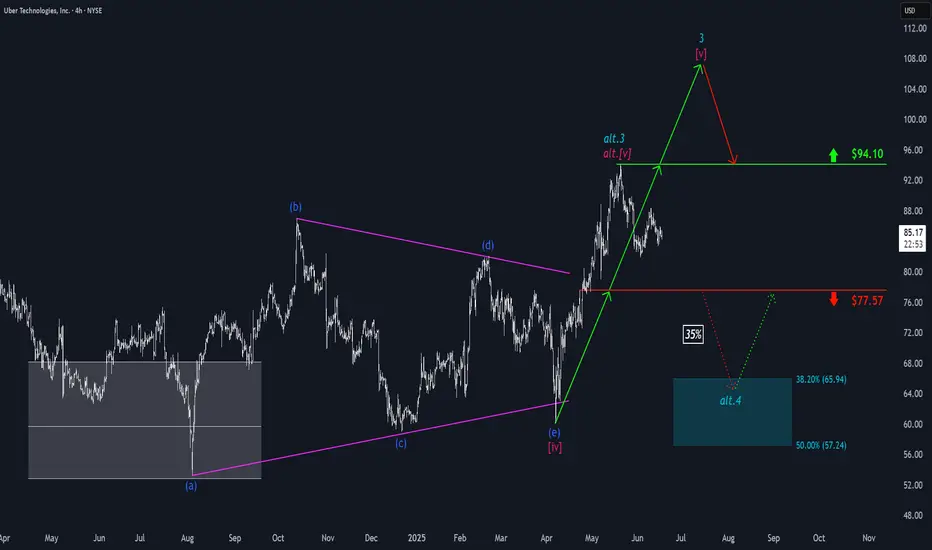
Uber: Upward Momentum ExpectedUber attempted to counter recent sell-offs with an upward move; however, downward pressure quickly resumed. We must still consider a 35% chance that the turquoise wave alt.3 has already concluded, which would imply direct declines below support at $77.57 during wave alt.4 . In this scenario, long entry opportunities could emerge within our alternative turquoise Target Zone between $65.94 and $57.24. Primarily, the regular wave 3 should reach its peak well above the $94.10 mark, and wave 4 would start later.
📈 Over 190 precise analyses, clear entry points, and defined Target Zones - that's what we do.
₿itcoin: Directly or with a Detour?!Under our primary scenario, Bitcoin remains on track to climb into the upper blue Target Zone between $117,553 and $130,891 during green wave B. The key question at this stage: will the crypto giant head straight for the zone – or take a detour below the $100,000 level first? Either path remains structurally consistent with the broader outlook. Once wave B concludes, we expect a pullback to unfold in wave C, with the low of that move – and the bottom of orange wave a – anticipated in the lower blue Target Zone between $62,395 and $51,323. From there, orange wave b should initiate a corrective rally, likely rebounding toward the $100,000 mark. This would set the stage for the final leg down in blue wave (ii). Meanwhile, our alternative scenario remains intact on the 8-hour chart. This 30% likely scenario suggests Bitcoin is still advancing within blue wave alt.(i) , rather than correcting in wave (ii). A confirmed breakout above $130,891 would validate this outcome.
📈 Over 190 precise analyses, clear entry points, and defined Target Zones - that's what we do.
₿itcoin: Continuing B WaveBitcoin has recently reclaimed the key $106,000 level. Under our primary scenario, we anticipate continued increases into the blue Target Zone between $117,553 and $130,891 – where green wave B is expected to conclude. From that corrective peak, we project a significant move lower in wave C, which should ultimately pull prices into the lower blue Target Zone between $62,395 and $51,323. This range is expected to mark the completion of orange wave a. We then foresee a brief corrective rally before wave (ii) completes its broader correction with a final sell-off.
📈 Over 190 precise analyses, clear entry points, and defined Target Zones - that's what we do.
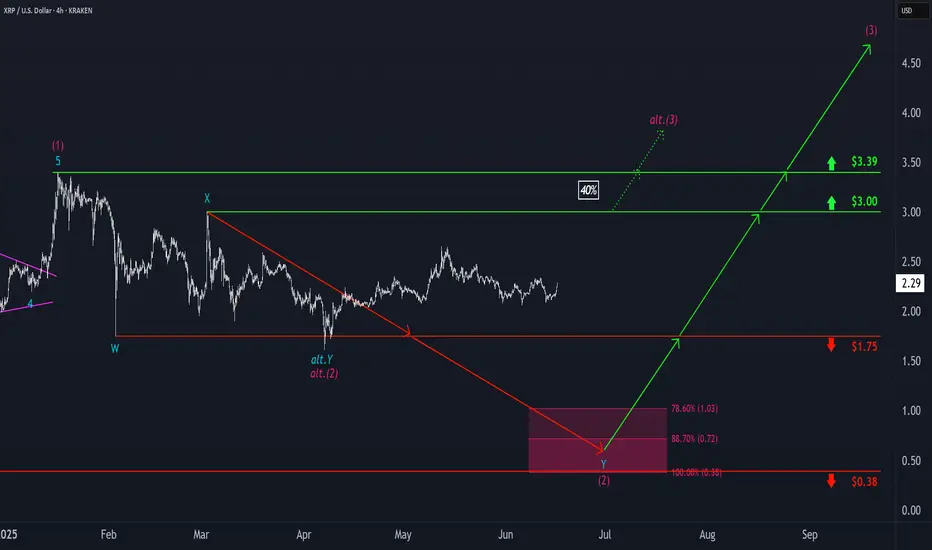
Ripple: Lower Low ExpectedWe still expect magenta wave (2) to conclude within the magenta Target Zone between $1.03 and $0.38 – a range we consider attractive for long entries. That said, there's a 40% probability that magenta wave alt.(2) has already bottomed. If so, a direct breakout above resistance at $3.00 and $3.39 would confirm this alternative scenario and suggest that the corrective phase is already behind us.
📈 Over 190 precise analyses, clear entry points, and defined Target Zones - that's what we do.
SOL (Weekly timeframe): Trend structure Price is approaching a key macro support zone. However, as long as it remains below the $148 level, I cannot rule out the possibility of one more corrective leg toward the $76–$55 range before a medium-term bottom is established and a potential resumption of the broader uptrend begins.
A breakout and sustained close above the $148 level would serve as the first technical signal that either:
- a corrective wave B (preceding a deeper correction toward the macro support zone) is unfolding, or
- a new long-term bullish trend aiming for all-time highs is beginning.
Monthly outlook:
My previous idea from November 2024 has fully realized its structure:
Thanks for reading and wishing you successful trading and investing decision!
