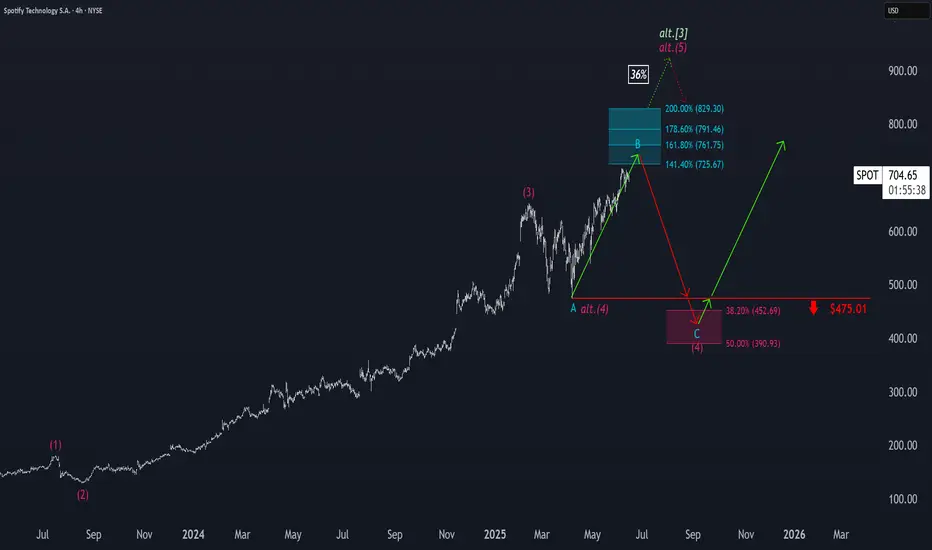
Spotify: Target Zone AheadSpotify has already come quite close to our turquoise Short Target Zone (coordinates: $725.67–$829.30). In our primary scenario, we continue to expect further upside in the near term, as the projected peak of wave B should materialize within this zone—a range that could present opportunities to lock in long-side gains or initiate short positions. Once the top is in place, we anticipate a more pronounced downward move. The focus then shifts to the magenta Target Zone (coordinates: $452.69–$390.93), which we consider a potential accumulation range for new long positions. That said, we’re also monitoring an alternative path, currently assigned a 36% probability. In that scenario, magenta wave alt.(5) would already be underway—meaning prices would bypass the magenta zone altogether.
📈 Over 190 precise analyses, clear entry points, and defined Target Zones - that's what we do.
Waveanalyses
Visa: Resistance ApproachingThe next key step for Visa should be overcoming resistance at $394.49 during magenta wave . However, if support at $339.61 fails to hold, our alternative scenario (33% probability) will be activated—suggesting the recent high already marked the end of the corrective wave alt. in magenta. In that case, a renewed decline below the $299 mark would be likely, aiming to complete the alternative turquoise wave alt.4 on a larger scale.
📈 Over 190 precise analyses, clear entry points, and defined Target Zones - that's what we do.

S&P500: Within reachThe S&P 500 has edged past the 88.70% retracement and is now trading within our magenta Target Zone (Coordinates: 5,880 points to 6,166 points). This places magenta wave (B) likely near its peak - a move that could soon give way to a sharper decline as part of the anticipated wave (C). At current levels, the setup remains favorable for initiating short positions. To manage risks, a stop just 1% above the upper boundary of the Target Zone is recommended. If the index breaks above resistance at 6,6675 points, however, we would shift to an alternative interpretation: a bullish continuation in the form of the wave alt.(III) in blaue. We currently assign a 40% probability to this scenario. One final note: the minimum technical requirement for wave (B) has already been fulfilled by the entry into the Target Zone. This means wave (C) could begin any time.
Over 190 precises analyses, clear entry points and defined Target Zones - that's what we do.

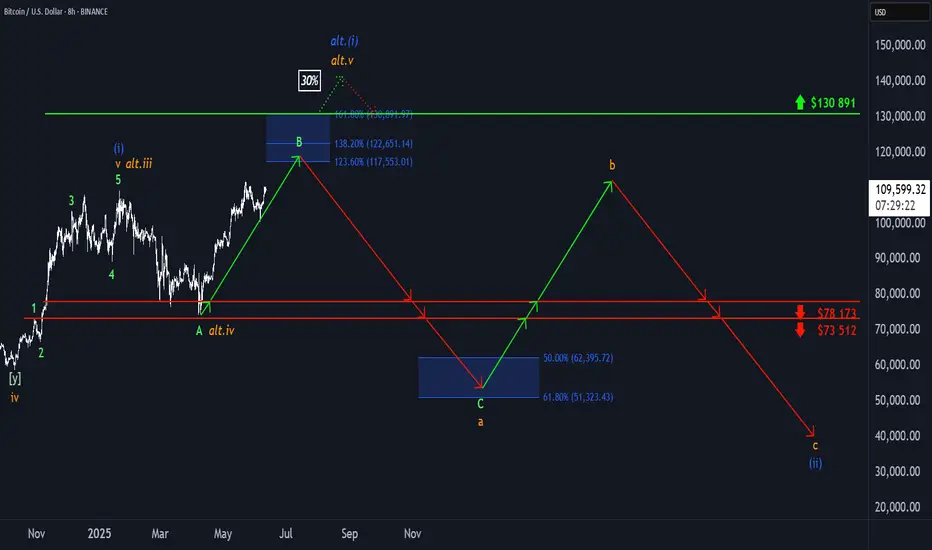
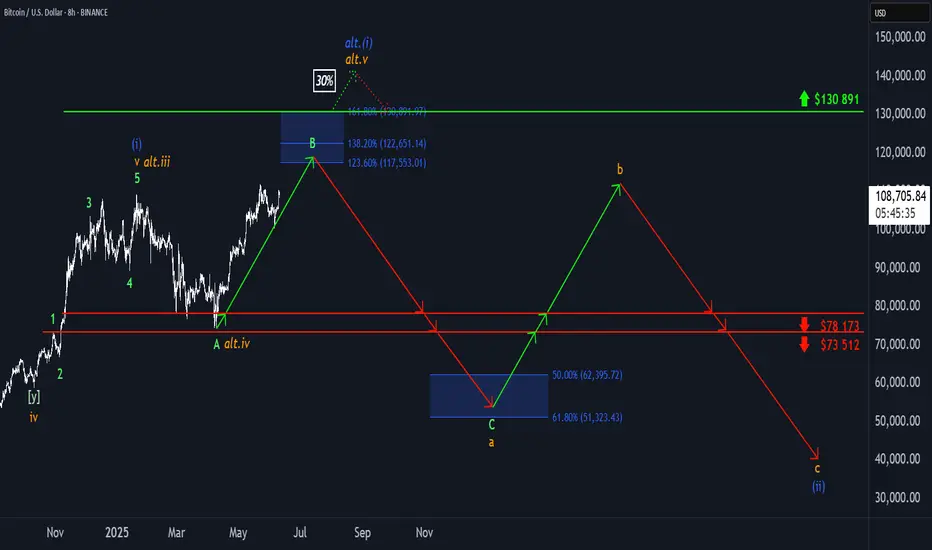
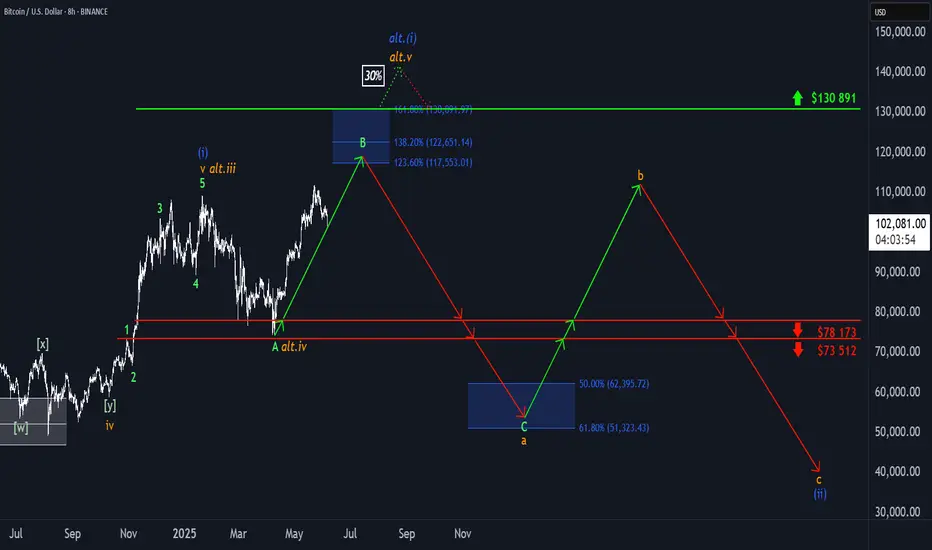
₿ Bitcoin: Further Upside ExpectedBitcoin (BTC) pulled back slightly in yesterday’s session but remains on track to continue its corrective rally within green wave B. In line with our primary scenario, this advance is expected to reach the blue Target Zone between $117,553 and $130,891. Afterward, we anticipate the onset of wave C, which should initiate a substantial decline—driving the price down into the lower blue zone between $62,395 and $51,323. This is also where we expect orange wave a to conclude. From there, wave b should provide a temporary rebound before wave c resumes the broader downtrend, ultimately completing blue wave (ii). That said, there’s still a 30% probability that blue wave alt.(i) has not yet topped. In this alternative scenario, BTC would extend higher, potentially breaking above resistance at $130,891 before the corrective phase resumes. The daily chart illustrates the entire five-wave blue sequence and shows our expected low for wave (ii) within the blue zone between $37,623 and $26,082.
📈 Over 190 precise analyses, clear entry points, and defined Target Zones - that's what we do.
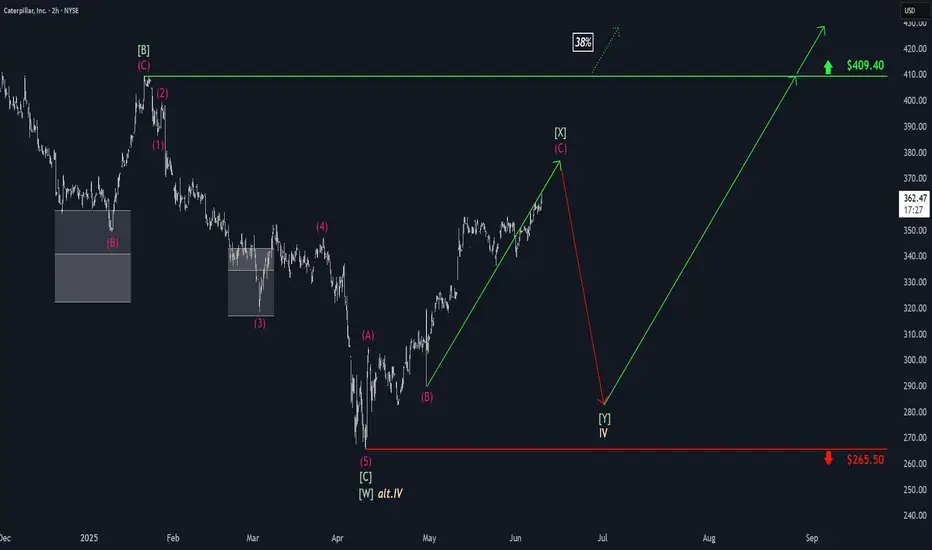
Caterpillar: Countertrend ActionCaterpillar’s green wave has further room to run. However, this rise represents only an internal countertrend – the broader correction in beige wave IV is still ongoing. Under our primary scenario, we expect the price to form another low before launching into a sustained advance, which should ultimately push above resistance at $409.40. Meanwhile, our alternative scenario—carrying a 38% probability—suggests that beige wave alt.IV has already bottomed. If that’s the case, the correction is complete, and a direct breakout above $409.40 could follow.
📈 Over 190 precise analyses, clear entry points, and defined Target Zones - that's what we do.
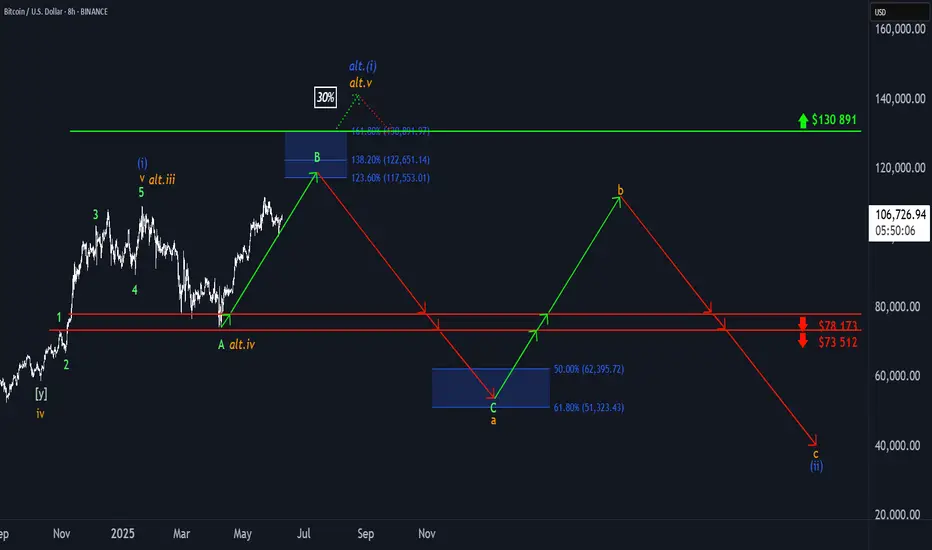
₿ Bitcoin: Push to the Upside! Bitcoin has made a significant push to the upside, which brought it closer to the upper blue Target Zone between $117,553 and $130,891, where we primarily expect the corrective rise of green wave B to conclude. We consider this price range an opportunity to take partial profits or to open short hedges for tactical protection of existing long positions — thus, we don't plan to sell all our Bitcoin holdings there. Potential short hedges could be secured with a stop 1% above the upper edge of the zone since there's a 30% chance that price could exceed this zone to develop a new high for blue wave alt.(i) before reversing later. Primarily, however, green wave C should commence in the upper blue zone and drive BTC down into the lower blue zone between $62,395 and $51,323—and thus to the low of orange wave a.
📈 Over 190 precise analyses, clear entry points, and defined Target Zones - that's what we do.
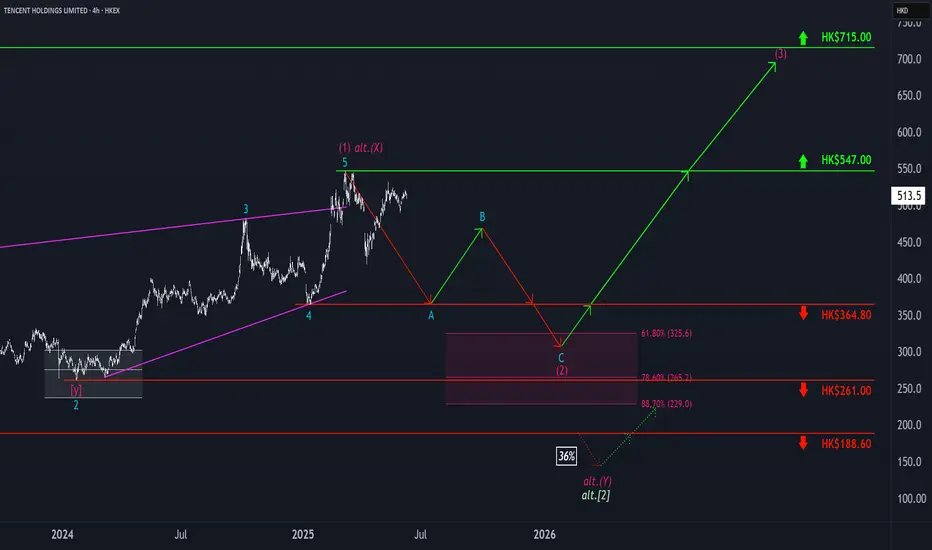
Tencent: Searching for Wave A’s LowTencent’s corrective A-B-C structure is struggling to finish wave A. Our primary scenario calls for a drop toward support at HK$364.80, where wave A should bottom. That should open the door for wave B, followed by a deeper leg down in wave C—into the magenta Long Target Zone between HK$325.60 and HK$229.00. This zone should mark the completion of wave (2), setting up a long-term bullish reversal in wave (3), which may eventually target resistance at HK$715. However, if price breaks below HK$188.60, our wave alt. scenario will take over (36% probability), signaling an even deeper low before the next bullish impulse.
📈 Over 190 precise analyses, clear entry points, and defined Target Zones - that's what we do.
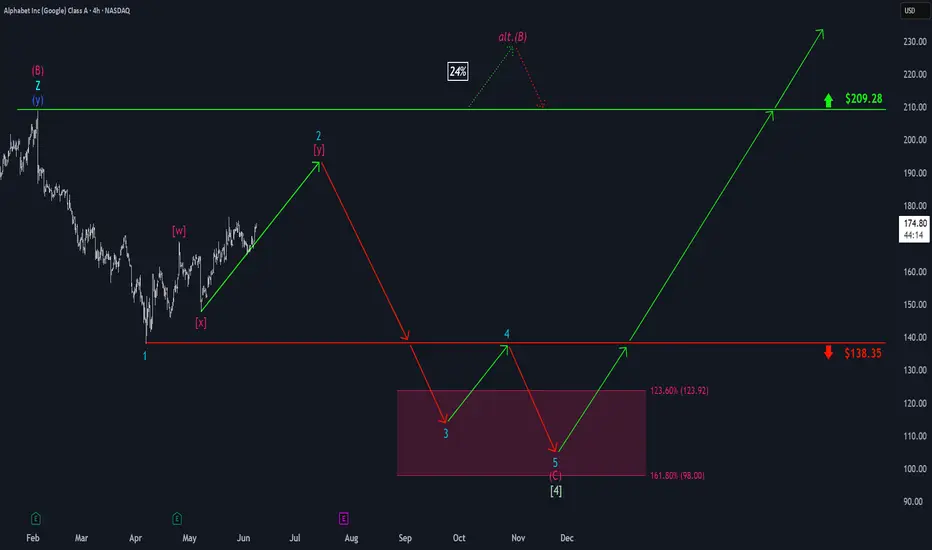
Google (Alphabet): Overarching Downside PotentialAlphabet (GOOGL) hasn’t been able to reclaim its May 22 high and has settled into a consolidation range around the $170 level. Still, under our primary scenario, we expect the current corrective upswing to continue for a bit before turquoise wave 3 resumes the downtrend. That move should break below $138.35 and carry the price into the magenta Target Zone between $123.92 and $98. After that, a rebound within wave 4 is likely, though it probably won’t be strong enough to retake the $138.35 level. A final leg down in wave 5 should then complete the correction, driving the price deeper into the zone and establishing the low of green wave . This area also marks a potential turning point for the next major move upward. Meanwhile, a detour above resistance at $209.28 for a new high of magenta wave alt.(B) is 24% likely.
📈 Over 190 precise analyses, clear entry points, and defined Target Zones - that's what we do.
₿ BTC: Upside Potential Remains IntactBTC posted modest gains over the weekend, but more upside is expected in our primary scenario. We continue to track a corrective advance in green wave B, with the potential to extend into the upper blue Target Zone between $117,553 and $130,891. From that top, wave C should initiate a downward move into the lower blue zone between $62,395 and $51,323—completing orange wave a. Subsequently, we anticipate a bounce in wave b, followed by another decline in wave c, which should conclude the larger correction of blue wave (ii). There is still a 30% chance that blue wave alt.(i) could make a new high, extending beyond the Target Zone and delaying the broader corrective sequence.
📈 Over 190 precise analyses, clear entry points, and defined Target Zones - that's what we do.
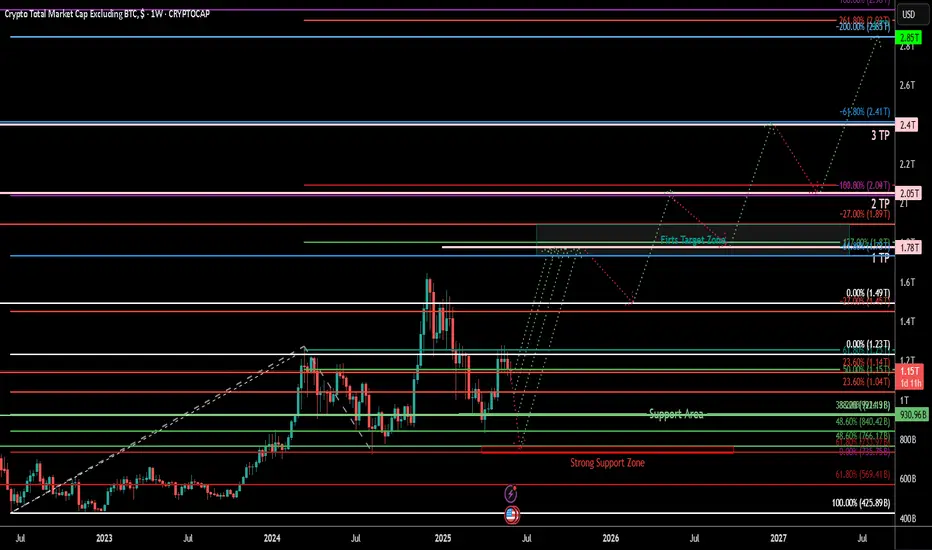
TOTAL2 – Altcoin Market Cap (Weekly TF) 2025
**Summary:**
The TOTAL2 chart (crypto market cap excluding BTC) is showing a structurally bullish formation after a deep retracement and a higher low confirmation. This setup suggests a potential multi-phase rally toward 2.98T and beyond, with defined support zones and Fibonacci targets aligned with liquidity cycles. This analysis visualizes the expected roadmap based on trend-based Fibonacci extensions, retracement levels, and psychological market phases. Notably, the outlook includes the possibility of an initial correction to retest strong support zones before the market begins its ascent.
**Chart Context:**
TOTAL2 represents the aggregated market capitalization of all crypto assets excluding Bitcoin. Historically, it reflects capital rotation into altcoins, especially following BTC dominance peaks. The current chart shows strong reaccumulation above the 1T support zone, with Fibonacci confluences hinting at a sustained recovery pattern. Dotted arrows illustrate a wave-like projection of accumulation, rally, retracement, and expansion. The possibility of a near-term correction to lower support zones is also embedded in the path structure.
**Key Technical Observations: and Levels**
TP1 = 1.78T
TP2 = 2.05T
TP3 = 2.4T
TP4 = 2.85T
* **Secondary Fib Retracement :** 0% = 1.23T, 100% = 425.89B
* Key zones: 23.6% = 1.04T, 38.2% = \~840.42B, 61.8% = \~569.41B
Possible Support Levels: 1.04T, 930B, 840B, 766B, 735B,
* **Trend-Based Fib (A-B-C):** A = \~420B, B = \~1.23T, C = \~735B
* This projection aligns with TP1 at 1.78T
* **Support Area:** Around 1T psychological zone (930B)
* **Strong Support Zone:** 735 Bto775B
* **First Target Zone:** Between 1.73T and 1.89T (early resistance + Fib cluster)
**Indicators:**
* Weekly structure forming higher lows
* Long-term Fib retracements respected
* Trend-Based Extension projecting 1.618 move
* No divergence, confirming strength
**Fundamental Context:**
* Liquidity conditions are improving globally with rate cuts expected into late 2025.
* ETH and ecosystem tokens are likely to lead altcoin recovery.
* Regulatory clarity and ETF flows add legitimacy to broader crypto allocations.
* Historical alt-seasons emerge from BTC profit rotation—TOTAL2 leads that shift.
* However, several macro risks may trigger a correction before rallying:
* The Crypto Fear & Greed Index is currently high, suggesting overbought conditions.
* Macroeconomic uncertainties (e.g., inflation, rate hike fears) can suppress short-term risk appetite.
* Regulatory tightening across major jurisdictions introduces hesitation in capital deployment.
* Technical signs of a five-wave drop in BTC hint at a larger ABC correction scenario.
* DAT (Digital Asset Treasury) exposure among public firms may lead to forced liquidations during downturns.
**Philosophical or Narrative View:**
This is not just a market cycle—it's a reflection of decentralized innovation reclaiming narrative dominance. After fear-induced lows, TOTAL2's rise echoes the resilience of builders, protocols, and investor conviction. Each Fibonacci level acts like a checkpoint in the unfolding story of crypto's evolution beyond Bitcoin.
**Related Reference Charts:**
*
**Bias & Strategy Implication:**
* **Bias:** Bullish with short-term corrective risk
* **Accumulation Zone:** 1.0T–1.23T
* **Initial Risk:** Price may revisit the **Support Area (1T)** or even the **Strong Support Zone (775B–725B)** before a sustained move higher.
* **Partial TP:** 1.78T–2.05T
* **Extended TP:** 2.4T–2.98T
* Caution near TP4–Bonus zones as distribution risk increases
* Invalidated if closes below 725B (structure break)
**Notes & Disclaimers:**
This is a structural macro outlook and not financial advice. Markets are dynamic and subject to rapid shifts in sentiment, liquidity, and regulation. Always use risk management.
Coca-Cola: IndecisiveCoca-Cola continues to trade sideways, still failing to confirm either of our scenarios definitively. The primary scenario envisions that wave III in beige will post another high within the beige Target Zone ($76.58–$81.51), which offers a potential setup for short positions. Following that, wave IV in beige should begin a substantial correction. However, if the stock fails to overcome resistance at $74.38, it could indicate that the top of wave alt.III in beige is already in. A decline below the $66.05 support level would activate the alternative scenario (35% probability), implying a drop below $60.62.

₿ BTC: Delay Tactics in Wave B Bitcoin dropped hard yesterday, throwing a wrench into the expected climb toward the top of green wave B. This bounce was supposed to stretch into the upper blue Target Zone between $117,553 and $130,891, which we flagged as a smart area to take partial profits or layer in short hedges. That zone still stands—BTC just isn’t ready to hit it yet. The current pullback suggests we’ll see more sideways-to-lower price action before green wave B wraps up. Once it does, green wave C should drag Bitcoin into the lower blue Target Zone between $62,395 and $51,323. That’s where we’re looking for orange wave a to complete. After that, a countertrend rally in wave b could pop up—before wave c wraps the entire corrective cycle and finishes blue wave (ii). We’re also watching an alt.(i) breakout scenario (30% probability). In that case, BTC would blow through the $130,891 level early, bypassing the expected dip and reaching new highs faster than projected.
📈 Over 190 precise analyses, clear entry points, and defined Target Zones - that's what we do.

BTC: Facing Resistance?Bitcoin recently encountered renewed selling pressure, stalling the anticipated continuation of green wave B. Under the primary scenario, this corrective upward movement should still extend into the upper blue Target Zone between $117,553 and $130,891, where the price is expected to reverse and initiate green wave C. That move should complete with a low in the lower blue Target Zone between $62,395 and $51,323, thereby finalizing orange wave a. Following a corrective advance in wave b, the larger wave (ii) should reach its conclusion. There remains a 30% probability for the alternative scenario, in which BTC pushes above the upper blue Target Zone, establishing a new high in blue wave alt.(i)— which would delay the expected pullback.
📈 Over 190 precise analyses, clear entry points, and defined Target Zones - that's what we do.
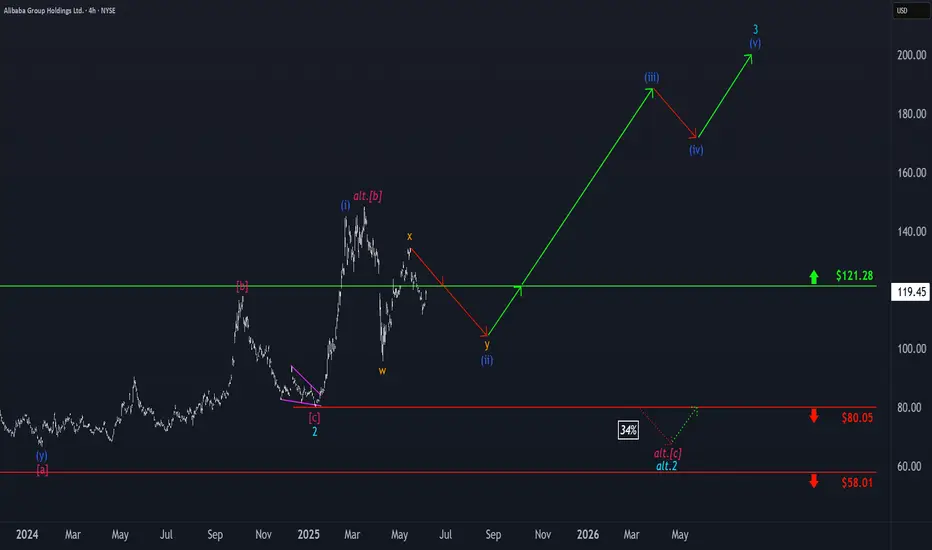
Alibaba: Intermediate Correction in ProgressAs Alibaba has remained below resistance at $121.28, we’ve ultimately chosen to consider the high of orange wave x as established. Thus, we currently place the stock in bearish wave y, which should conclude the corrective structure of the larger blue wave (ii). From that point, BABA should reverse, climb back above the $121.28 resistance, and move to significantly higher levels—initially completing blue wave (iii), and eventually the larger turquoise wave 3. However, there’s still a 34% chance that our bearish alternate scenario will play out. In that case, the stock would fall between the two support levels at $80.05 and $58.01, where the low of turquoise wave alt.2 would form.
📈 Over 190 precise analyses, clear entry points, and defined Target Zones - that's what we do.
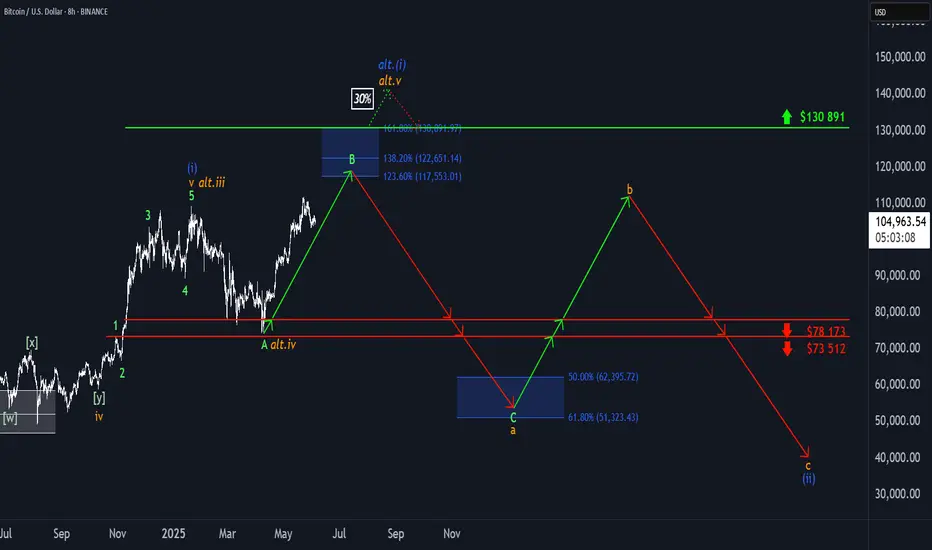
BTC: Maintaining Strength Bitcoin continues to hover around the $105,000 level. In line with the primary scenario, we expect the advance in green wave B to extend toward the upper blue Target Zone between $117,553 and $130,891. This zone can be used to lock in partial gains or establish hedges via short positions. From there, a corrective wave C is likely to follow, driving prices lower into the blue Target Zone between $62,395 and $51,323 — marking the end of the larger wave a. A corrective bounce should unfold next, ahead of the final selloff completing blue wave (ii). The alternative scenario, with a 30% probability, envisions a breakout above $130,891 and the establishment of a new high as part of blue wave alt.(i).
📈 Over 190 precise analyses, clear entry points, and defined Target Zones - that's what we do.
S&P500: Approaching the 88.70% RetracementThe S&P 500 continued its climb, nearing the 88.70% Fibonacci retracement level. The top of magenta wave (B) has not yet been confirmed, so under the primary scenario, we continue to expect further upside into the magenta Target Zone between 5,880 and 6,166. Once that zone is reached, wave (C) is expected to take over and drive the index into the next Target Zone — the green zone between 4,988 and 4,763. Short positions initiated within the upper zone remain viable and can be protected with a stop 1% above the top of the range. The alternative scenario — assigned a 40% probability — assumes the rally will continue directly into wave alt.(III) in blue, with a breakout above the 6,675 resistance. Over the long term, we continue to expect one final impulsive leg higher in blue wave (III) once the broader green wave correction is complete. This should take the S&P 500 well above the 6,166 mark.
📈 Over 190 precise analyses, clear entry points, and defined Target Zones - that's what we do.

AMD: Short-term Upward PotentialAMD has continued to face downward pressure, preventing further progress in green wave . While this wave still has room to rise, its top should form below resistance at $141.16. Once wave completes, wave should follow—finishing the larger green impulse to the downside and completing the corrective structure of blue wave (II). This move is expected to conclude in our blue Long Target Zone between $62.82 and $35.19. That said, we continue to monitor a 30% alternative scenario: it suggests that wave alt.(II) has already bottomed at $76.12. In that case, AMD wouldn’t visit the blue zone but instead break out directly above the resistances at $141.16 and $174.98—marking the beginning of wave alt.(III).
📈 Over 190 precise analyses, clear entry points, and defined Target Zones - that's what we do.

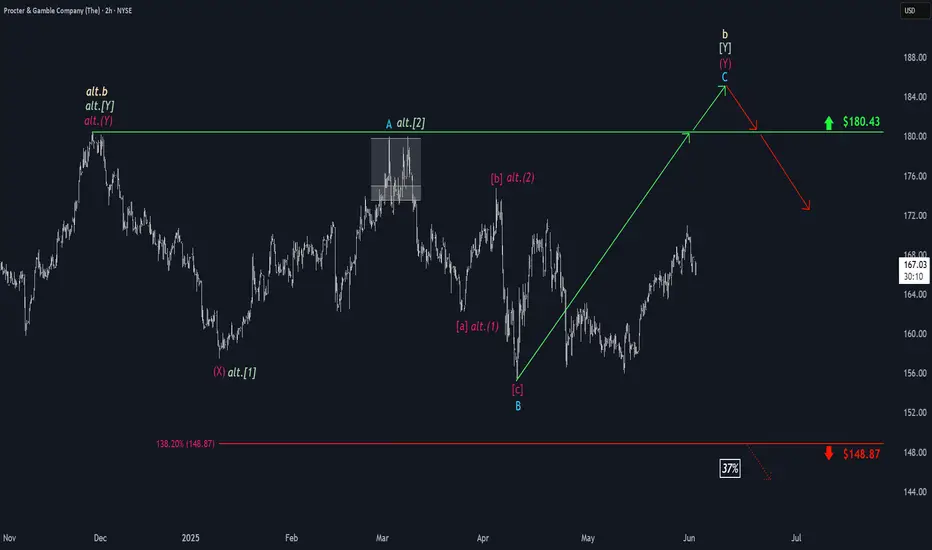
Procter&Gamble: Short-Term Strength Still Fits the PlanPG has extended its rally, pushing turquoise wave C higher. While some selling pressure is starting to show, we’re sticking with our primary view: the stock should still break above $180.43 to complete beige wave b before turning lower. However, in our 37% likely alternative scenario, beige wave alt.b would have already topped, and the stock would next drop below $148.87.
📈 Over 190 precise analyses, clear entry points, and defined Target Zones - that's what we do.
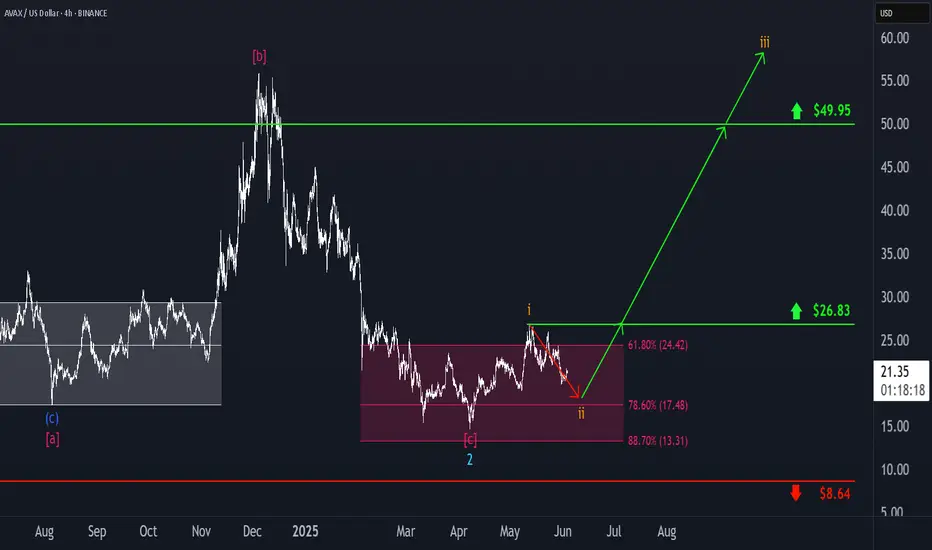
AVAX: Low in Sight?AVAX continued its expected decline into the magenta Target Zone between $24.42 and $13.31, before reversing course over the weekend with a modest bounce. While it's possible that this marked the low of the wave ii correction, we're not ruling out the potential for another dip within the zone. For now, the setup remains open-ended. Once orange wave ii has been confirmed as complete, we expect a strong rally to follow in wave iii, likely driving the price beyond resistance at $49.95.
📈 Over 190 precise analyses, clear entry points, and defined Target Zones - that's what we do.
BTC: Still in the Grip of Wave BBitcoin is holding steady near the same levels seen at the time of yesterday’s update — and so is the structure. According to our primary scenario, we expect the current corrective wave B to complete soon within the blue Target Zone between $117,553 and $130,891. Once that happens, a wave C selloff should follow, likely targeting the lower blue Target Zone between $62,395 and $51,323. That said, our alternative scenario (30% probability) remains intact. In that case, the high of blue wave (i) has yet to form — a breakout above $130,891 would confirm that view and open the door to further upside before a correction resumes.
📈 Over 190 precise analyses, clear entry points, and defined Target Zones - that's what we do.

BTC: Slowing DownBitcoin managed to stabilize over the weekend after its recent slide, nudging slightly higher from local lows. We continue to expect the current rebound—interpreted as wave B—to stretch into the blue Target Zone between $117,553 and $130,891. Once that move tops out, the next leg lower should follow, with wave C driving the price into the lower blue zone between $62,395 and $51,323. That would likely complete wave a in orange and pave the way for a temporary recovery before wave b rolls over into the final drop of wave (ii). The alternative scenario, which we’re still assigning a 30% probability, assumes Bitcoin is already in wave alt.(i) in blue—a more bullish path that would extend the rally well beyond $130,891 without another major correction first.
📈 Over 190 precise analyses, clear entry points, and defined Target Zones - that's what we do.

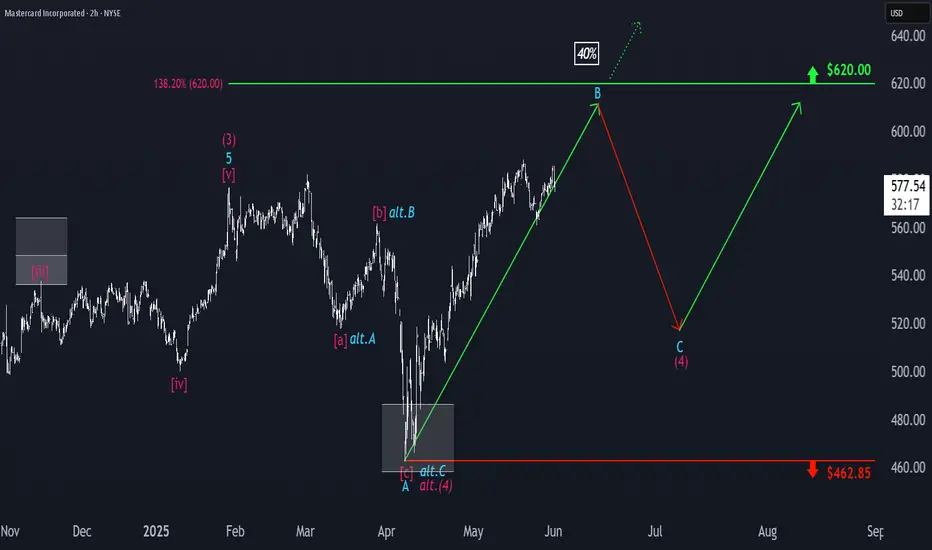
Mastercard: Approaching the Top of Wave BMastercard has rebounded after a brief cooling period, and we now expect turquoise wave B to complete just below resistance at $620. Once that top is in, wave C should drive a meaningful retracement, ending with the low of magenta wave (4). Alternatively, if turquoise wave alt.(4) has already bottomed — which we estimate as a 40% probability — then a direct breakout above $620 would suggest a shift toward a much more aggressive advance. That path would take the stock straight into magenta wave (5), completing blue wave (I) with a strong rally.
📈 Over 190 precise analyses, clear entry points, and defined Target Zones - that's what we do.
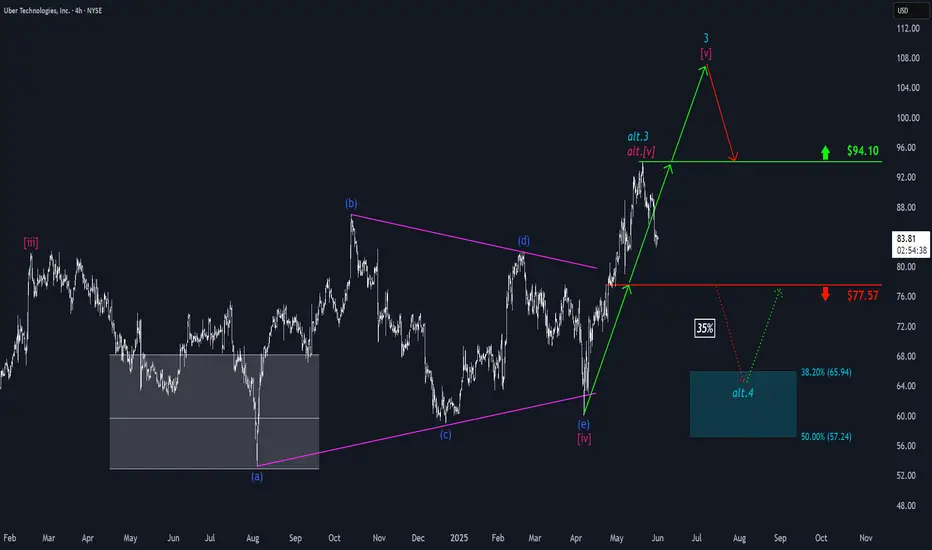
Uber: Topped out Already?Uber sold off sharply after topping out at $94.10 – thus, our short-term alternative scenario needs to be considered. In this view (35% probability), turquoise wave alt.3 has already concluded, and the stock is headed toward a pullback in wave alt.4 . That retracement would likely bottom in the turquoise Target Zone between $65.94 and $57.24 — a potential setup for long entries. The primary scenario remains more bullish: we expect a renewed push above $94.10 to complete the regular turquoise wave 3.
📈 Over 190 precise analyses, clear entry points, and defined Target Zones - that's what we do.