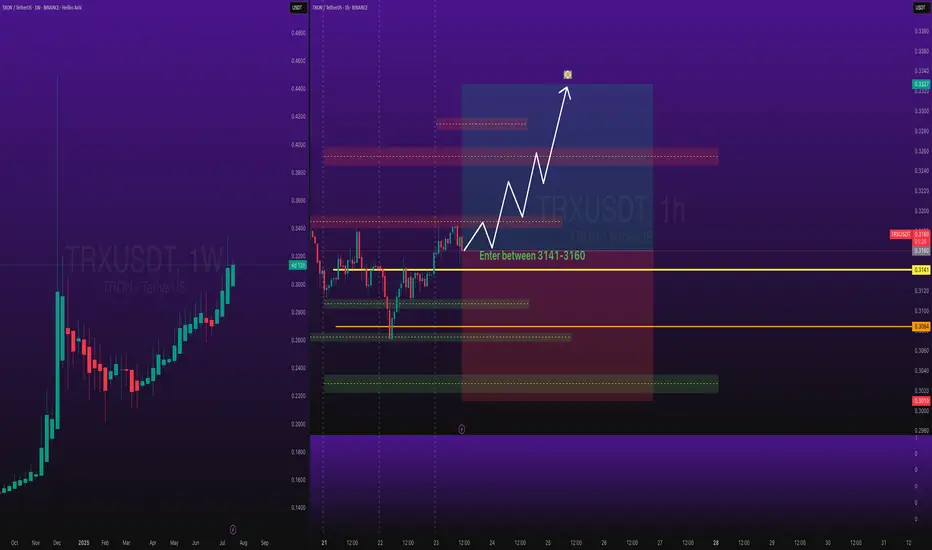
TRXUSDT Long SwingBINANCE:TRXUSDT Long Swing Trade, with my back testing of this strategy, it hits multiple possible take profits, manage your position accordingly.
This is good trade, don't overload your risk like greedy, be disciplined trader.
I manage trade on daily basis.
Use proper risk management
Looks like good trade.
Lets monitor.
Use proper risk management.
Disclaimer: only idea, not advice
Wave Analysis
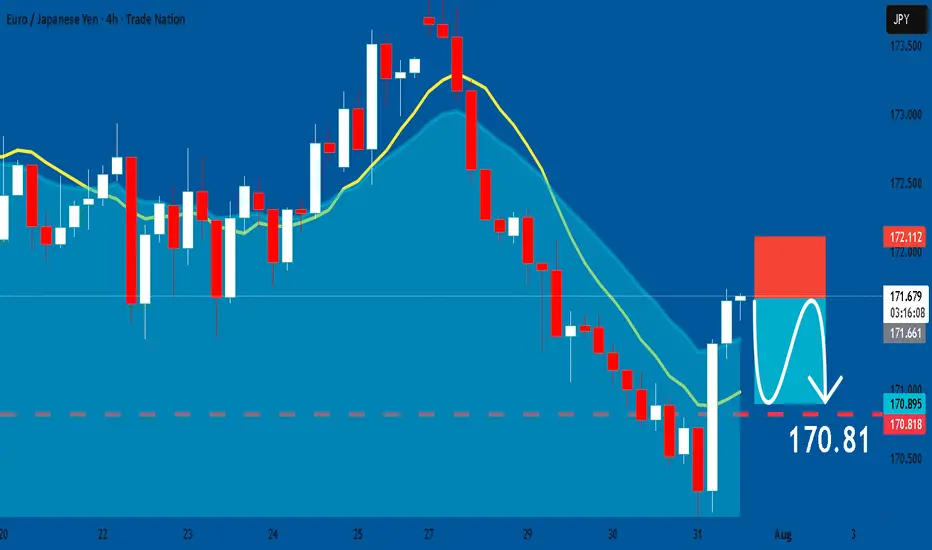
EURJPY: Short Trade Explained
EURJPY
- Classic bearish formation
- Our team expects pullback
SUGGESTED TRADE:
Swing Trade
Short EURJPY
Entry - 171.66
Sl - 172.11
Tp - 170.81
Our Risk - 1%
Start protection of your profits from lower levels
Disclosure: I am part of Trade Nation's Influencer program and receive a monthly fee for using their TradingView charts in my analysis.
❤️ Please, support our work with like & comment! ❤️
GBPNZDI would like to share this complex correction. Here I'm looking to take this to the blue box before a drops

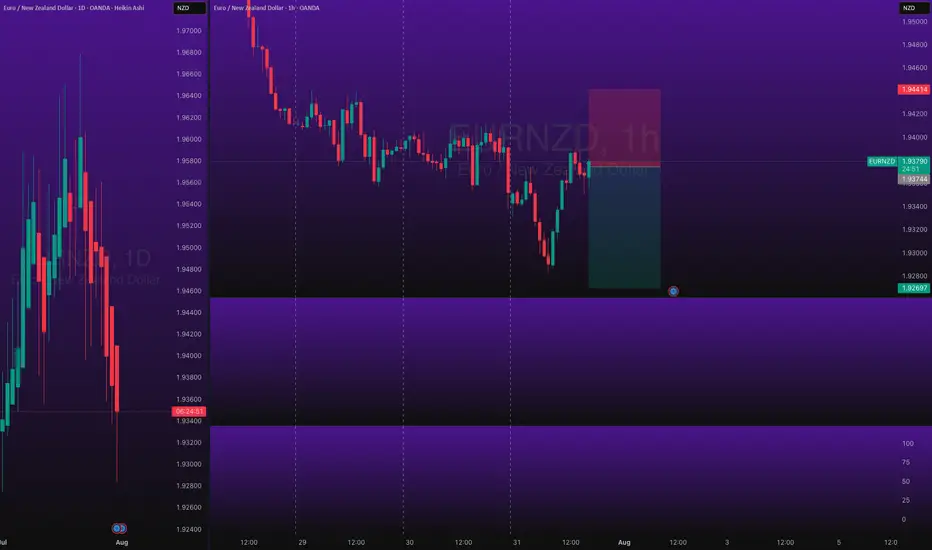
EURNZD Short Day TradeOANDA:EURNZD Short Day Trade - Low Risk, with my back testing of this strategy, it hits multiple possible take profits, manage your position accordingly.
Note: Manage your risk yourself, its risky trade, see how much your can risk yourself on this trade.
Use proper risk management
Looks like good trade.
Lets monitor.
Use proper risk management.
Disclaimer: only idea, not advice
EURUSD BULLISH TREND EUR/USD is expected to remain in its bearish trend until it approaches the key support levels around 1.11290 to 1.09744. These zones could serve as potential turning points, where a bullish reversal may emerge if supported by fundamental or technical catalysts.

#GBPUSD ALMAZOV PROJECTION DAILYPrice projection according to Almazov's theory, #GBPUSD should at least touch $1.31500 - before going up, we wait for the initial condition to enter a long position, to reach the Daily Spike f 261.8.

#COPPER #MCX View as on 31st JulyMCX:COPPER1! Copper MCX if it doesnot make one more swing higher then the rally should correct all the way. Alternate is it could be doing a triangle and then make new high.

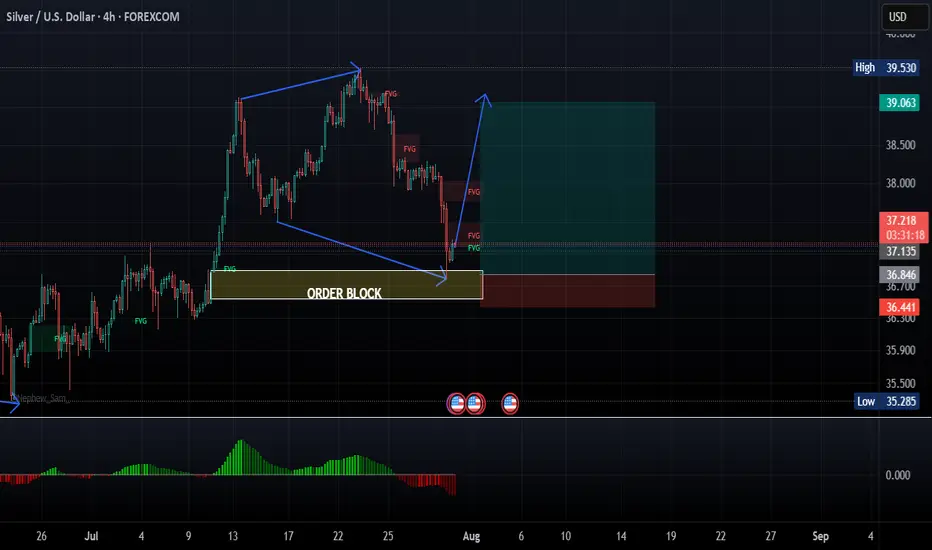
XAGUSD/SILVER LONG 1:5 RReason for entry:
1. Expanding flat structure
2. Order block reaction
3. 5th wave in play
4. 4 HR engulfing candle
Entry: 37.204
Stop loss: 36.454
Take Profit:39.073
Strategy: Wait for engulfing candle to enter
Place trade at break even at 1:2R or move stop loss to 1:1 R when in PROFIT
BTC analysis, supports 116k, targets 122k, caution below 115.9k__________________________________________________________________________________
Technical Overview – Summary Points
__________________________________________________________________________________
Bullish momentum confirmed on all timeframes (1D to 1H).
Key supports: 115,960 / 117,423 / 117,700. Main resistances: 119,573–119,800–122,318.
Volumes overall normal to moderately high, no climax.
Risk On / Risk Off Indicator: strong buy signal for all higher TFs, neutral on 30m/15m (momentary exhaustion).
ISPD DIV neutral across all frames, no extreme or behavioral signals.
MTFTI trend: up / strong up across the board.
__________________________________________________________________________________
Strategic Summary
__________________________________________________________________________________
Main bias: confirmed bullish, high-range maintained between 116k–122k.
Opportunities: buy on validated pullbacks between 116k–117.7k, take partial profits under 119.5k–122k.
Risk areas: sharp downside below 115,960 with potential extension to 112k/110k.
Macro catalysts: PCE (slightly above consensus), Fed on hold, moderate volatility. No negative crypto catalyst in sight.
Action plan: Tactical stop-loss below 115,960, defensive management within range.
__________________________________________________________________________________
Multi-Timeframe Analysis
__________________________________________________________________________________
1D – Support: 115,960 (Pivot Low), Resistance: 119,573–122,318. Strong momentum, resistance clusters.
12H/6H/4H – Bullish structure, moderate volume participation, consolidation under major resistance, pullbacks defended.
2H/1H – Compression between pivots, patience before breakout or support retest.
30m/15m – Tight consolidation, Up momentum but neutral behavioral signals, compression pre-move.
Risk On / Risk Off Indicator : Strong buy on all TFs except intraday, neutrality on 30m/15m (temporary stall).
ISPD DIV : No euphoria/fear, median persistent zone.
Volumes slightly above average, healthy structure.
Summary: Technical and fundamental confluence, upper range maintained, no reversal signals present.
__________________________________________________________________________________
Summary and Strategic Plan
__________________________________________________________________________________
Main bias: confirmed bullish on all frames, but increased caution above 122k.
Plan: tactical buy only on validated pullback/price action, defensive profit-taking near resistance.
Stop-loss below 115,960. Major invalidation under this threshold (low liquidity area).
Monitor reactions to upcoming macro events (PCE/Fed) and any escalation in geopolitics.
__________________________________________________________________________________
Macro/Fundamentals & On-chain
__________________________________________________________________________________
US Macro: PCE YoY above forecast (2.6% vs 2.5%), Fed on hold, USD under pressure.
No systemic negative crypto alerts. IMF to classify BTC as “national wealth” from 2026.
On-chain: Large liquidity test absorbed, 97% of BTC supply in profit, network consolidation in 117k–122k.
Specific risk on break <115k: potential acceleration towards 110k.
__________________________________________________________________________________
Summary: BTC/USDT is in a structural range 116k–122k with a dominant bullish bias, supported by technicals, strong macro and on-chain content. Accumulating at supports and defensive sells near resistance remain optimal until confirmation of a directional breakout.
Suggested stop-loss: <115,960.
Moderate risk until the next major macro/event catalysts.
__________________________________________________________________________________

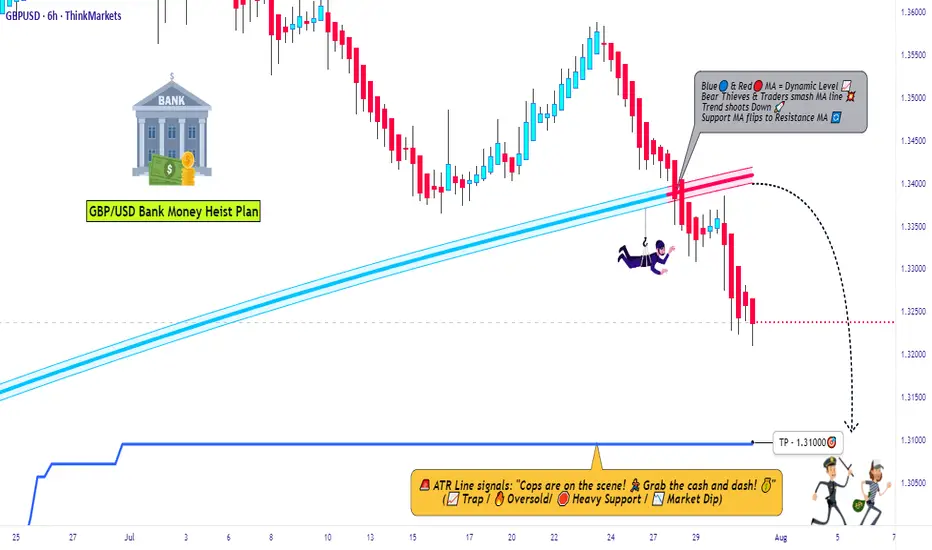
Market Trap Alert! GBP/USD Bearish Robbery Plan🔥💸 "The Cable Heist" – GBP/USD Robbery Plan Using Thief Trading Style 💸🔥
— Unfiltered Forex Forecast with Risky Intentions —
🌍 Hey Money-Makers, Market Hustlers & Chart Bandits! 🤑✈️
Hola! Bonjour! Marhaba! Hallo! Ciao! Welcome to the Forex streets where the smart rob the charts, not banks.
Ready for the GBP/USD Heist? Let’s break it down with our infamous Thief Trading Style – raw, unapologetic, and built for profits.
💼 Operation Name: “The Cable Forex Bank Robbery”
🎯 Pair: GBP/USD – aka “The Cable”
⚔️ Style: Scalp / Day Trade / Swing Heist
📊 Bias: Short (Bearish Setup)
🛠 STRATEGY SETUP: "Follow the Shadows"
🔍 Analysis Basis:
Smart-Money Traps at Key Levels
Oversold ≠ Reversal (Read between the candles)
Liquidity Hunting Zones
Retail Stop Clusters Exposed
Thief-style DCA Entries (Staggered Entry Levels)
Multi-timeframe Confirmation
COT, Sentiment & News-Driven Volatility
🎯 ENTRY ZONE:
Enter short (sell) using 15M or 30M chart.
Sell Limits near recent highs (pullback zone).
DCA (Layered Entry) recommended – Thief loves catching price slipping.
Let the liquidity work for us.
🛑 STOP LOSS (SL):
Base SL around 1.34000 on 4H Chart – above swing high.
Adjust SL per position size and total entries.
Manage risk, but remember: thieves don’t panic, they plan!
🎯 TARGET ZONE:
TP near 1.31000 or adjust using price action.
Escape before target if market mood flips – no need to be greedy.
Trail SLs if market momentum dies down.
👀 Scalpers' Special Note:
Only SHORT — don’t mess with long side unless you’re a liquidity donor.
Quick ins & outs. If you're loaded with capital, jump in big – else follow the swing team.
Use trailing SLs for safety — protect the loot.
📢 FUNDAMENTALS TO WATCH:
News Impacting GBP/USD
COT Reports
Sentiment Indicators
Macro Trends / Yield Spreads
US Dollar Strength Index (DXY)
UK Economic Reports (CPI, GDP, Rate Decisions)
⚠️ RISK MANAGEMENT TIPS:
🚨 Avoid new entries during news releases
🚨 Use trailing stops during volatility spikes
🚨 Secure running trades before major announcements
🚀 Boost the Robbery – Support the Strategy
💖 Smash that BOOST BUTTON if you're vibing with this setup. Help the Thief crew grow stronger!
Let’s keep milking the market 💸 – one “heist” at a time. Stay dangerous, stay smart.
🔓 NOTE: This isn't investment advice. Just a wild trading idea from a chart outlaw.
Always DYOR – Do Your Own Robbery (Research).
Market conditions shift fast. Stay alert, adapt, and respect your capital.
#ForexThiefStyle #CableHeist #GBPUSDShort #SmartMoneyMoves #LiquidityHunters #ChartOutlaws #TradingRebels #DayTradeLife #ScalpersParadise #ForexGang #FXHeistPlans
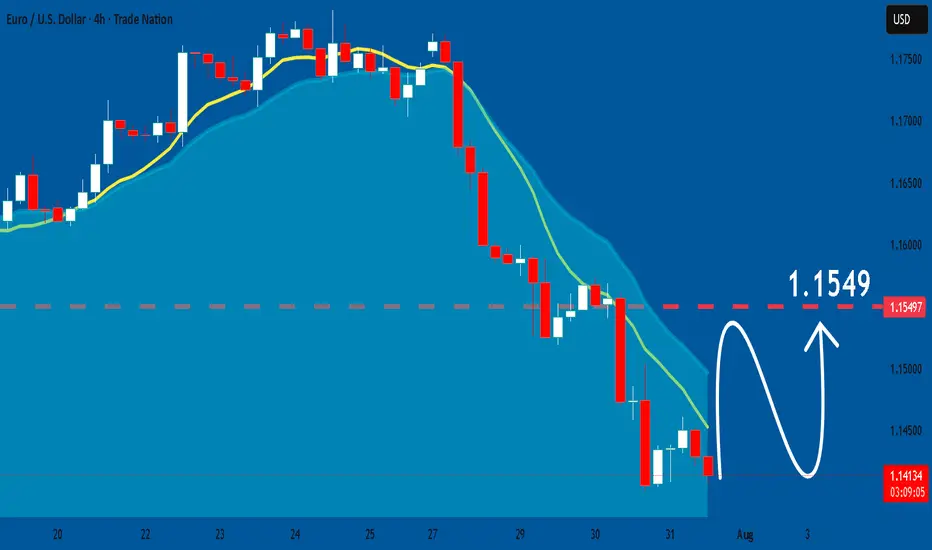
EURUSD: Will Start Growing! Here is Why:
It is essential that we apply multitimeframe technical analysis and there is no better example of why that is the case than the current EURUSD chart which, if analyzed properly, clearly points in the upward direction.
Disclosure: I am part of Trade Nation's Influencer program and receive a monthly fee for using their TradingView charts in my analysis.
❤️ Please, support our work with like & comment! ❤️
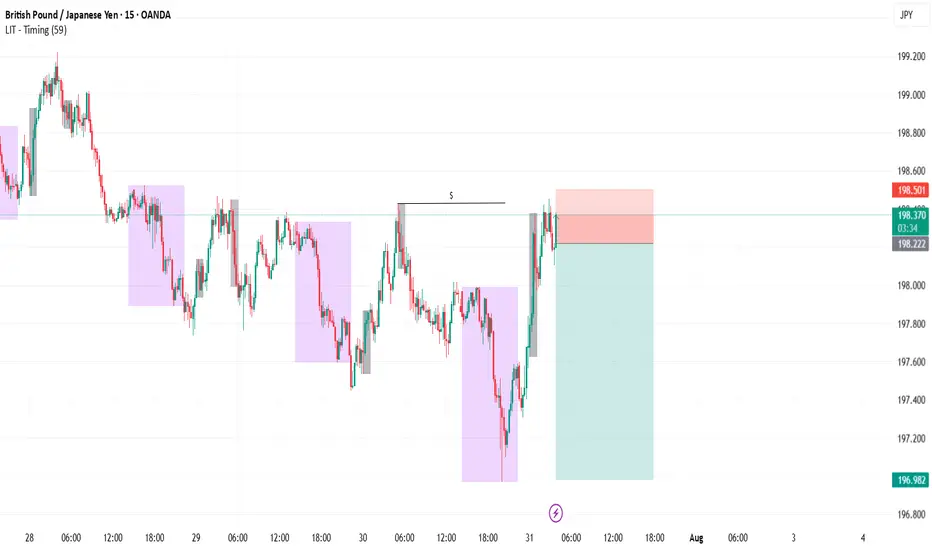
GBPJPY SellExternal structure is now bearish and the internal structure did a liquidity grab. Price should continue lower and go towards asia low to complete daily cycle.
SOLANA could have a major retracement Solana completed a major ABC correction into a supply zone on the higher time frame (HTF), taking out the previous quarter’s highs.
On the daily chart, the RSI is overbought and signals the potential for a significant retracement.
Price action on the 4-hour chart shows a series of lower highs, indicating a bearish trend. If Solana fails to break above the previous high and trigger a market structure shift, the downtrend is likely to continue, leading to a deeper retracement on the higher time frames.

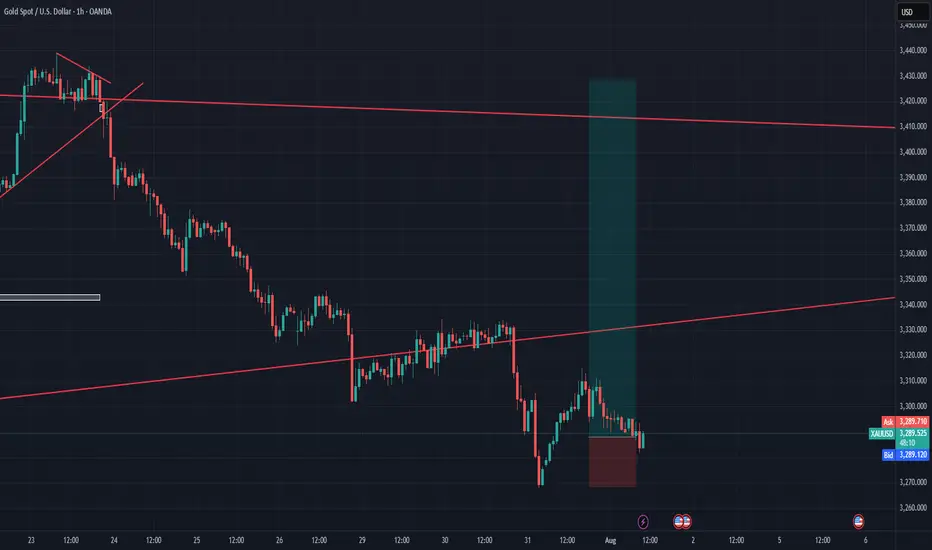
the retail trader outlookWe see that the wedge pattern has been completed and the bullish market is strong as the candles a huge, this is a high risk low reward trade as it clear and obvious to the vest public that the markets wants to rally. the role of the dollar price plays a vital role in this not happening as we see that the dollar has formed the yearly low as is starting to move up in an increasingly high speed suggesting that Gold is more likely to be affected by the sudden Rally in the dollar currency and the opposite is true given a drop in dollar.
Not time to dismount yet!!!Dont get shaken off the horse...yet. There is more to come imo...this is to shake the weak hands...

Gold Spot / U.S. Dollar Analysis (15-Minute Chart)Key Levels
Support Levels:
Immediate: 3,294.000 (S/L level)
Next: 3,280.000
Resistance Levels:
Immediate: 3,304.000 (Entry level)
Next: 3,308.000, 3,316.250, 3,320.000
Profit Targets:
Tiered levels up to 3,328.000 (highest target).
Price Action & Trends
Current Trend:
The price is bullish (+0.84% today) but hovering near the entry level (3,299.000) and testing 3,302.700.
The presence of multiple profit targets above suggests a bullish bias in the trade setup.
Critical Observations:
Price recently dipped to 3,294.000 (S/L) but rebounded, indicating buying interest at support.
The 3,304.000 level (entry) now acts as resistance. A breakout above could target 3,308.000+.
Volume & Momentum:
Not visible in the screenshot, but the upward movement suggests moderate bullish momentum.
Trade Setup Analysis
Entry: 3,299.000
Stop-Loss: 3,294.000 (5 USD below entry)
Profit Targets:
3,304.000 (Breakeven+)
3,308.000 → 3,328.000 (Scalping opportunities).
Risk-Reward Ratio:
If targeting 3,328.000, the RR is ~5:1 (29 USD profit vs. 5 USD risk).
Actionable Insights
Bullish Scenario:
Hold if price sustains above 3,304.000 (entry resistance).
Next target: 3,308.000.
Bearish Caution:
If price falls below 3,294.000 (S/L), exit to limit losses.
Watch for rejection at 3,304.000 (potential reversal).
Market Context:
Gold is sensitive to USD strength and geopolitical events. Monitor broader trends for confirmation.

SUIUSD – Snapped Trend, Needs FuelSUI launched off $3.62 support, breaking trendline and 200 SMA around $3.81, reaching $3.95. RSI got hot (~63) and now turning. It’s pausing under resistance, forming a potential flag. $3.89 is key support to hold for next push. Below that risks retracing deeper.

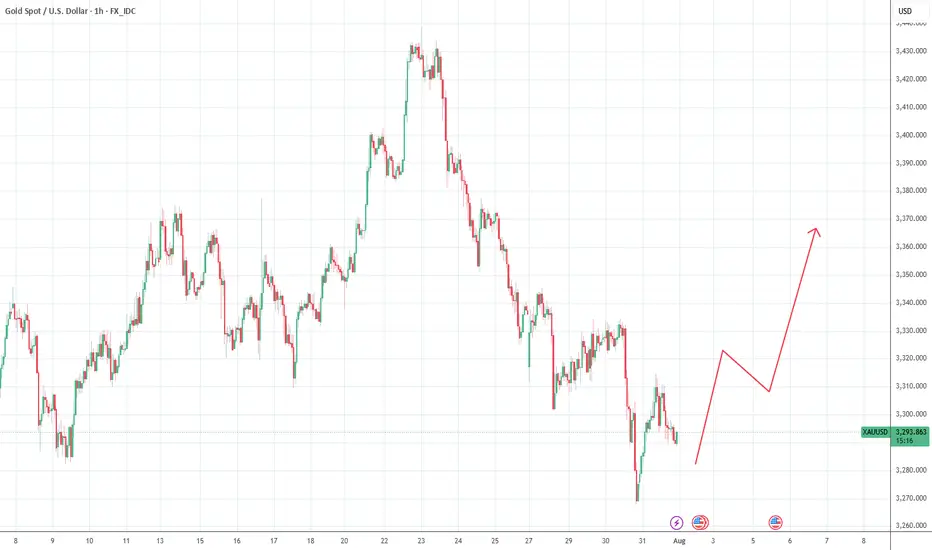
Where is GOLD going next?In the last four months, GOLD privided us a common pattern (for four times) that usually lead to an explosive moves. Where are we going next and what could be the target? In this case, time help us to understand better. The pattern is not complete yet and i expect the move to run in 24 hrs (maybe due to the high impact news will we have tomorrow, like the Initial Jobless Claim and CPE?). Now we just need to understand where the price will go to make profits, and to try to understand this we will check the RSI and the MACD. When this pattern occured, the RSI was rising and above 50 for three times with MACD on bullish cross (the three times that the price pumped) and was chopping and struggling close to 50 (but below it) with a bearish cross on MACD the single time it crushed. If we look at the actual situation, RSI is rising and MACD it's on bullish setup, but i will update you tomorrow (or when a breakout will occur). Now, for the possible target, we can easily aim to $100 move. So, price can touch $3420 for a long or $3240 for a short.
What do you think guys? Let me know in the comments!

Weekly setup for BTCLast week i was waiting for a short confirmation on Bitcoin, a confirmation that has never arrived. But setups are made for this: we wait the right moment to join the market, based on a cold analysis. Considering that the support area looks still strong, i will now wait for a retracement till the key level at $116.550. Around this level i will look for a rejection to enter long, targeting the resistance zone at $119.000

GOLD BUY M15 Gold (XAUUSD) 15-Min Chart Analysis – July 31, 2025
The chart shows a clear bullish structure after a confirmed Change of Character (ChoCH) and Break of Structure (BOS) on the lower time frame. Price has broken above previous resistance zones, indicating strong buying momentum.
Entry Zone:
Price is currently retesting a demand zone (highlighted in pink).
Ideal buy entry was taken after the bullish ChoCH.
Stop Loss:
SL: 3397, placed just below the demand zone for risk protection.
Targets / Resistance Levels:
1. First Resistance: 3308
2. Second Resistance: 3311
3. Third Resistance: 3316
4. Final Target: 3325
Bias:
Bullish, expecting higher highs as long as price holds above the demand zone.
Break and retest strategy is forming, suggesting continuation toward the final target.

EURUSD Bearish Breakout !
HI,Traders !
#EURUSD was trading along
The rising support line but
Now we are seeing a bearish
Breakout so we are bearish
Biased and we will be expecting
A further bearish move down !
Comment and subscribe to help us grow !
