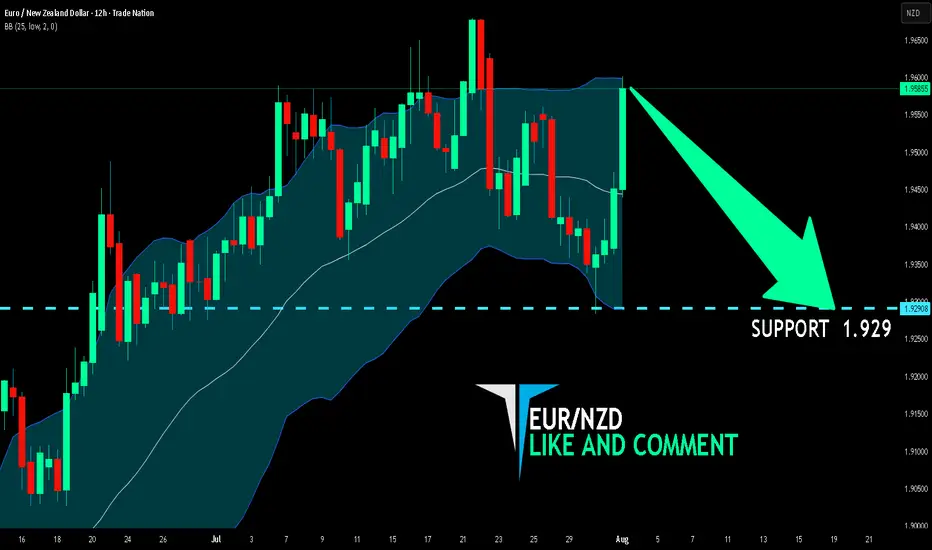
EUR/NZD BEARS WILL DOMINATE THE MARKET|SHORT
Hello, Friends!
EUR/NZD pair is trading in a local uptrend which we know by looking at the previous 1W candle which is green. On the 12H timeframe the pair is going up too. The pair is overbought because the price is close to the upper band of the BB indicator. So we are looking to sell the pair with the upper BB line acting as resistance. The next target is 1.929 area.
Disclosure: I am part of Trade Nation's Influencer program and receive a monthly fee for using their TradingView charts in my analysis.
✅LIKE AND COMMENT MY IDEAS✅
Wave Analysis
Gold Weekly Summary and Forecast 8/2/2025In monthly TF, gold has completed the full Elliot wave and it should go into a series of correction. But in 2W TF, it printed out a green bar. However, the trendline still valid. As long as the trendline is not broken, I am still bearish in gold in medium term.
Therefore, for next week, gold should first go up and should be capped at 3410. Price could quickly drop after that.
Let's see how the market plays out next week.

BTCUSDT: Elliot Wave AnalysisAs you can see in the chart, the fourth wave has ended and there is a possibility of an increase in the next stage to the level between 128,000 and 131,000, followed by a correction for a larger fourth wave and finally the last leg of the increase to the fifth wave, which has the possibility of reaching 139,000 to 140,000.

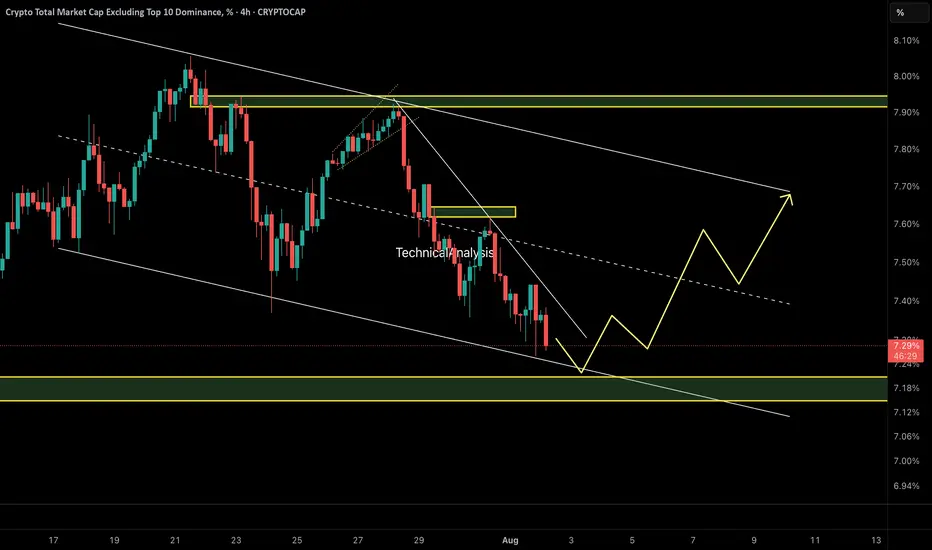
OTHERS.D – Perfect Reaction to Previous AnalysisAs predicted in the last update, OTHERS.D broke structure and dropped sharply toward the 7.20% demand zone — exactly as expected.
Now, we’re waiting for a potential bullish reaction from this key area. If demand holds, a move toward the upper channel boundary (~7.70%) could follow.
🧭 Technical Outlook:
• Price tapped into a key demand zone at 7.20%, which aligns with the lower boundary of a descending channel.
• A bullish reaction is forming, suggesting short-term strength in altcoins.
• A move toward the channel top near 7.70% is now on the table if demand holds.
⚠️ Important Note:
This move is likely to remain a corrective rally unless we see a proper breakout above 7.70% with volume and structure shift. Be selective with altcoin longs.
🔍 Watch for:
• Reaction at 7.50% midline
• Price behavior at 7.70% resistance
• Structure shift or failure pattern near channel top
⚠️ Caution: This remains a corrective rally unless price breaks 7.70% with structure shift.
🔗 Analysis by CryptoPilot
why not eh doodling on the chart, I can change my mind depends on how price moves
key levels and 4 trendlines to gauge the stenght of the waves
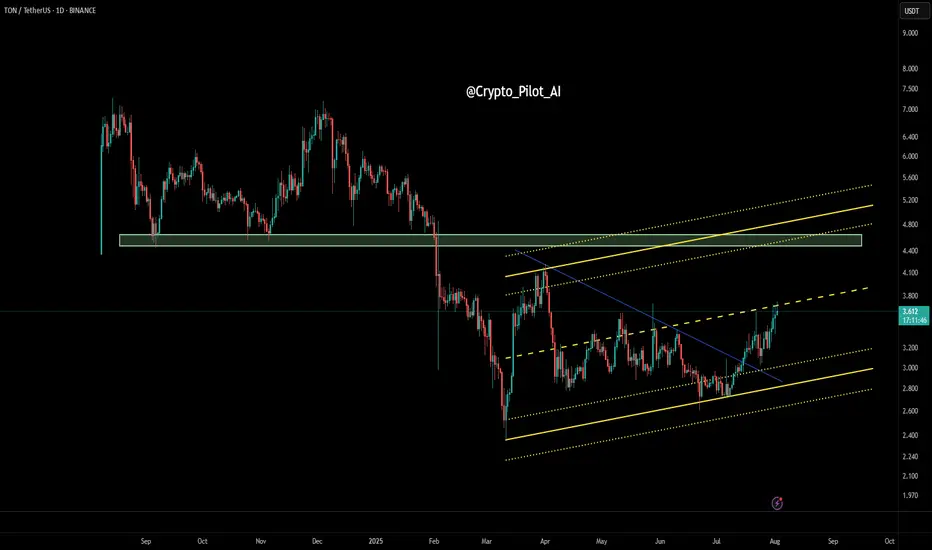
TON/USDT – Daily Price Action Analysis🔹 Price has broken a major descending trendline and entered an ascending channel.
🔹 Currently testing the mid-range resistance zone around $3.60 – $3.70.
🔹 If buyers hold above this area, the next targets could be $4.40 – $4.80.
🔹 If rejected, key supports are at $3.20 and $2.90.
BTC VS AI ?Hi
I had asked AI the probabilities and projection from previous moves.
So here goes; as you know accuracy is vague and shall not be absorb as 100%
Just analysis and probabilities.
Need clearer confirmation when taking a trade .
Given that the current price is 113,000, let's analyze whether the price has extended beyond previous retracement projections and then develop the next projection accordingly.
Recap from previous data:
Second move: price moved from 99,000 to 122,000
Projected retracement price (29.41%) was approximately 115,236
Current price at 113,000 is below 115,236 (projected retracement), meaning it has retraced more than expected before potentially continuing upward.
Interpretation:
Since 113,000 < 115,236, the price has actually retraced deeper than initially projected from the previous move.
This could suggest a stronger correction or weakness in the upward movement before continuation.
If the price started at 122,000 high and retraced below the anticipated retracement level, it may find support around current or slightly lower levels before attempting to move higher again.
Next projection based on current price of 113,000:
New retracement % on second move:
Move up: 122,000 - 99,000 = 23,000
Actual retracement: 122,000 - 113,000 = 9,000
Actual retracement % = (9,000 / 23,000) × 100 ≈ 39.13%
Updated retracement level is closer to a Fibonacci 38.2% retracement level, which is a common retracement level in markets.
Project next upward move:
Use the previous average upward move for projection: 28,500 (from prior analysis).
Starting point for next move projection: 113,000 (current price after retracement)
Next projected high = 113,000 + 28,500 = 141,500
Probabilities:
Retracement around 38.2% usually has a probability around 20-25%, slightly less frequent than 29-30%, but still common.
Uptrend continuation probability after retracement remains >60% if the trend is strong .
Summary Table with updated data:
Feature Value
Current Price 113,000
Previous High 122,000
Move Up Range 23,000
Actual Retracement Amount 9,000
Actual Retracement % 39.13%
Projection for Next High 141,500
Probability of 39% Retracement 20-25%
Probability of Uptrend Continuation >60%
Conclusion:
The price has retraced more than initially projected from previous data but still within reasonable common retracement levels (around 38%).
Assuming the uptrend holds, the next price move could push toward approximately 141,500.
It’s advisable to watch key support levels near 113,000 for signs of reversal or further retracement.
All the best
Lets see in we can trust it
Not a guru

Sui chance for +60% on this zoneSui continue to grap liquidation but on the monthly and weekly timeframe we are still bullish.
I just saw good zone for trade. At 3.15 we have daily EMA + fibonacci 0.64 + Daily FVG.
I will suggest to add some leverage because invalidation is close to 2.9.
In this mid term bull market of altcoins we can see that SUI has good performance.
Ivan

In the big picture ,it is seen as the end of Wave 4 This is likely to be the strart of downtrened in wave 1 of wave 5.

#GOLD #XAUUSD Seems to have ended the correction FX_IDC:XAUUSD Gold Spot might have completed the correction as a complex 3-3-5 FLAT, and is currently turning higher in wave (ii), however this get invalidated if THE LAST LOW OF 3268.19 BREAKS. Till the pivot 3268.19 stays strong, the move should be impulsive and take us to new high near term.

NE - Looking for strong bullish continuationN wave with N, NT & V projection.
Cup & Handle pattern.
The pattern strongly resembles a "Cup and Handle" formation, supported by an N wave structure with Ichimoku alignment.
Cup and Handle Pattern
Cup Shape: Smooth U-curve from Nov 2024 to Jul 2025.
Handle: A short pullback forming higher lows between late July and early August.
Breakout Area: 0.740 is the rim resistance — breakout above this will confirm the Cup & Handle.
- Valid Cup & Handle characteristics:
Rounded bottom (accumulation phase).
Handle with light pullback and low volume.
Breakout attempt with increasing volume (watch confirmation).
Price is well above the Kumo: Clear bullish trend.
- Tenkan-sen > Kijun-sen: Short-term momentum is bullish.
V as immediate resistance at 0.715. If price stay above this level, confirming the bullish continuation.
Entry (Breakout Buy) 0.740 (above resistance/handle)
Aggressive Entry 0.660–0.675 (on handle support bounce)
Stop Loss 0.620 (below handle and Tenkan/Kijun)
TP1 (V) 0.715
TP2 (NT) 0.770
TP3 (N) 0.815
- Chikou Span is above the cloud and price: Confirming trend support.
- Kumo Future is Bullish: Strong foundation for continuation.
Note:
1. Analysis for education purposes only.
2. Trade at your own risk.

WESTRVR - Looking for potential bullish movementN wave with E, V, N & NT projection.
The wave pattern suggests an ongoing correction after a downtrend, with potential for upward movement toward the E and V projections if the breakout occurs.
The price has been consolidating around the NT level (0.250), and a breakout above this could signal a bullish move.
Resistance is near the 0.235-0.240 level; a confirmed break above this level would strengthen the bullish case.
Volume remains relatively stable, so confirmation of a breakout through volume would add validity.
The projections provide targets for potential upward movement:
Short-term target: ~0.250 (NT)
Medium-term target: ~0.290 (N)
Longer target: ~0.305 (V)
Extended target: ~0.330 (E)
Entry: Consider entering a long position if the price decisively breaks above 0.250 with volume confirmation.
Stop Loss: Place SL below recent lows, around 0.220 to manage downside risk.
Note:
1. Analysis for education purpose only.
2. Trade at your own risk

Will the DOW every Rally after Tariffs?Disclaimer: I do NOT know what I am doing.
Based on Elliot Wave, recent consolidation, and Phi sequencing, the pullback for 'Merican production should fire up the movement.
Eur/Audin this pair we can buy save i dont see sell signals , any way be cearful use money management

Usd/Cadafter three bottoms its time to go up , return to my last chart on CAD u can see what i have said, buy.

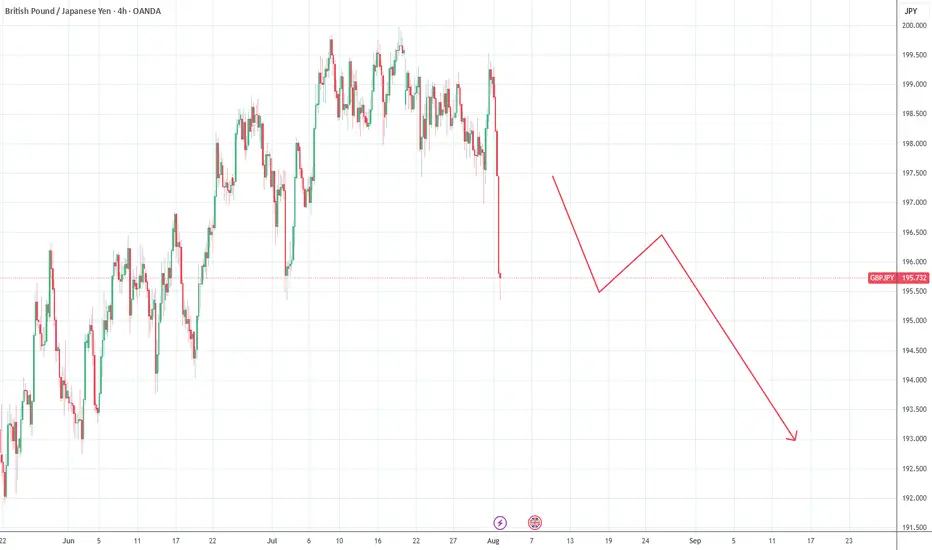
Gbp/jpy sellno wonder its friday , last signal was complete wrong , any way gbp/jpy going up but we must test 192 to 190 at first
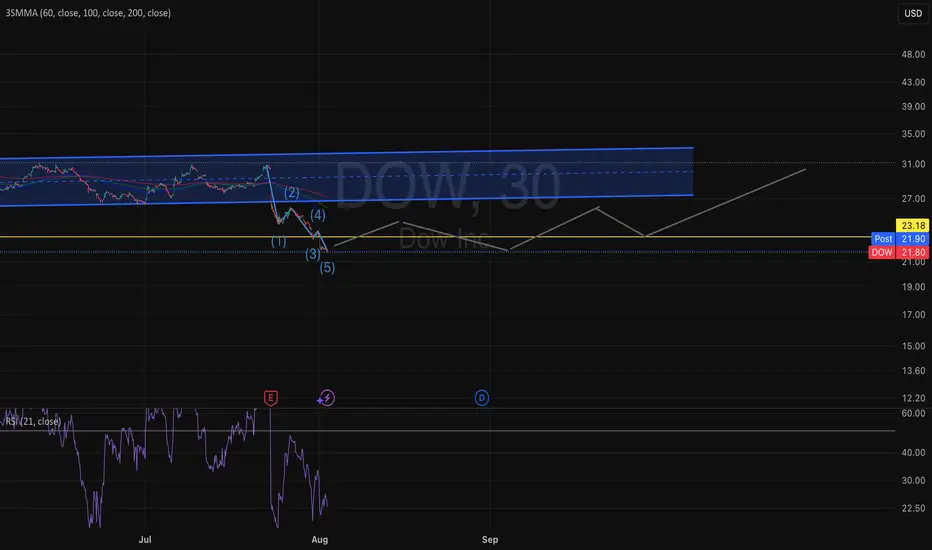
Dow Jones Wave Analysis – 1 August 2025
- Dow Jones broke the support zone
- Likely to fall to support level 43000.00
The Dow Jones index broke the support zone between the support level 44000.00 and the 38.2% Fibonacci correction of the upward impulse from June.
The breakout of this support zone accelerated the active short-term correction iv.
Dow Jones index can be expected to fall to the next support level at 43000.00 (target for the completion of the active correction iv and the former resistance from May and June).

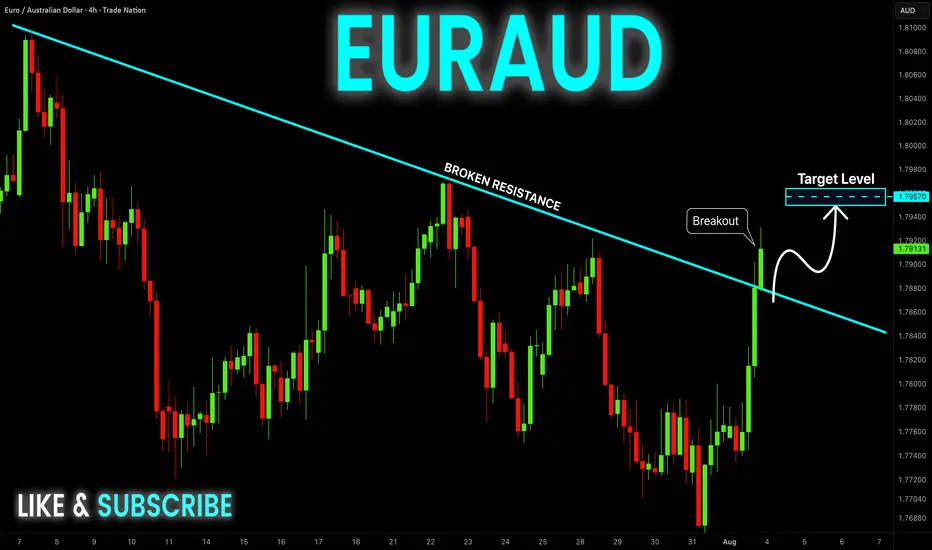
EUR-AUD Bullish Breakout! Buy!
Hello,Traders!
EUR-AUD made a bullish
Breakout of the falling resistance
And the breakout is confirmed
So we are bullish biased
And we will be expecting
A further bullish move up
On Monday!
Buy!
Comment and subscribe to help us grow!
Check out other forecasts below too!
Disclosure: I am part of Trade Nation's Influencer program and receive a monthly fee for using their TradingView charts in my analysis.
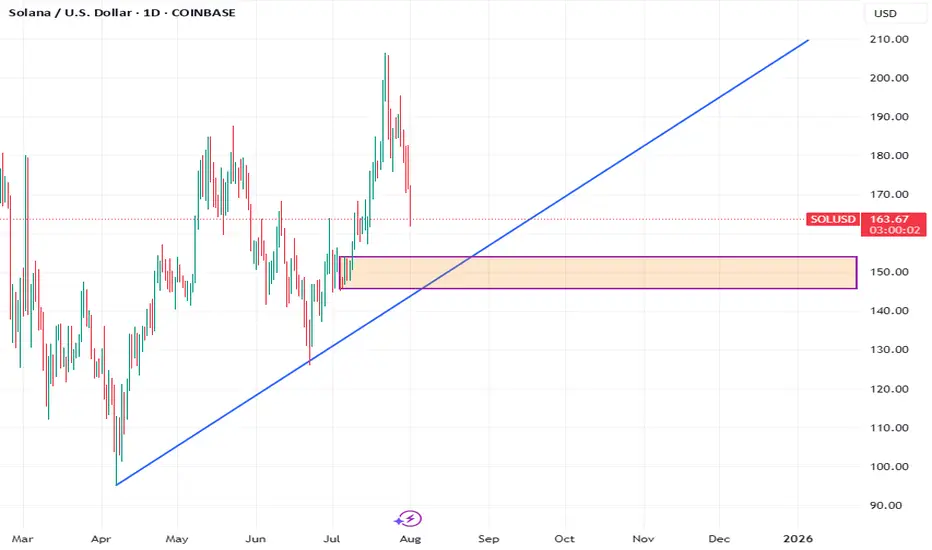
SolSolana is currently in a correction phase, and a strong demand is forming near the 151 area.
As per the rules, the market should ideally start buying from here.
Looks like $ investors switch possible - Crypto rules??Hello fellow traders,
Just looking at the chart of total market cap and based on trend line weekly focus- this is it- a point at which crypto market might start to recover and go for 2 x what it has in total, heading for 5t?? Let me know in your comments what do you think? Also, many investors might start diversifying their portfolio since Fridays 'crash' hence I wouldn't be really surprised if next week brings some $ into crypto !
It's just my idea don't copy think and do your own stuff

HYPEUSDT at Support HYPEUSD is trading in a symmetrical triangle and price has now reached the support trendline the price may reverse from here to reach the upper trendline resistance .

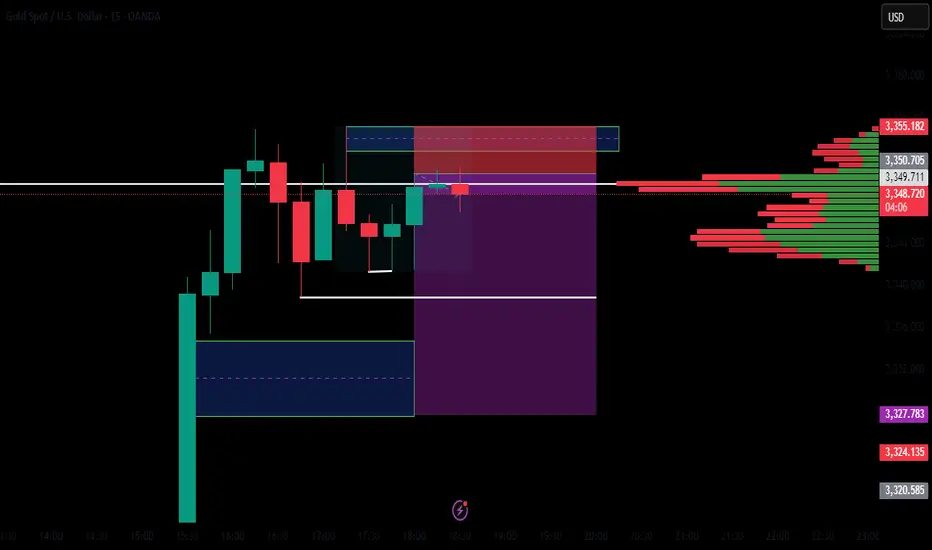
xauusd sellsell xauusd
XAUUSD
idea order block active with high volume here
and it back to test it
OANDA:XAUUSD