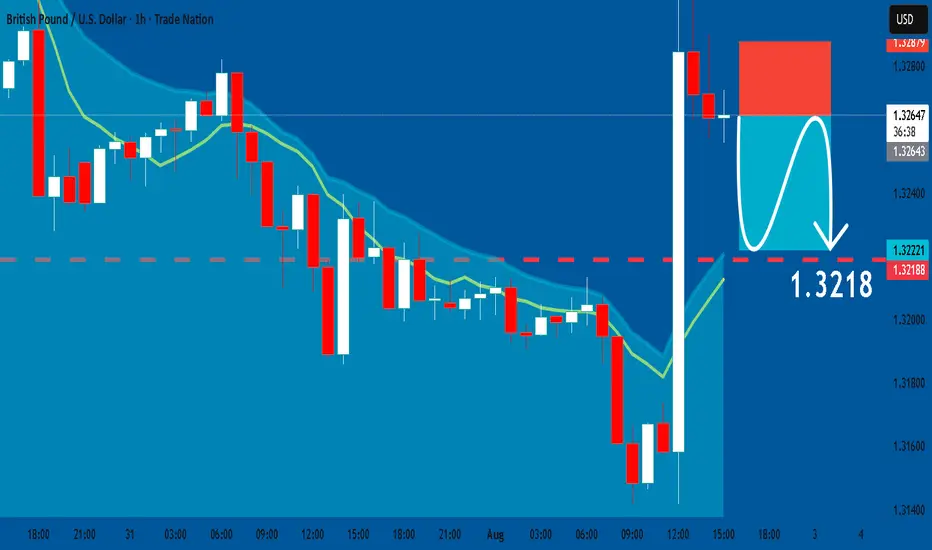
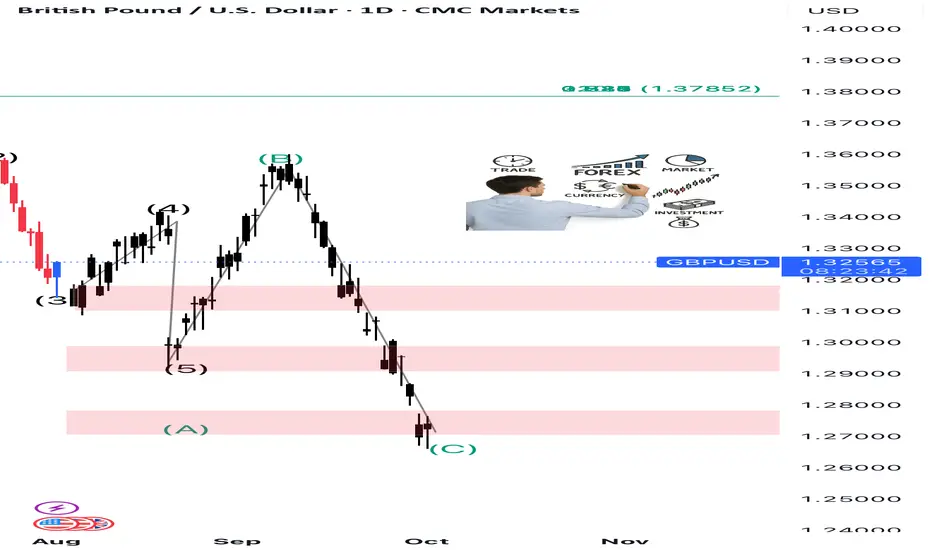
GBPUSD: Bearish Continuation & Short Signal
GBPUSD
- Classic bearish setup
- Our team expects bearish continuation
SUGGESTED TRADE:
Swing Trade
Short GBPUSD
Entry Point - 1.3264
Stop Loss - 1.3287
Take Profit -1.3218
Our Risk - 1%
Start protection of your profits from lower levels
Disclosure: I am part of Trade Nation's Influencer program and receive a monthly fee for using their TradingView charts in my analysis.
❤️Please, support our work with like & comment! ❤️
Wave Analysis
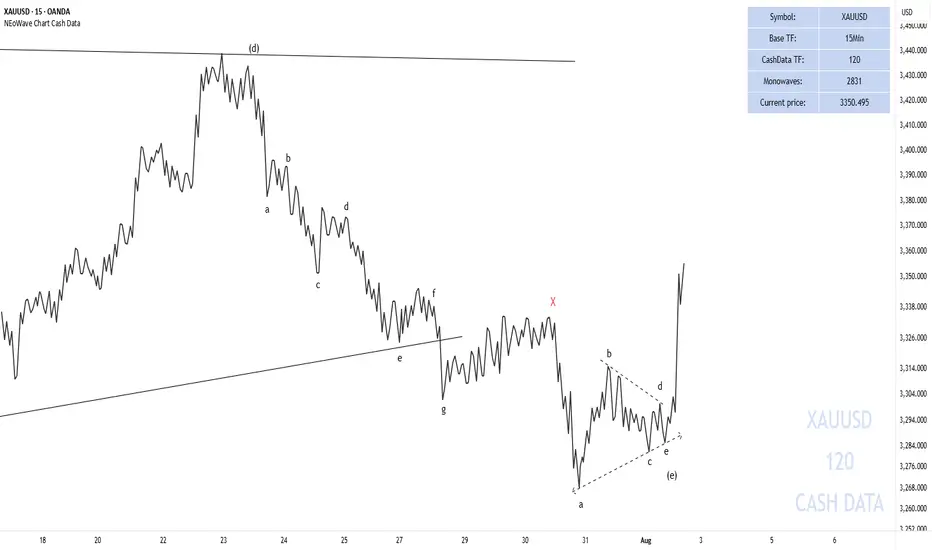
End of GOLD correction#GOLD #XAUUSD
UPDATE
As I mentioned earlier, gold was forming a contracting triangle.
The wave-(e) of the triangle has formed a double pattern diametric-X-triangle and has moved beyond my expectations (the post-pattern movement has passed ), breaking the trendline of (a)-(c). However, since it did not exceed the end of wave-(c), the contracting triangle has not been invalidated.
We expect gold to gradually rise from this range and surpass $3,500.
Good luck
NEoWave Chart
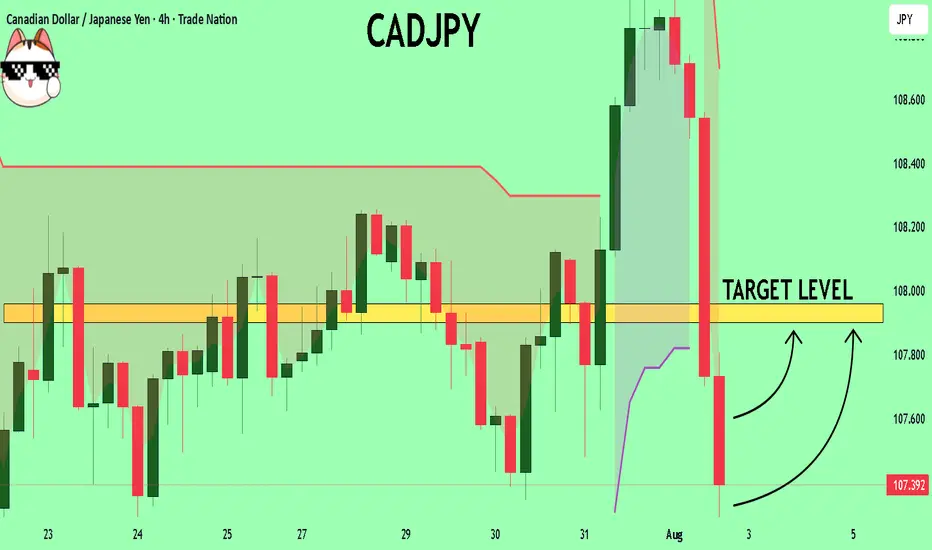
CADJPY Expected Growth! BUY!
My dear friends,
CADJPY looks like it will make a good move, and here are the details:
The market is trading on 107.35 pivot level.
Bias - Bullish
Technical Indicators: Supper Trend generates a clear long signal while Pivot Point HL is currently determining the overall Bullish trend of the market.
Goal - 107.90
About Used Indicators:
Pivot points are a great way to identify areas of support and resistance, but they work best when combined with other kinds of technical analysis
Disclosure: I am part of Trade Nation's Influencer program and receive a monthly fee for using their TradingView charts in my analysis.
———————————
WISH YOU ALL LUCK
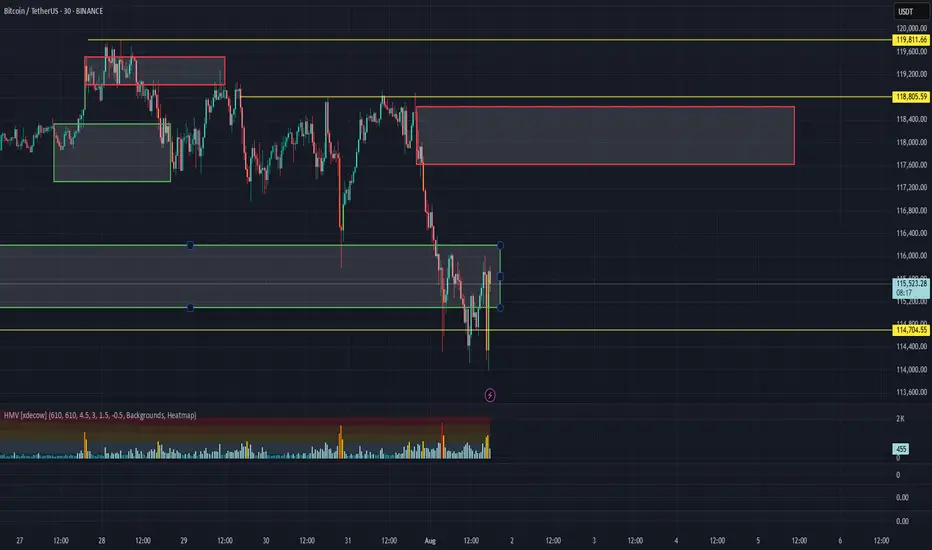
BTC/USDT Analysis – Negative Sentiment Returns
Hello everyone! This is the daily analysis from the trader-analyst at CryptoRobotics.
Yesterday, Trump officially imposed tariffs on 68 countries, which are set to take effect on August 7. The legality of these tariffs is already being challenged in court. The market reacted extremely negatively to this development — despite the overall positive technical setup and volume distribution, Bitcoin dropped to $114,000, deeply testing the volume zone and local lows.
Despite all of this, the bullish scenario should not be ruled out. The price action during the decline has been weak: while selling pressure is high, it has not led to a full breakdown of the lows. At this stage, it’s better to avoid opening new positions. Consider long setups only after a test of the $117,600–$118,600 supply zone, and watch for a buyer’s reaction on the retest.
If negative momentum continues, the price could drop further to the next support zone.
Buy zones:
• $110,000–$107,000 (accumulated volumes)
Sell zones:
• $117,600–$118,600 (accumulated volumes)
This publication is not financial advice.
Rackspace Technology inc. W2 of W1 completed.
We are facing a Motive powerful 3rd Wave of W1 now.
Target price of W1 = 3$
Highly recommended for Buying Right Now ✅️ 👌

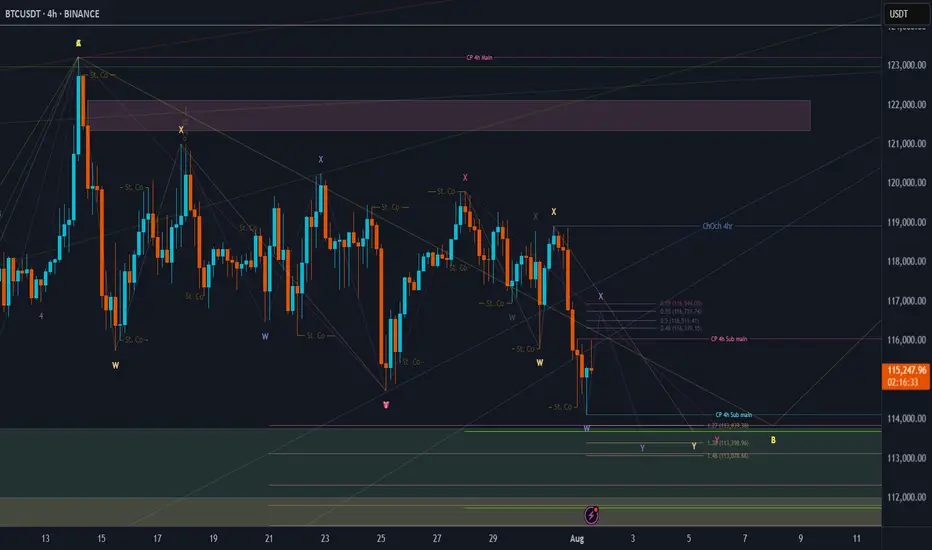
BTC Price Prediction and Elliott Wave AnalysisHello friends,
>> Thank you for joining me in my analysis. We have finished the pink X wave directly, then we have gone to the final pink Y wave, which consists of wxy in orange counting. Now we are moving into the final Orange Y wave.
>> our confirmations:
* 4Hr TF: Breaking 118990 for the next hours, we will end the whole Yellow B "correction" wave successfully. .
Keep liking and supporting me to continue. See you soon!
Thanks, Bros
More Pullback=Further Launch!!The structure has morphed
once again but the direction expectation
is still 100% in tact. In fact, all
we're doing right now is pulling
the bow string back a little more to
allow the arrow to fly up that
much further and faster! BTFD!!!!

Big money coming? Here, NFP data XAUUSD Technical Analysis PredDXY forecast today
XAU USD forecast today
EURUSD forecast today
NFP Data Forecast: Xauusd buys SELV sales for mass profit! Your latest gold trade guide confidently during the production of this most important wages is not related to the farm. In this video you will receive technical analysis from XaUUSD experts and proven adjustments for XaUUSD sales. It breaks down how you interpret forecasts for NFP data, how it affects gold prices, and where the best opportunities are. Whether you're a day trader or swing, this video gives you real information to plan your trade and plan your risk management as an expert. Don't miss this opportunity to turn your data into profits ahead of the market. Now look, trade more intelligently and go ahead with the crowd!
#NFPDATAFORECAST
#xauusd
#GoldTrading
#technicalalyasis
#forexsignals
#GoldPrice
#daytrading
#swingtrading

DAX - potential buyPotential buy on the German index as we are coming out of the 30min correction that followed a first small impulse to the upside. Conservative target is a move equivalent to the first 30 min setup. Optimal target are the break of the top and even better the 24.85 area. Levels on the chart. Trade with care.

Exciting GBP/USD
🚨 **We’re currently deep in wave (2) correction**
What’s unfolding? Most likely a zigzag — or even a double zigzag. Volatility is cooking up something big!
💥 But here’s the real thrill… once this phase wraps up:
📈 **Brace for a fiery wave (3) rally** — a breakout move that could shake up the market 💸
🎯 Ready to ride the next wave? This is not the time to sit back — smart analysis and timely action could make all the difference.
#Forex #TechnicalAnalysis #GBPUSD #OpportunityIsComing
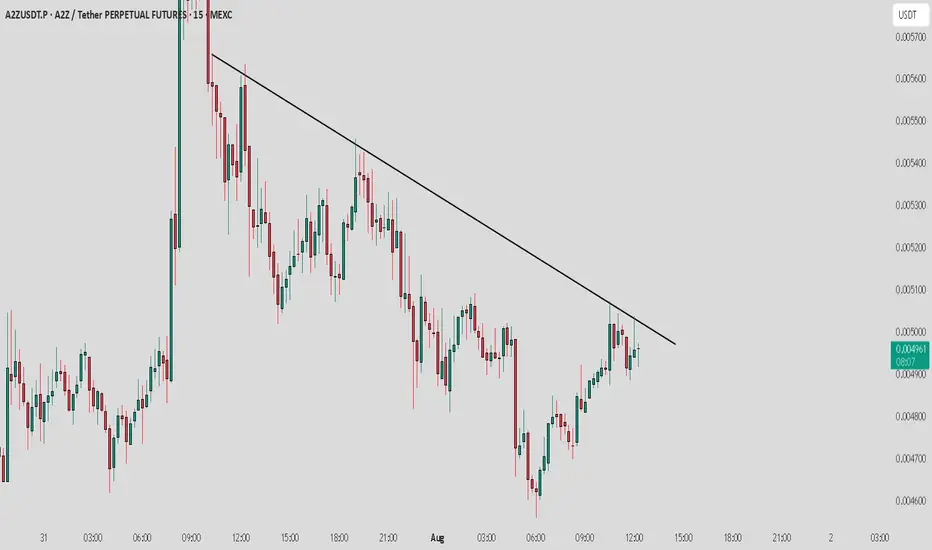
A2Z / USDT : Near trendline and showing weakness, Avoid long A2Z/USDT - Nearing Trendline Resistance
A2Z/USDT is approaching a crucial trendline resistance.
Bearish Scenario:
Failure to break the resistance could lead to further consolidation or a potential reversal, testing lower support levels.
Keep an eye on the trendline and volume for the next key move.
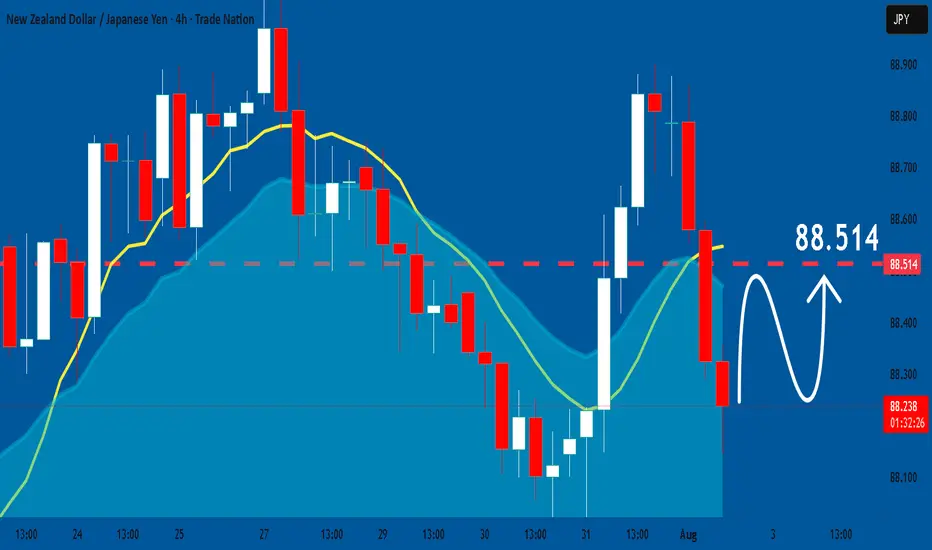
NZDJPY: Bullish Continuation
The recent price action on the NZDJPY pair was keeping me on the fence, however, my bias is slowly but surely changing into the bullish one and I think we will see the price go up.
Disclosure: I am part of Trade Nation's Influencer program and receive a monthly fee for using their TradingView charts in my analysis.
❤️ Please, support our work with like & comment! ❤️
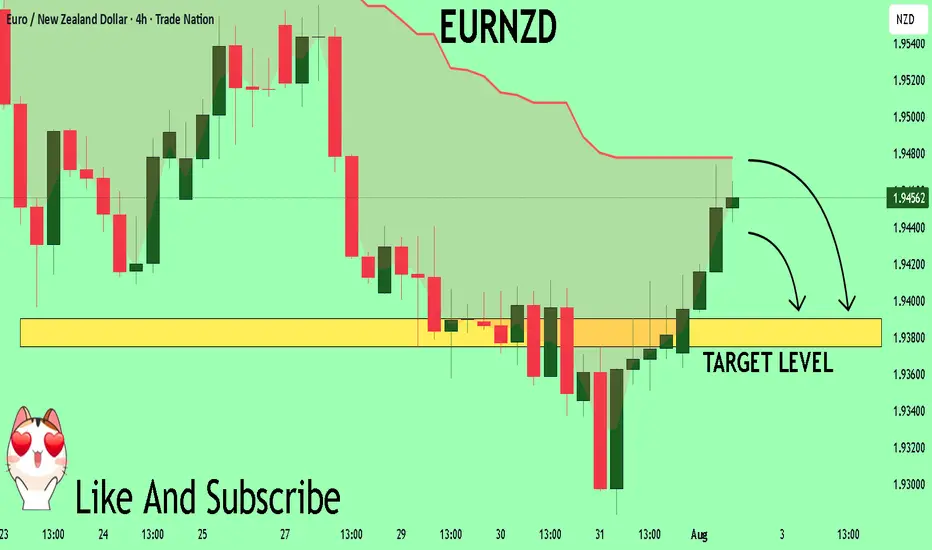
EURNZD Set To Fall! SELL!
My dear subscribers,
This is my opinion on the EURNZD next move:
The instrument tests an important psychological level 1.9459
Bias - Bearish
Technical Indicators: Supper Trend gives a precise Bearish signal, while Pivot Point HL predicts price changes and potential reversals in the market.
Target - 1.9390
About Used Indicators:
On the subsequent day, trading above the pivot point is thought to indicate ongoing bullish sentiment, while trading below the pivot point indicates bearish sentiment.
Disclosure: I am part of Trade Nation's Influencer program and receive a monthly fee for using their TradingView charts in my analysis.
———————————
WISH YOU ALL LUCK
Second Part ANALYSIS
Part 2: USD/JPY Chart Analysis
It seems that, due to the upcoming NFP news (which will be released shortly), the price is in a state of uncertainty. If the downtrend or price correction continues, this is one possible scenario we could see. However, it might also be better to stay risk-free or even close the trade here.

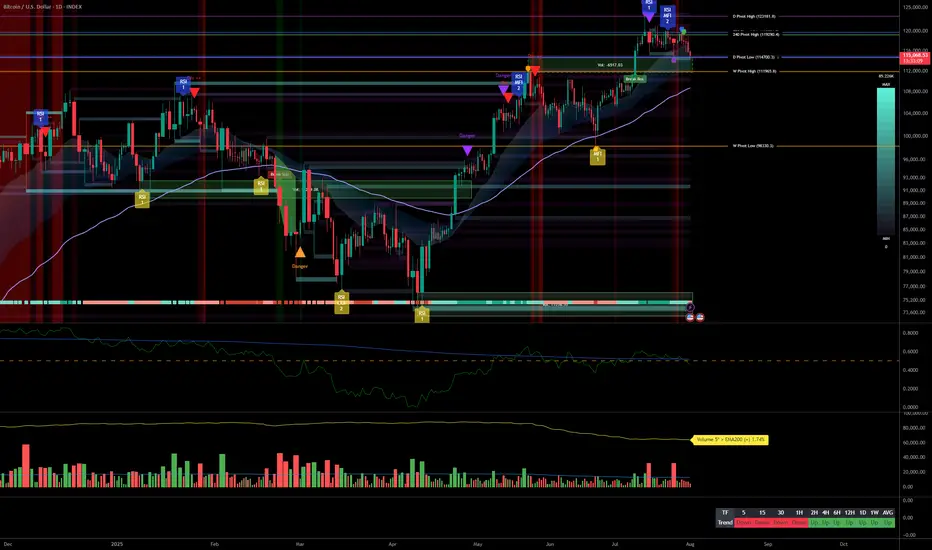
Bitcoin Facing Macro Volatility: Key Supports Hold Firm__________________________________________________________________________________
Technical Overview – Summary Points
__________________________________________________________________________________
Momentum: Dominant bullish bias on higher timeframes (1D to 2H).
Key Supports/Resistances: Key pivot zone at 114.7K–115.8K defended across all timeframes; major resistances at 119.7K, upside extension to 122.3K.
Volume: Peaks on breakout, normal to high volumes depending on TF, no signs of seller capitulation.
Behavioral Indicators: Risk On / Risk Off Indicator remains strong on all strategic TFs; ISPD DIV neutral except for a defensive buy signal on 1H.
Multi-timeframe summary: Broad horizontal consolidation, no panic or euphoria detected. Major supports overlap, confirming structural strength amid macro volatility.
__________________________________________________________________________________
Strategic Summary
__________________________________________________________________________________
Overall bias: Bullish above 114.7K; neutral/slightly bearish below this key level.
Opportunities: Longs via scalping/range trading on reactions at 114.7–115.8K; swing accumulation on daily/4H stabilization above 115K.
Risk: Break below <114.7K, macro volatility around NFP/PMI, false breakouts.
Macro catalysts: Expanded US tariffs (Trump), NFP, PMI, Fed status.
Action plan: Reactivity on pivots, reduce exposure during macro events, hard stops <114.5K H4.
__________________________________________________________________________________
Multi-Timeframe Analysis
__________________________________________________________________________________
1D: Working the 114723 pivot support. Bullish momentum, no excessive selling, Risk On / Risk Off Indicator “STRONG BUY”.
12H-6H: Building a bottom on the daily base; sustained volumes during sell-off, no panic, technical buy signals emerging.
4H-1H: Vigorous support defense, 1H ISPD DIV “buy” signal. Healthy range pattern; volumes up during rebound attempts.
30min-15min: Slow recovery after high-volume drop, no euphoria or capitulation. No “trap” or imminent squeeze, favorable for tactical trades.
Risk On / Risk Off Indicator: Higher TFs (1W/1D/12H/4H) show strong bullish signals, boosting risk confidence. Decorrelation with lower TFs allows flexible management, controlled accumulation, tight stops at 114.7K.
__________________________________________________________________________________
Macro & BTC Context Summary (Twitter)
__________________________________________________________________________________
Macro: US tariff shock, max volatility likely, amplified moves in equities and crypto.
Bitcoin: Sharp correction post-record close, but solid supports remain, no sign of trend end.
Integration: Technical status quo; favor defensive accumulation, caution on NFP/PMI.
__________________________________________________________________________________
Actionable Synthesis: Plan & Risk Management
__________________________________________________________________________________
Strategies: Longs/scalp >114.7K; swing/accumulate post daily/4H confirmation; partial TPs near 119.7K/122.3K.
Risk Zones: Hard stop <114.5K. Tight monitoring around NFP for volatility spikes.
Reward: Risk-to-reward >2 if buying lower range with strict stops.
__________________________________________________________________________________
Key Macro Events to Watch
__________________________________________________________________________________
2025-08-01: US NFP, unemployment, hourly wages – High volatility expected, possible swings
2025-08-01: ISM Manufacturing PMI – Short-term trend confirmation or invalidation
2025-07-30: FED conference – Range-bound / Moderate volatility
US Tariffs (Trump) – Global risk-off, caution BTC & tech
__________________________________________________________________________________
Conclusion
__________________________________________________________________________________
BTC consolidates steadily between 114.7K–122.3K despite macro shocks
Daily/H4 supports robust, Risk On / Risk Off Indicator strong on higher TFs
Accumulation/scalping favored as long as supports defended
Main risk = break of 114.7K, imminent macro volatility
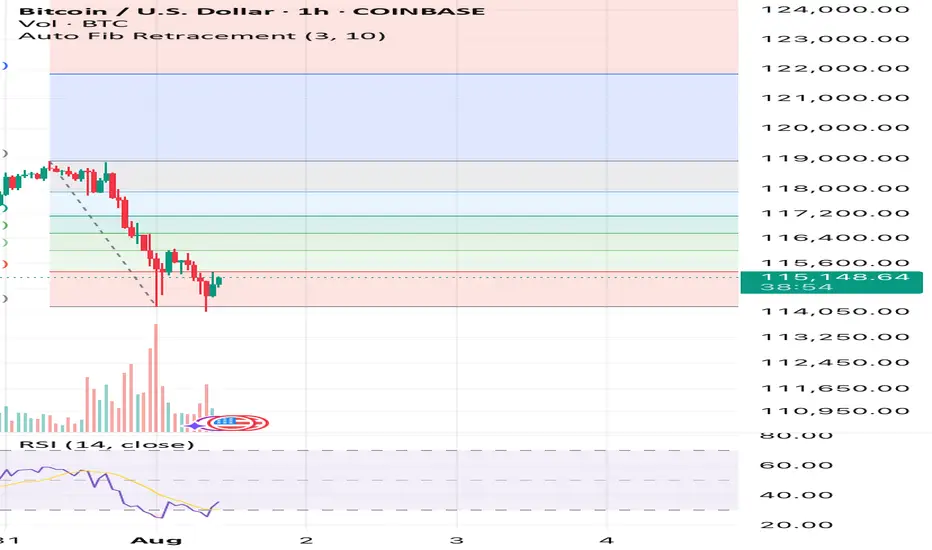
Bitcoin has an upside to it if we hold above $14,900See what you think it’s simple Auto Fib Retracement and RSI. That’s all I’m using here and also past times and other data outside of this image but inside the CRYPTOCAP:BTC market.
What you think? Up to $118k again before down or sideways? Or will this be the end of the large bull flag formation? We’ll soon find out!
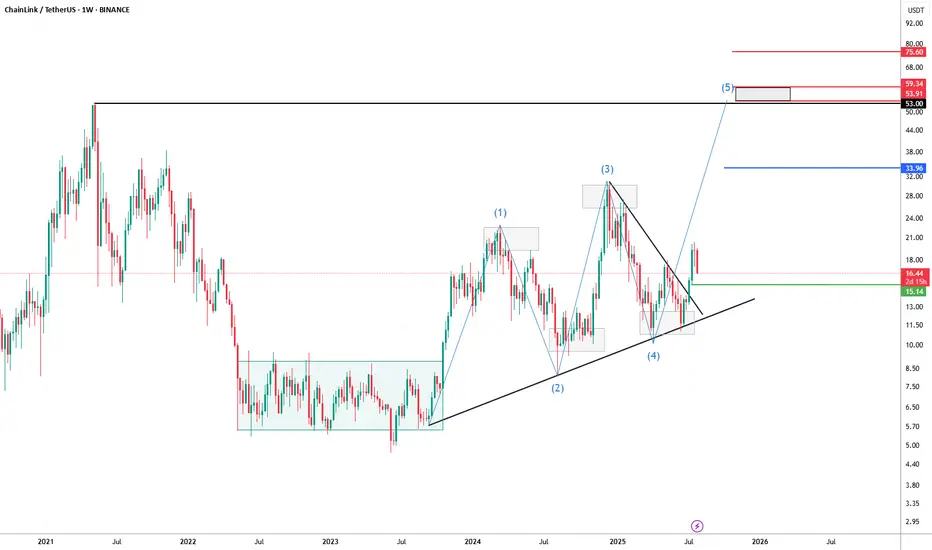
LINK/USDT Weekly Chart – Wave 5 in Play?Chainlink has been showing a textbook technical setup. After spending most of 2023 in a prolonged accumulation phase (highlighted in the range-bound consolidation box), price action broke out and has since been respecting a clear harmonic and Elliott Wave structure.
We’ve now likely completed waves (1) through (4), with a clean breakout from the wedge suggesting the beginning of the final 5th impulsive wave. The projected target zone for wave (5) sits between $53 and $59, aligning with key historical resistance and Fibonacci extension levels.
🔹 Support Zone: $15.14 — key structure and prior breakout level.
🔹 Mid-Level Target: $33.96 — potential resistance and consolidation area.
🔹 Final Target Area: $53.00–$59.34 — Wave 5 objective.
🔹 Stretch Target: $75.60 — if momentum exceeds expectations.
The ascending trendline from mid-2022 continues to act as dynamic support, helping guide this move. As long as the structure holds, the bullish thesis remains intact.
📈 Watching for confirmation of continuation and volume follow-through as we head into Q4.
#LINK #Chainlink #LINKUSDT #CryptoTA #ElliottWave #Harmonics #Altcoins
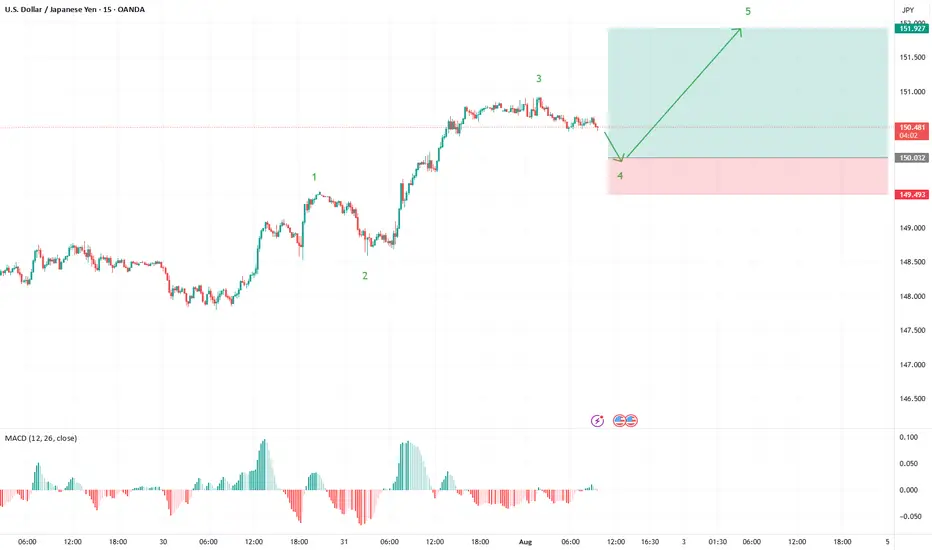
USD/JPY: Fifth Wave Target in SightUSD/JPY is painting a textbook five-wave impulse structure from the recent lows, and we're now positioned for what could be the final act of this motive sequence.
Current Wave Count
✅ Waves 1-3 Complete: Clean impulsive structure with wave 3 showing strong extension
✅ Wave 4 in Progress: Currently correcting from the 150.94 high
🎯 Wave 5 Setup: Targeting completion around 151.95 - 152.20
Key Levels to Watch
Support Zone: 150.00 area (ideal wave 4 retracement)
This aligns with wave principle fourth-wave correction parameters
Provides a healthy pullback without threatening wave 1 overlap
Target: 151.95 - 152.20 zone for wave 5 completion
Classic 5 vs 1+3 projection
Trade Strategy
Monitor for supportive price action near 150.00
Look for an impulsive price action to confirm wave 5 beginning
Structure suggests one more leg higher before a larger correction
The beauty of Elliott Wave: when the count is this clean, the roadmap becomes crystal clear. Let's see if USD/JPY delivers this final push to complete the sequence.
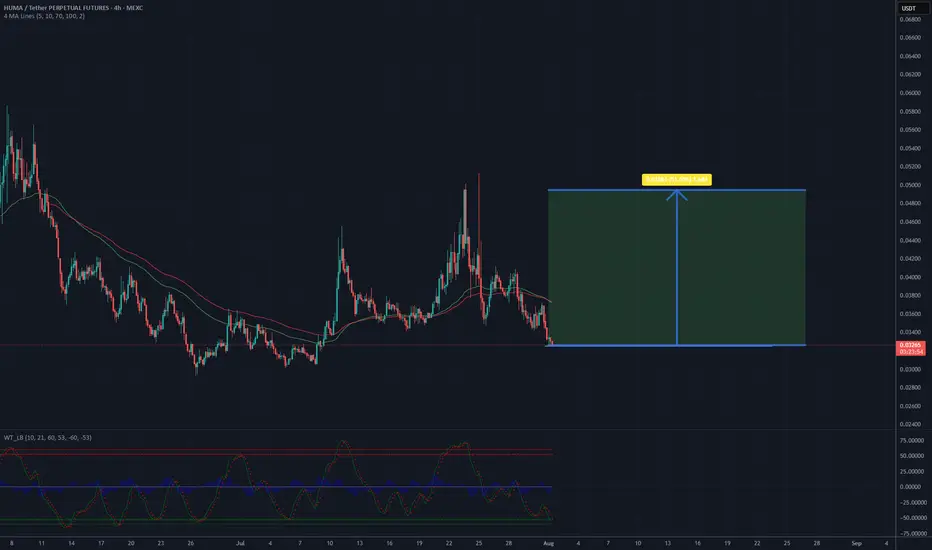
Is it a time fore HUMA? 50% profit - 0.05 USD TargetThe analysis of the HUMAUSDT chart on Binance highlights several key points. The current price is around 0.032764 USD, close to a local low. A clear downtrend is visible since the July peak, but recent days suggest a potential rebound, which could mark the start of an upward movement.
A suggested rise to 0.05 USD (approximately 52% from the current level) is feasible if the price breaks through the resistance around 0.037 USD and stays above the moving average (e.g., 50-day, as shown on the chart). The increase could be supported by rising volume and positive oscillator signals (e.g., RSI above 30, indicating an exit from oversold conditions). A key support level is at 0.03 USD – a drop below this could invalidate the bullish scenario.
I recommend monitoring the breakout above resistance and confirming the trend. For more detailed data, I can perform a DeepSearch to check current market sentiment.
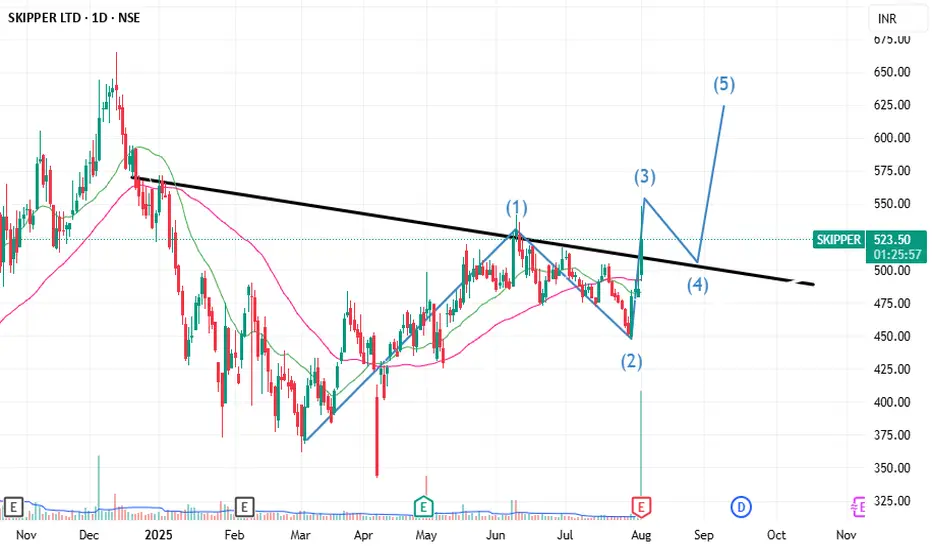
Skipper Ltd Elliot Wave Theory
Looks Great for a Target of 600-620+
Can be added on Dips till 505 Levels
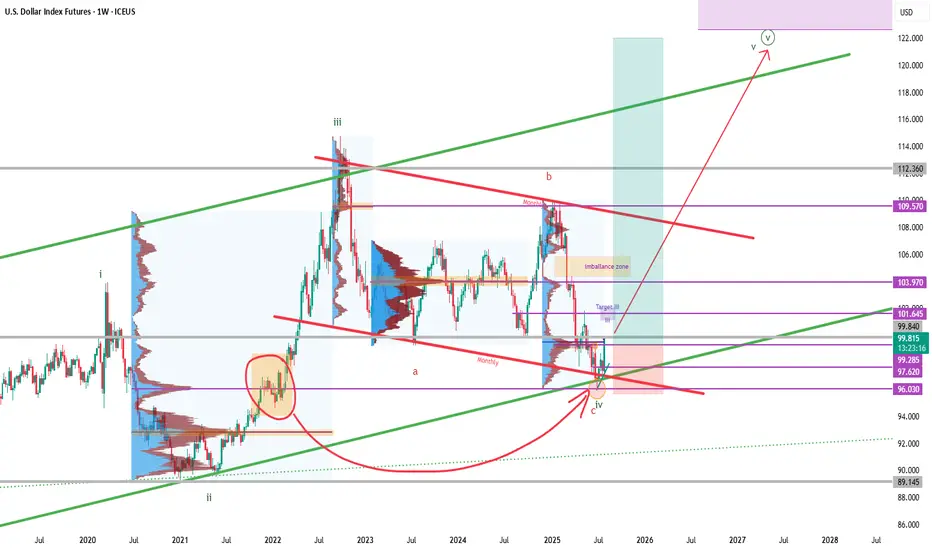
DXY - Dollar Index - Potenzial New Long phase
As we see in the chart .. in 2022 december we had a big volume accumulation before the october 2022 top to 112
After that we had a rebound and a laterality from sep. 22 to july 25.
In this moment we touche this volume and from my point of view we completed an ABC pattern.
Probably we have completed the pattern with a final Impulsive wave C and in this moment we start the final LONG wave 5
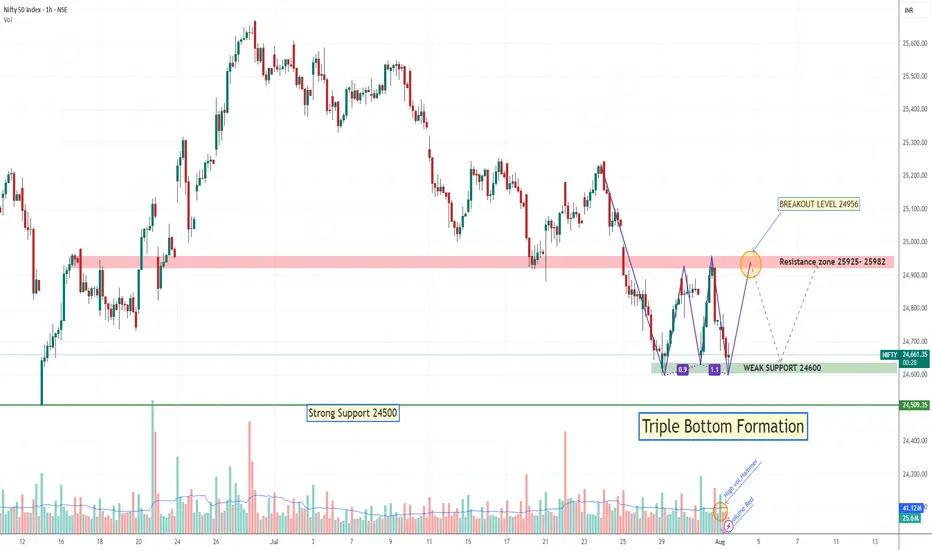
Tripple Bottom Formation if Hold 24600Nifty 3rd Time Tested 24600 level if it Break next Strong support 24500, if hold then may rallied again till 24956. May be Falling red candle is just testing candle of High-volume Hammer.
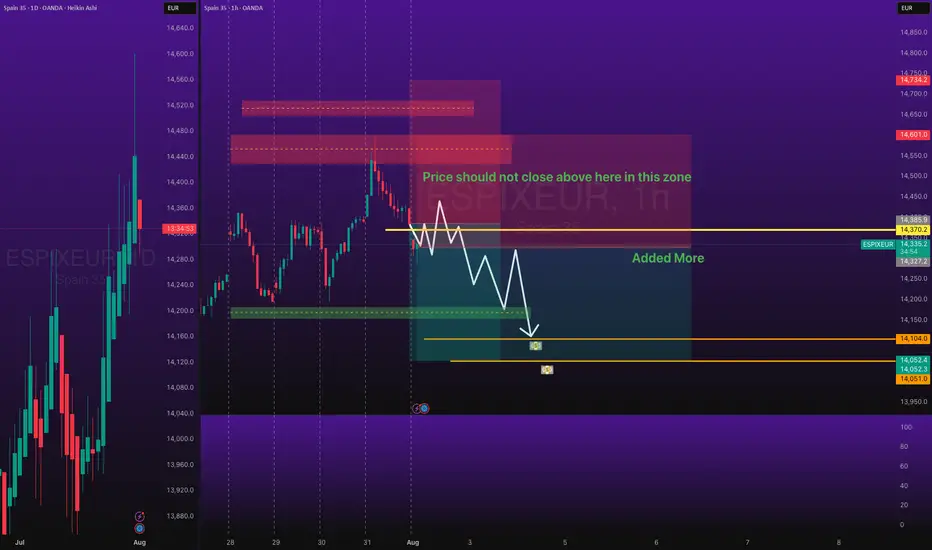
ESPIXEUR Short Trade with SL and TPOANDA:ESPIXEUR Short Trade - Low Risk, with my back testing of this strategy, it hits multiple possible take profits, manage your position accordingly.
Note: Manage your risk yourself, its risky trade, see how much your can risk yourself on this trade.
Use proper risk management
Looks like good trade.
Lets monitor.
Use proper risk management.
Disclaimer: only idea, not advice