Gold sell pull back before major buy My many observations using Elliot wave and supply & demand confirm my bias
Wave Analysis


#XRPUSD 1st Aug Looking for one more move higherBINANCE:XRPUSD Looking for one more push to higher, and bullish as far as IV is intact. Any rally should find buyers in 3-7 swings and reach one more high minium.

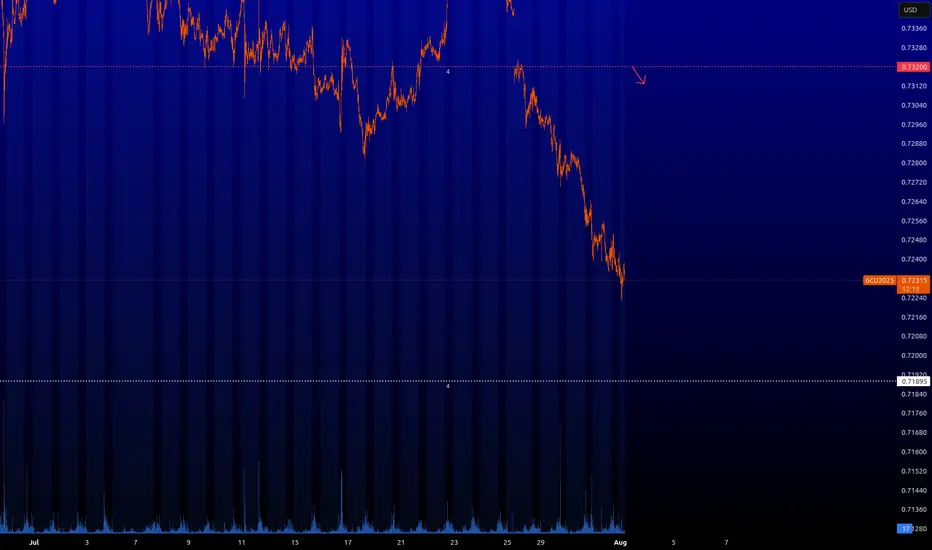
6C : Short levelIt is possible to take a short-term short from the red level with an arrow. I would recommend taking short-term trades and not sitting around waiting for huge profits. But this is already at your discretion.
⚠️ VOLATILITY WARNING ⚠️
Trading around major news can be extremely unpredictable. Trade responsibly!
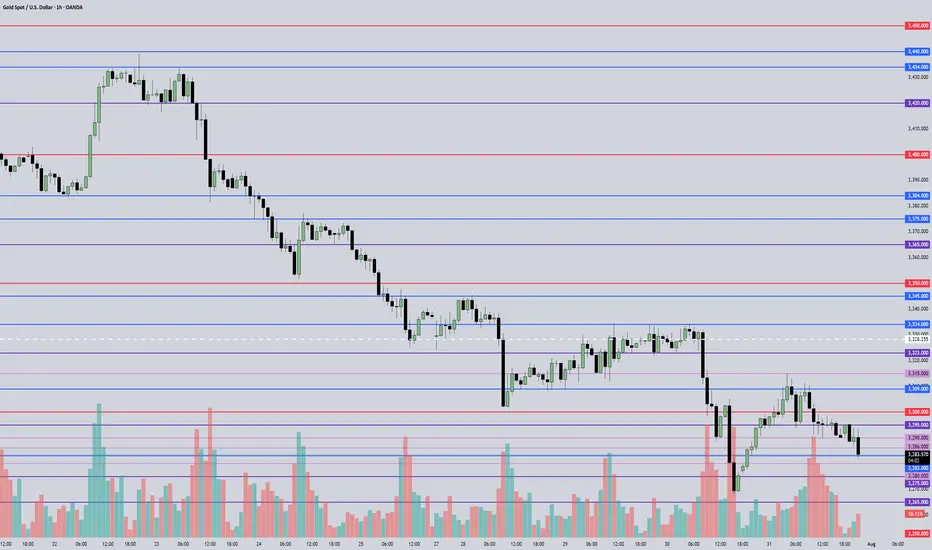
August 1, 2025 - XAUUSD GOLD Analysis and Potential Opportunity🔍 Key Levels to Watch:
• 3323 – Resistance
• 3309 – Resistance
• 3300 – Psychological level
• 3295 – Resistance
• 3283 – Key support
• 3268 – Short-term support
• 3260 – Support
• 3245 – Major support
• 3233 – Support
📈 Intraday Strategy:
• SELL if price breaks below 3283 → target 3280, then 3275, 3268, 3260
• BUY if price holds above 3286 → target 3289, then 3295, 3300, 3305
👉 If you find this helpful or traded using this plan, a like would mean a lot and keep me motivated. Thanks for the support!
Disclaimer: This is my personal view, not financial advice. Always use proper risk control.
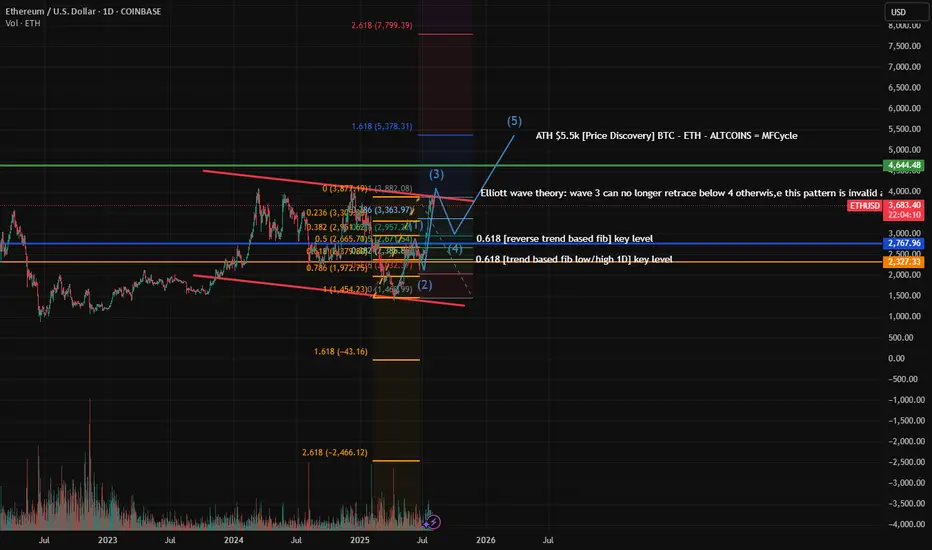
ETH in a 1-5 patternEverythings is labeled on the chart of my theory and where I predict if this theory is valid following BTC's ATH and the Money Flow Cycle.
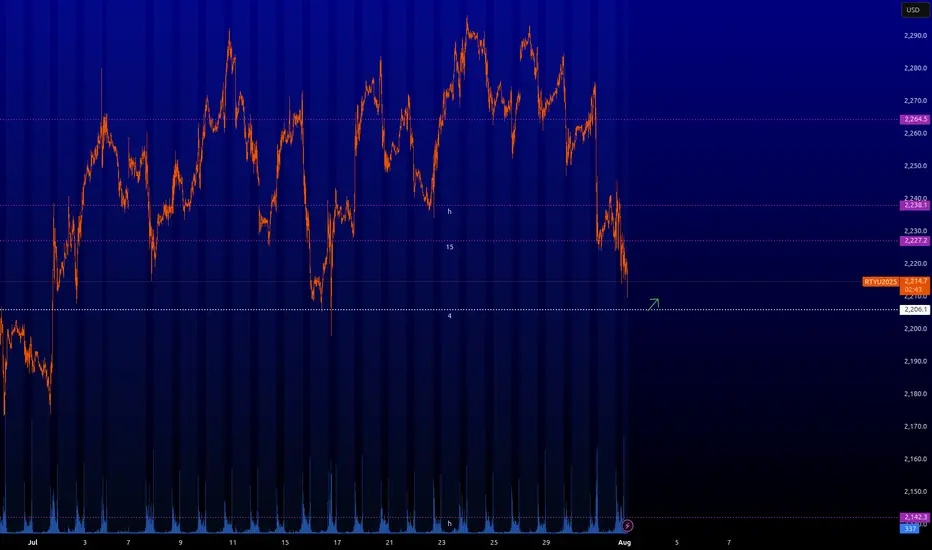
RTY : Key levelsHere are the key levels that the market will be interested in. From ~2.206 you can take scalping longs. Also interesting longing levels are forming now. I will let you know when they are formed and when they will be in play.
⚠️ VOLATILITY WARNING ⚠️
Trading around major news can be extremely unpredictable. Trade responsibly!

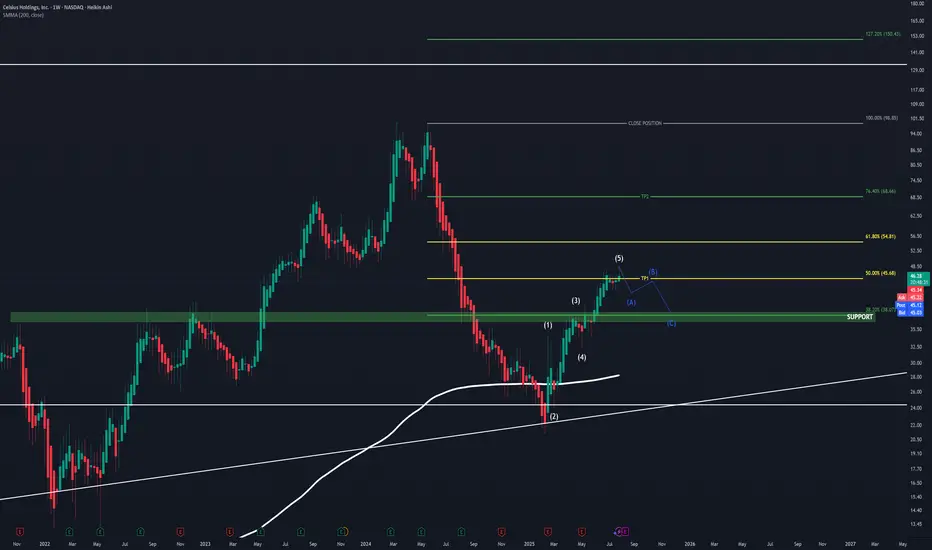
CELH UpdateAs mentioned in my old CELH post, I'm still holding.
On my new projections, assuming CELH is done for now due to it now testing the golden ratio 50.00% - 61.80% , a famous POI which more often than not results in a change in trend, and basing off of CELH's history, this area is respected.
So with this knowledge I have trimmed here, and I soon expect an ABC correction moving down to my level of support sitting at $38 , the 38.20% also sits here, which has also been proven to be a strong support level. If we find this level being tested, I will add back to my position and hold firm up toward $68.

WHO WILL WIN BITCOIN'S RANGE BATTLE? In this weeks analysis, Bitcoin has been stack in a tight range for almost two weeks now. Trading range between $115k and $120k. Trend is still holding up for Bullish continuation but indicators strongly cautions loud Sirens. A decisive daily close above $120,200 could be the winning whistle for Bullish Continuation, while I see selling pressure to continue to the Support Block of about 113k. Also the selling Volumes are huge but prices are always quickly absorbed suggesting an accumulation is happening more than a distribution. So my thesis for Bitcoin is sideways range bound until there is a clear market winner. I will be paying much attention to the bearish alarm and a breakdown will be confirmed when daily price decisively close below $115k confirming the divergences on the chart. Trading between the range is high risk.

SPX500 NEARING AN IMPORTANT FIB. EXTENSION RESISTANCEIn this weekend's analysis I find the SPX500 to remain BULLISH for next few days as we have strong closings outside the upper KC band and also touching the upper Bollinger band on the higher time frames from Daily to Monthly charts. It's also important to note that declining volume bars is NOT supporting the monthly rally, while MACD, RSI divergences are also sounding warning sirens that it's near a major correction territory which I have measure as the fib extension 0.618 from the October, 2022 base or support on the monthly chart. As signaled last week that we could be getting a capitulation candle soon to the fib target. Once we get a reversal candle on the 4 Hours it will confirm that the intermediate tops is achieved on the SPX500 and a correction is highly probable. So our trade thesis is Bullish until we get a confirmed bearish signal on either the 4H or 1D timeframe with Stop loss at 6377 level. Thanks for visiting my publication and trade idea on the SPX500. Cheers and happy trading to everyone.

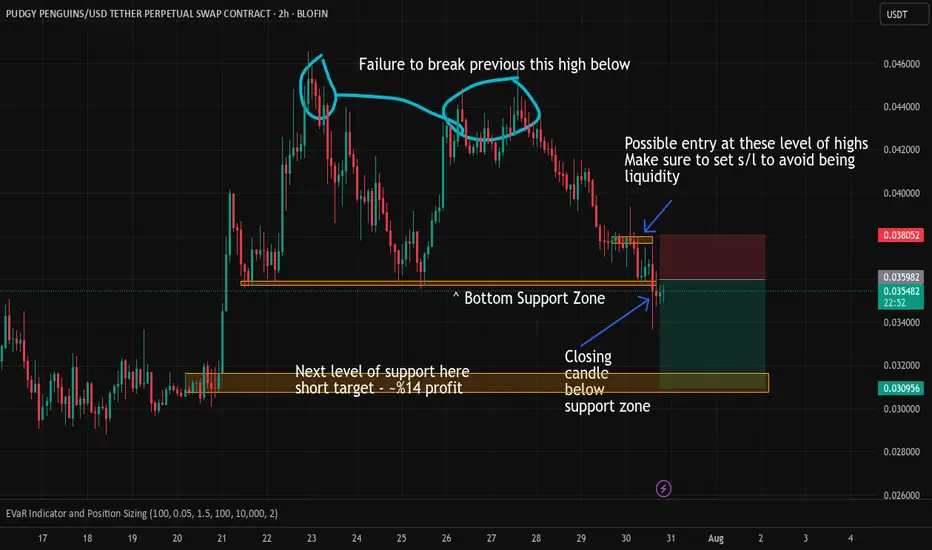
Put your coats back on penguins. It's about to get chilly!Pudgy has been on a fishy bull run for the last 3 months racking up 230 percent. It's time to chill out a bit while traders take some profit. Here is a great setup for a 14 percent short entry.
Price action is currently sitting slightly below support levels of .036. There are currently (2) 4 hour candles closed below the support zone indicating price action will likely slide into the lower support zone as marked on the chart. Price may break above the .036 resistance level into the small support zone of around ~.038. Make sure to set your stop loss slightly above this time so you are not in the liquidity zone if the bulls push back.
fart/usdt buy side trade dyorthis is formation of wave structure and handle cup formation
but DYOR im not a financial advisor

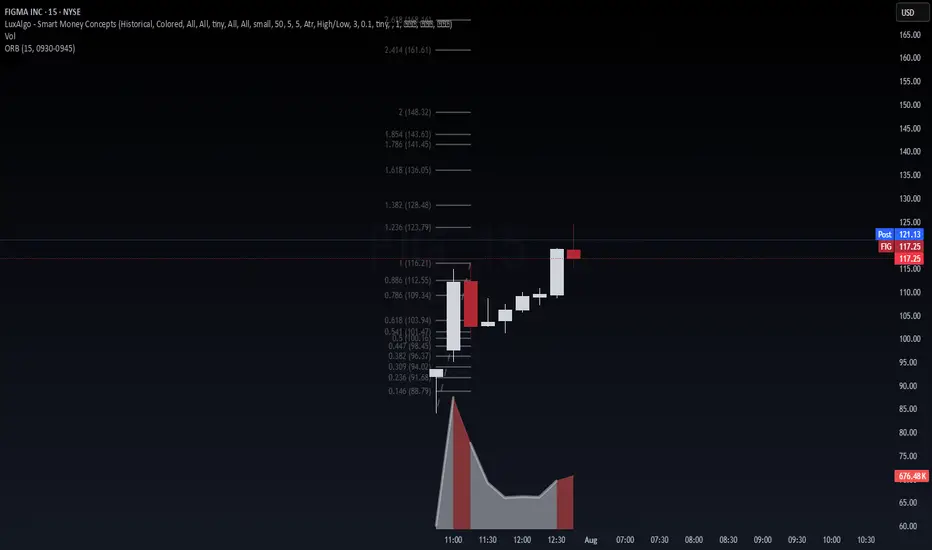
FIGMA INC. (FIG) – IPO Day Momentum + AI Design Wave📈 FIGMA INC. (FIG) – IPO Day Momentum + AI Design Wave
Figma just launched its IPO at $33/share, raising over $1.2B with intense demand (reportedly 40× oversubscribed). The stock opened explosively around $85 and surged past $115 within hours—marking one of the strongest SaaS IPOs in recent memory.
This debut is powered by:
The failed $20B Adobe acquisition (2023), which boosted Figma’s independence and cash position via a ~$1B break-up fee.
Accelerated AI integration: new tools like Figma Make, Draw, and Buzz debuted at Config 2025, reinforcing its leadership in collaborative design.
A rebound in tech valuations and strong market timing for IPOs, with Figma now positioned as a bellwether for high-growth SaaS.
🔍 Technical View (15-min chart):
After the opening range breakout (0930–0945), price cleanly moved through the 0.618 and 1.00 Fibonacci levels. FIG is now hovering near 1.236 ($123.79) with next key extension at 1.382 ($128.48). Volume confirms sustained interest. A hold above $116 signals strength. Watch for:
Breakout continuation above $123.79 → $128.50
Retest of VWAP/Fib levels ($112–$109) for re-entry
Lock-up risk, but low near-term float = volatile upside
🎯 Thesis: This is institutional-grade price action backed by AI momentum, macro timing, and a clean technical base. Trade the trend, not the headline.
#FIG #IPO #AI #SaaS #Breakout #Fibonacci #VolanX #WaverVanir #TradingStrategy #MacroSignals
Will gold bottom out and rebound on July 31st?
1. Key News Drivers
Federal Reserve Policy Expectations: The market generally expects the Fed to maintain a hawkish stance. If economic data (such as ADP, GDP, and PCE) show strong performance, the expected rate cut may be further postponed, which is bearish for gold.
Geopolitics and Risk Aversion: Uncertainty in the US-China trade negotiations and the situation in the Middle East may temporarily support gold prices, but the market is currently more focused on macroeconomic data.
Dollar Trend: If the US dollar index continues to strengthen (driven by expectations of a Fed rate hike), it will suppress gold's rebound potential.
2. Key Technical Signals
Trend Break Confirmation:
The daily chart shows four consecutive declines below the 60-day moving average and the rising trend line, confirming a mid-term correction following the 3439 high.
The next key support is 3245 (previous low). If it falls below this, the price could drop to 3150-3120.
Short-term oversold rebound demand:
The RSI entered the oversold zone, and a technical rebound may occur.
Key rebound resistance level:
3315-3325 (near yesterday's high, short-term short position entry area)
3345-3350 (bull-bear watershed, strong resistance area)
3380-3400 (trend reversal confirmation point, ideal layout position for medium-term short positions)
3. Today's operation strategy
(1) Short-term trading (intraday)
Mainly high-short:
Rebound to 3315-3325, light position short test, stop loss 3335, target 3280-3270.
If it touches 3345-3350, you can add short positions, stop loss 3360, target 3300-3280.
Dip-buying strategy (caution):
If the price stabilizes after a pullback to 3280-3270, short-term buying is recommended, with a stop-loss at 3260 and a target of 3300-3310 (quick entry and exit).
4. Key Risks
Federal Reserve Policy Shift: If the Fed unexpectedly releases dovish signals (such as hinting at a rate cut), it could trigger a rapid rebound in gold prices.
Unfortunate Economic Data: If US GDP, PCE, and other data fall short of expectations, it could boost gold prices in the short term, but after the rebound, it will still be an opportunity to buy higher.
Escalating Geopolitical Conflict: If a major risk event occurs (such as a escalation in the Sino-US trade war), it could temporarily boost safe-haven buying.
Summary
Short-Term: Oversold rebounds may provide opportunities to sell high, with attention to resistance at 3315-3325 and 3345-3350.
Medium-Term: The trend remains bearish, with a target of 3245 to 3150. Any upward movement is considered an opportunity to enter a short position. Trading strategy: Mainly short on rebound, be cautious when buying long orders on rebound, and strictly set stop-loss to prevent unexpected fluctuations.

MAMO Buying Opportunity🤑 CRYPTO:MAMOUSD did 3 waves pullback into extreme area $0.099 - $0.077 and as long as it holds the trendline from May low then Bulls will be looking for more upside to take place from here!

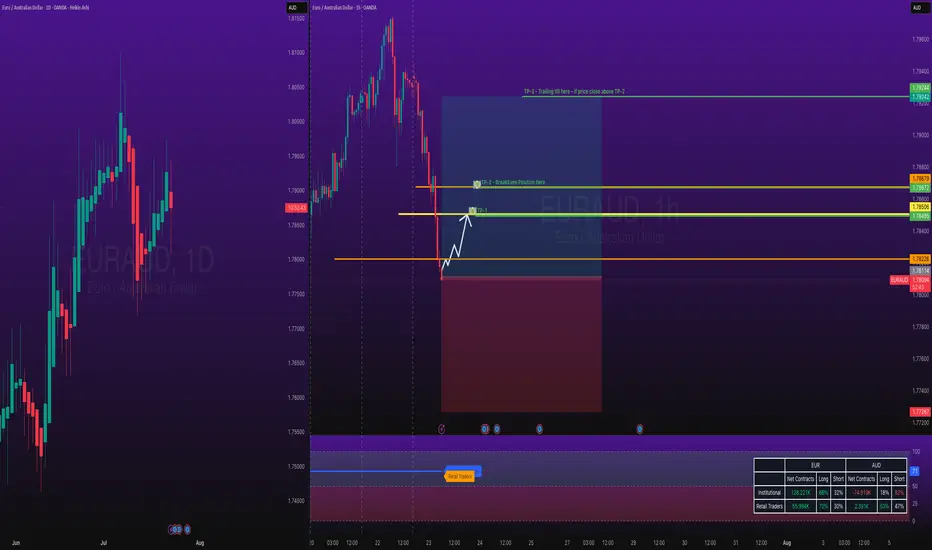
EURAUD Long TradeOANDA:EURAUD Long trade, with my back testing of this strategy, it hits multiple possible take profits, manage your position accordingly.
TP-1 is high probability.
This is good trade, don't overload your risk like greedy, be disciplined trader, this is good trade.
Use proper risk management
Looks like good trade.
Lets monitor.
Use proper risk management.
Disclaimer: only idea, not advice
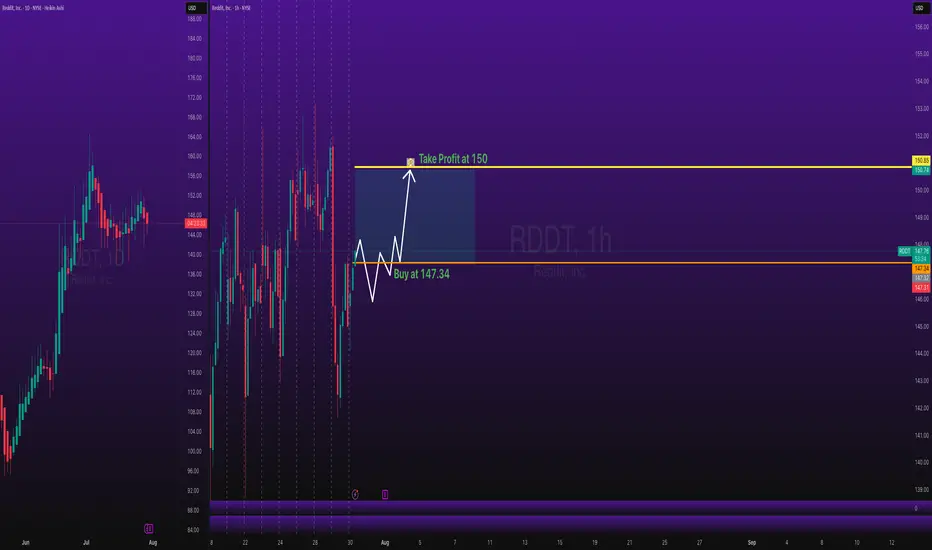
Stocks SPOT ACCOUNT: Reddit stocks BUT ENTRY with TAKE PROFITStocks SPOT ACCOUNT: NYSE:RDDT stocks my buy trade with take profit.
This is my SPOT Accounts for Stocks Portfolio.
Trade shows my Buying and Take Profit Level.
Spot account doesn't need SL because its stocks buying account.
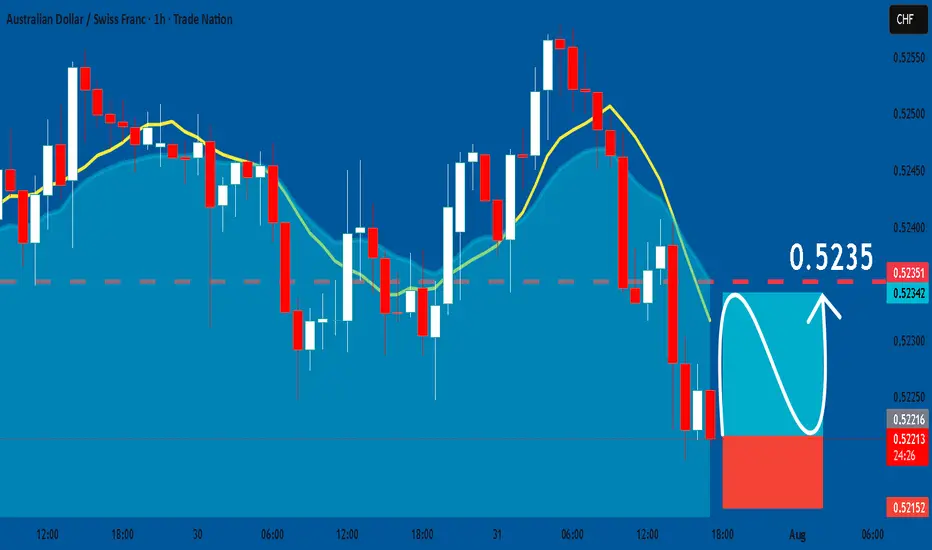
AUDCHF: Bullish Continuation & Long Signal
AUDCHF
- Classic bullish formation
- Our team expects pullback
SUGGESTED TRADE:
Swing Trade
Long AUDCHF
Entry - 0.5221
Sl - 0.5215
Tp - 0.5235
Our Risk - 1%
Start protection of your profits from lower levels
Disclosure: I am part of Trade Nation's Influencer program and receive a monthly fee for using their TradingView charts in my analysis.
❤️ Please, support our work with like & comment! ❤️
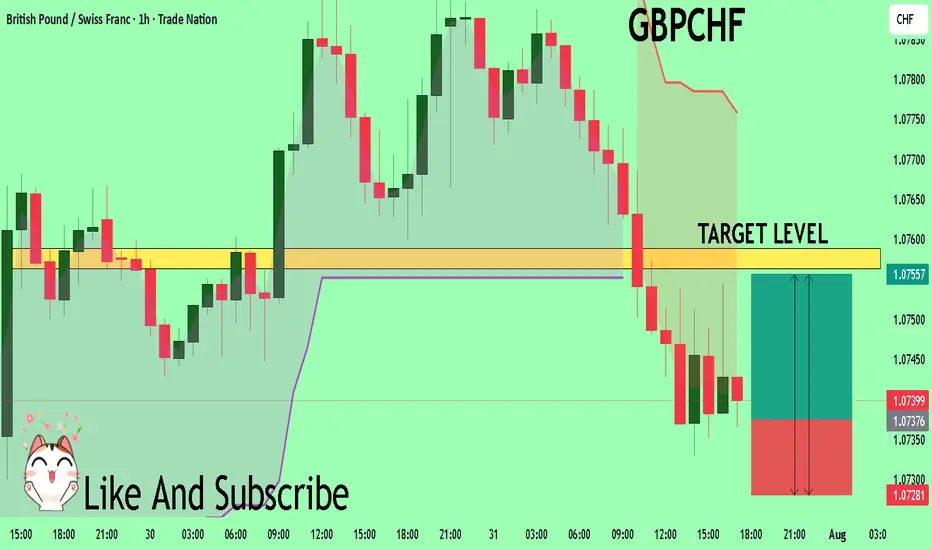
GBPCHF Trading Opportunity! BUY!
My dear followers,
This is my opinion on the GBPCHF next move:
The asset is approaching an important pivot point 1.0737
Bias - Bullish
Safe Stop Loss - 1.0728
Technical Indicators: Supper Trend generates a clear long signal while Pivot Point HL is currently determining the overall Bullish trend of the market.
Goal - 1.0756
About Used Indicators:
For more efficient signals, super-trend is used in combination with other indicators like Pivot Points.
Disclosure: I am part of Trade Nation's Influencer program and receive a monthly fee for using their TradingView charts in my analysis.
———————————
WISH YOU ALL LUCK