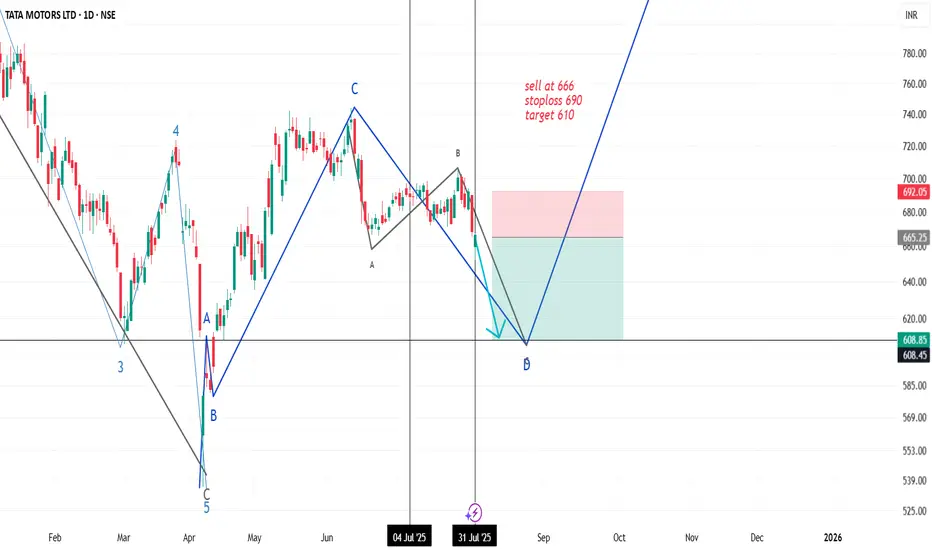
tata motors will fall till 610 levelsTata motors according to wave analysis will now fall and find support close to 610 levels.
sell price 660 to 670 range
taregt 610
sl 690
Wave Analysis
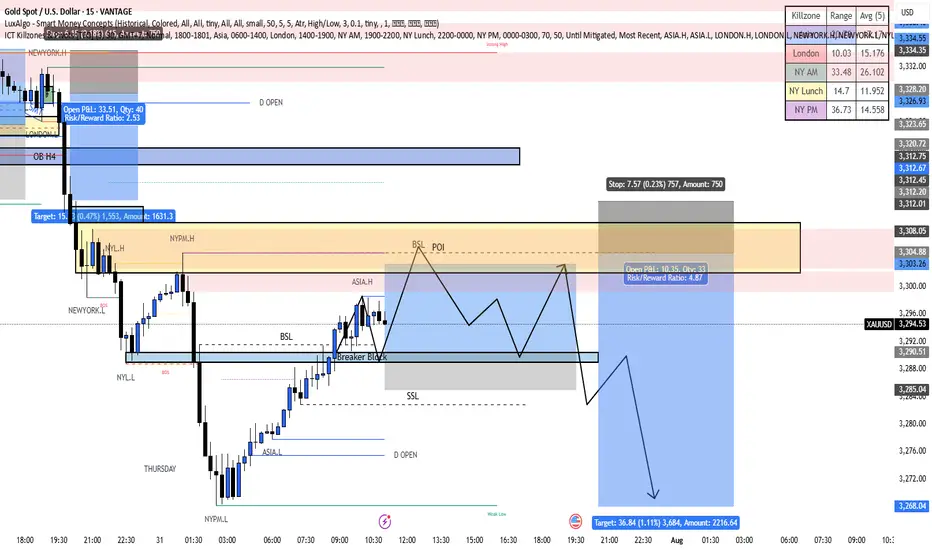
XAUUSD Thursday Chart Market Structure & Context
Timeframe: 15-Minute (M15)
Overall Trend: Bearish after a confirmed Break of Structure (BOS) to the downside
Current Price Action: In a retracement phase toward a premium supply zone
Bias: Expecting a liquidity sweep upward, followed by a strong sell-off
🧱 Key Structure Zones
NYL.H & NYL.L: High and Low of the previous New York session
ASIA.H & ASIA.L: High and Low of the Asia session
NYPM.H & NYPM.L: High and Low of the New York PM session
🔍 Critical Levels & POIs
Breaker Block (Dark Gray Box)
Formed after price swept buy-side liquidity and then broke structure upward
Expected to act as a support zone for a temporary buy or a reaction point
BSL POI (Buy-Side Liquidity - Point of Interest)
A manipulated breakout area targeted by smart money
Expected to entice FOMO buyers before a sharp reversal downward
Sell-Side Liquidity (SSL)
Located below the current breaker block
This is the final liquidity target for a continuation sell move
📈 Expected Price Behavior
Price is currently retracing upward
Projected Scenario:
Price moves up to tap into the BSL POI zone (around 3,303–3,305)
Price rejects the POI, forming a potential distribution range
Breakdown from the range initiates a sell-off
Targeting final support / liquidity sweep around 3,268.04
🎯 Trade Setup & Plan
Bias: Sell after a liquidity sweep above key highs
Entry Trigger: Upon clear rejection from the BSL POI zone
Stop Loss: Above BSL POI (~3,307–3,309)
Take Profit: 3,268.04, yielding a Risk-to-Reward Ratio ~4.67
⏰ Killzone Timing (SMC Timing Model)
NY AM Killzone (14:00–19:00 GMT+7)
→ Ideal for entries; likely where liquidity manipulation occurs
NY Lunch & PM
→ Potential for distribution phase completion and sell-off
📌 Additional Notes
Price action reveals a clean FVG (Fair Value Gap) and a completed BSL sweep
Final downside target aims for the NYPM Low, identified as a weak low
Rejection from the breaker block is crucial; confirmation via BOS/CHoCH on lower TF is preferred
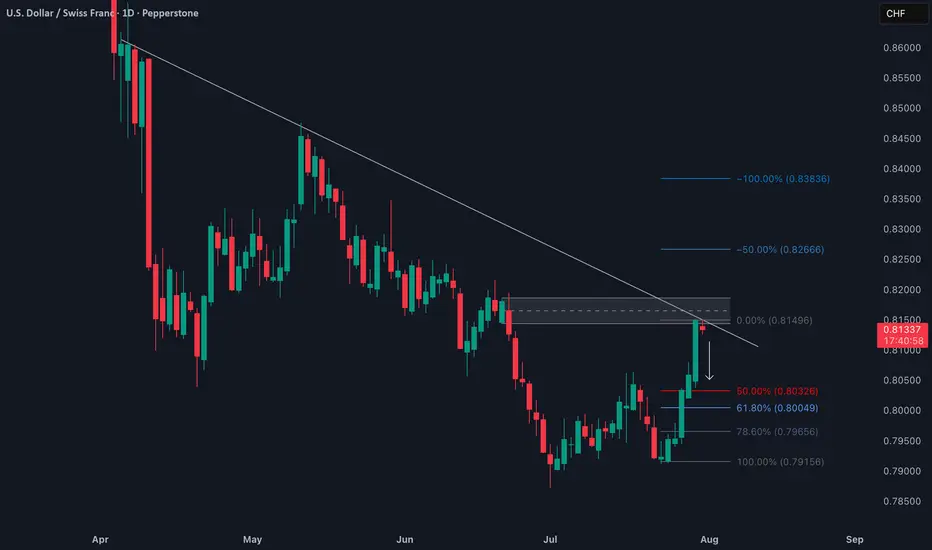
Liquidity Grab Complete? Why USDCHF Could Be Heading South📉 USDCHF remains firmly in a downtrend on both the weekly (1W) and daily (1D) timeframes. The recent bullish retracement is now confronting a critical resistance zone 🔒 — defined by a descending trendline and a daily order block between 0.8150–0.8200.
🧱 Price action at this level shows clear signs of rejection, aligning with a bear flag formation, which could pave the way for continued downside toward the 0.7800–0.7600 region.
📊 Fundamentally, the Swiss Franc (CHF) continues to gain strength, supported by Switzerland’s stable economic outlook and ongoing safe-haven demand. Meanwhile, the US Dollar faces headwinds from dovish Fed expectations and rising political uncertainty in the US 🇺🇸.
🔮 From a Wyckoff/ICT perspective, this upward move appears to be a liquidity grab into a premium zone, with smart money likely distributing positions before initiating a new markdown phase. A sell bias is favored below 0.8200, with downside targets set at 0.8000 and beyond.
📅 Keep a close eye on this week’s US NFP and Swiss CPI releases — both could inject fresh volatility into the pair.
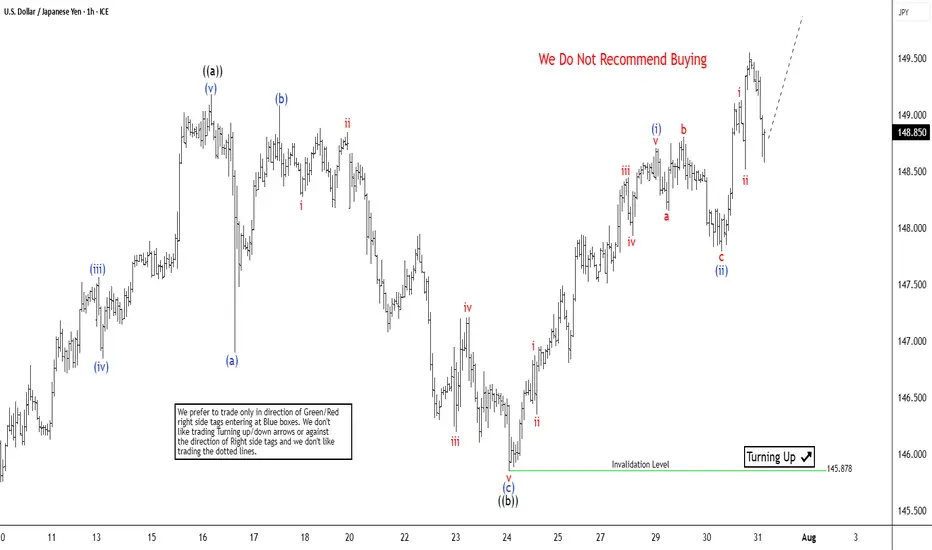
USDJPY Targets Completion of 7 Swing RallyThe USDJPY pair exhibits an incomplete bullish sequence originating from the April 22, 2025 low, signaling potential for further upside. We can project the extreme target area for this rally can be projected using using the 100% to 161.8% Fibonacci extension from the April 22 low. This places the target range between 150.88 and 156.33. The ongoing rally from the May 27, 2025 low is unfolding as a double three Elliott Wave structure. This structure has two zigzag corrective structure driving the upward momentum.
From the May 27 low, wave W concluded at 148.03. A corrective pullback in wave X then followed, which bottomed at 142.67. Currently, wave Y is in progress, with internal subdivision as a zigzag pattern. From the wave X low, wave ((a)) peaked at 149.18, followed by a corrective wave ((b)) that unfolded as a zigzag. Within this structure, wave (a) ended at 147.81 and wave (b) reached 149.08. Wave (c) completed at 145.87, finalizing wave ((b)) in the higher degree. The pair has since resumed its ascent in wave ((c)), developing as a five-wave impulse.
From wave ((b)), wave (i) concluded at 148.71, with a minor pullback in wave (ii) at 147.79. In the near term, as long as the pivot low at 145.87 holds, dips are expected to attract buyers in a 3, 7, or 11-swing corrective pattern, supporting further upside toward the Fibonacci extension targets.
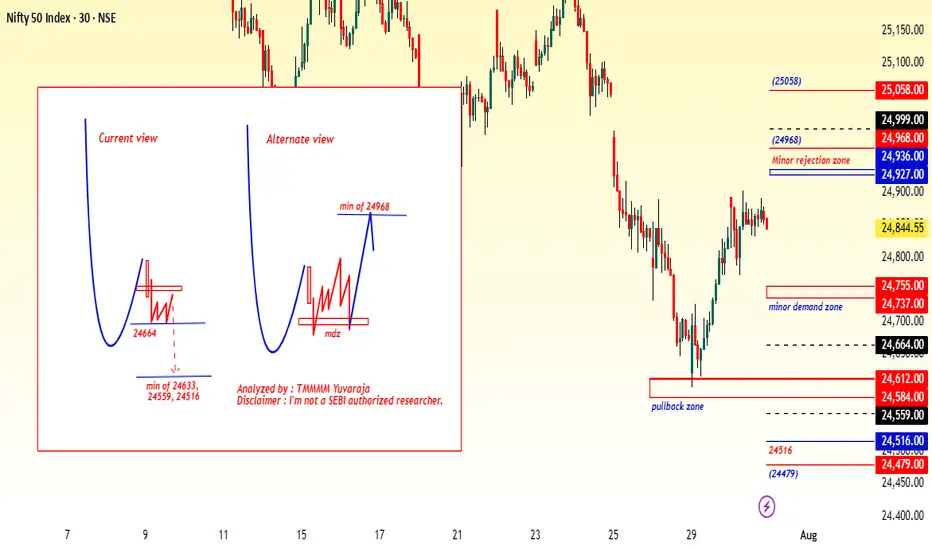
#Nifty directions and levels for July 31st:Good morning, friends! 🌞
Here are the market directions and levels for July 31st:
In the past two sessions, the global market (based on Dow Jones) has shown a moderately bearish sentiment,
while the local market continues to reflect a bearish tone.
Today, Gift Nifty indicates a gap-down opening of around 160 points (as per the chart).
What can we expect today?
In the previous session, both Nifty and Bank Nifty went through consolidation.
Structurally, we are still in a bearish tone, and with Gift Nifty indicating a gap-down start,
if the market breaks the immediate support levels with a solid candle, we can expect further correction.
On the other hand, if it finds support there, then the range-bound movement is likely to continue.
Which means, if the initial market takes a pullback, we can expect consolidation within the previous day’s range.
#Banknifty directions and levels for July 31st:
What can we expect today?
In the previous session, both Nifty and Bank Nifty went through consolidation.
Structurally, we are still in a bearish tone, and with Gift Nifty indicating a gap-down start,
if the market breaks the immediate support levels with a solid candle, we can expect further correction.
On the other hand, if it finds support there, then the range-bound movement is likely to continue.
Which means, if the initial market takes a pullback, we can expect consolidation within the previous day’s range.

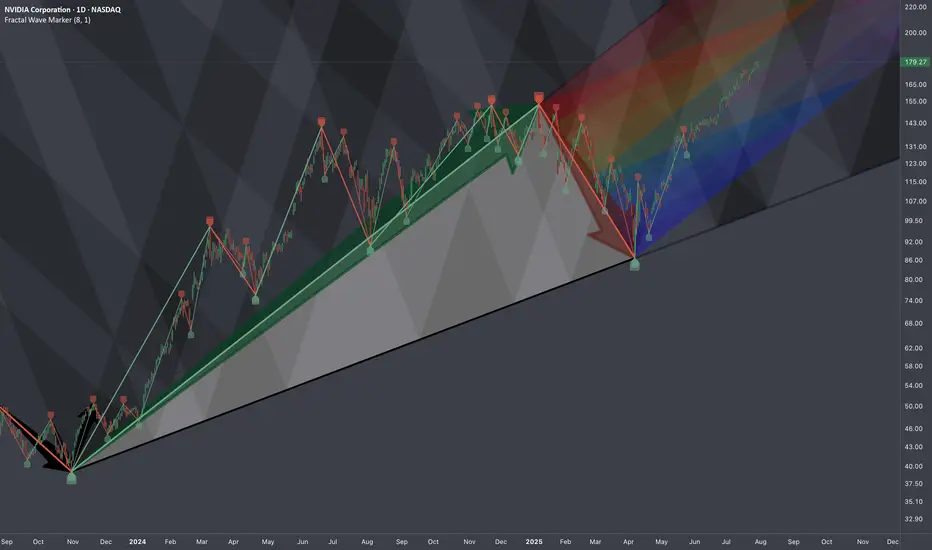
$NVDA: Cycle-Wired Levels🏛️ Research Notes
The fact that the angle of linear connection between 3rd degree points (fractal hierarchy) acted multiple amout of times as support and eventually resistance from which tariff drop happened establishing bottom and expanding from there.
That means if we were to justify the texture of ongoing wave from that bottom, we would geometrically quantify the area of that triangle to project considering historic data to remain objective approach (and NOT what levels we subjectively want to see whether we are bullish or bearish). There is mean reversion rule also going on which will be structurally addressed.
No matter where your actual target is at, there are always structural boundaries that price must break through first in order to get there. And because markets tend to move in proportion to their own scale — often aligning with exponents of the golden ratio, we treat phi as a constant within this probabilistic space.
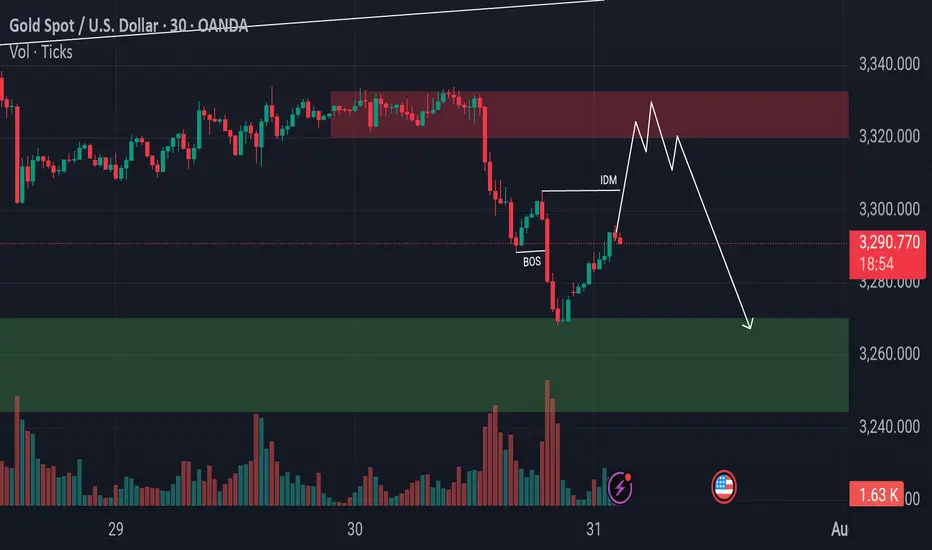
Gold Bulls Charging to 3305 But What’s Waiting There?Gold has recently taken support from the lower levels and has also shown a Break of Structure (BoS) to the downside. Currently, there is Imbalance and Internal Draw on Liquidity (IDM) resting around the 3305 level. The market appears to be moving upward to mitigate that imbalance. It's important to closely monitor this zone, as once the market reaches and fills this area, there is a high probability of a potential rejection or bearish move from that level
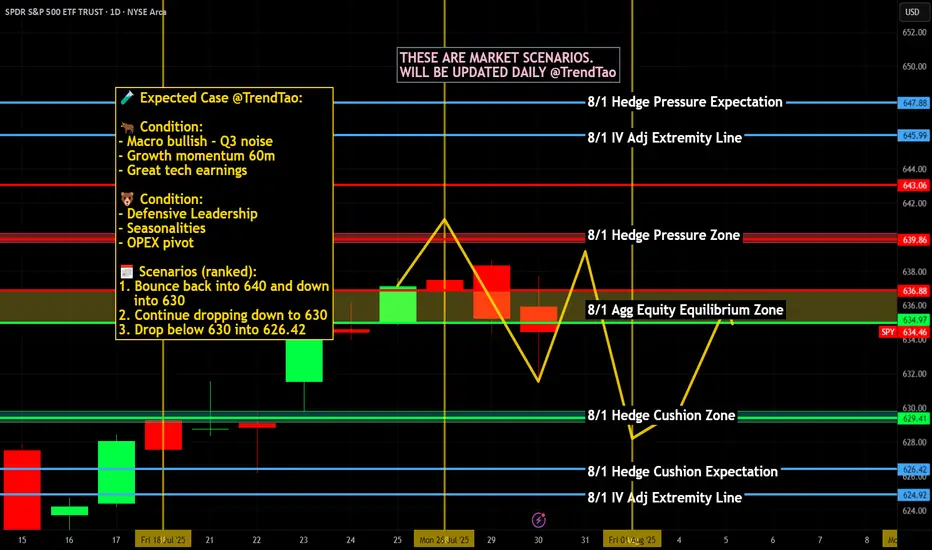
Nightly $SPY / $SPX Scenarios for July 31, 2025🔮 Nightly AMEX:SPY / SP:SPX Scenarios for July 31, 2025 🔮
🌍 Market-Moving News 🌍
🏦 Fed Holds Rates — Dissent Indicates Division
The Federal Reserve maintained its benchmark rate at 4.25%–4.50%. Notably, two governors—Christopher Waller and Michelle Bowman—dissented in favor of a 25 bp rate cut, underscoring internal divisions amid growing political pressure
📈 Strong Q2 Growth, But No Rate-Cut Signal
U.S. GDP expanded at a 3.0% annualized rate in Q2, rebounding sharply from Q1's contraction. Despite this, Powell emphasized persistent inflation, particularly from tariffs, reinforcing the Fed’s cautious policy stance
🛢️ Oil Climbs as Tariff Tensions Rise
Brent crude rose to ~$73.51 and WTI to ~$70.37 on fears of supply disruptions tied to President Trump’s threats of new tariffs on Russian oil and new tariffs imposed on Brazil and South Korea
📊 Key Data Releases & Events 📊
📅 Thursday, July 31:
8:30 AM ET – Initial Jobless Claims (week ending July 26)
Initial claims rose to 222,000, up from 217,000 previously—an early gauge of labor-market trends
8:30 AM ET – Employment Cost Index (Q2)
Quarterly growth in labor costs edged lower to 0.8%, down from 0.9%—a signal of moderate wage pressures
8:30 AM ET – Personal Income (June)
Data released on household income and spending patterns—crucial for assessing consumer resilience heading into Q3
⚠️ Disclaimer:
This information is for educational and informational purposes only and should not be construed as financial advice. Always consult a licensed financial advisor before making investment decisions.
📌 #trading #stockmarket #economy #Fed #inflation #jobs #technicalanalysis
Technical Analysis - Gold (XAU/USD) - 4H ChartI’ve dissected the market using Elliott Wave theory and uncovered key signals that most overlook. Here's my breakdown:
## 📌 **Setup Overview*
I'm tracking a complex wave structure that hints at the final stage of a corrective pattern, setting the stage for a potential bullish rebound.
## 🎯 **Entry Strategy**
I’ve identified a prime buy zone around **3,350USD**—just above current market levels. This isn’t just a number—it's where price action and wave theory converge. High-probability setup with a tight stop. Above 3,380
## 🧭 **Projected Move**
While I’m eyeing short-term upside, the larger wave pattern suggests the potential for a deeper correction targeting the **3120.000 USD** area. I’m preparing for both scenarios to stay ahead of market sentiment.
---

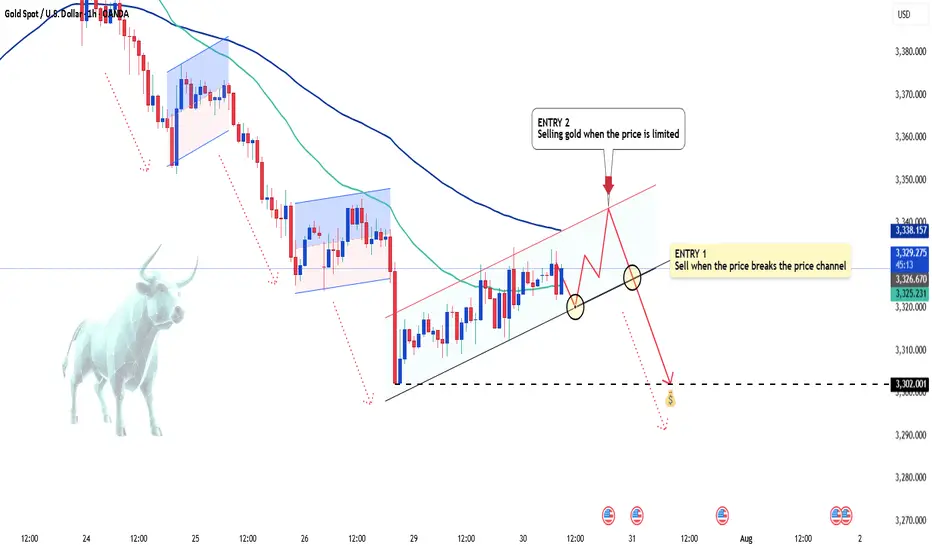
Gold's Strong Moves: Will the Bears Take Over?Hello everyone, Kevinn here!
Today, gold continues to experience significant fluctuations in the new week, with XAU/USD currently hovering around 3,325 USD. Amid the strong rise of the USD, the gold market has seen a sharp adjustment. However, the medium-term trend still seems to favor the bears.
The main reason for the turbulence in gold prices is the strengthening of the U.S. dollar, following strong economic news from the U.S. that points to a clear recovery. The stronger USD has made gold more expensive for international investors. Additionally, the market is awaiting further moves from the Fed regarding interest rate policies, which is limiting the flow of capital into gold.
Looking at the technical chart, we can see that although gold has shown a slight uptick, bearish pressures are still lurking. Indicators and patterns suggest that gold may break its rising price channel, with a high likelihood of further declines. The next support level could be around 3,310 USD, and if broken, gold may continue to fall toward 3,300 USD or lower.
Based on the signals from the chart, ENTRY 1 strategy would be to sell when the price breaks the upward channel. Additionally, if the price pulls back to the upper limit zone, ENTRY 2 could present another potential selling point.
For today's strategy, I expect gold to decrease. What do you think? Share your thoughts in the comments!
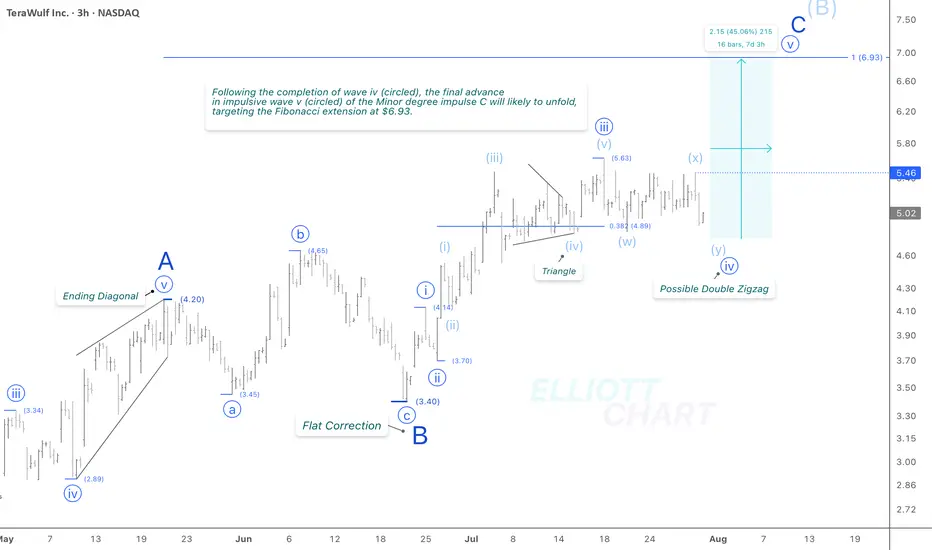
WULF / 3hThe unexpected 4% decline today suggests a potential shift in the wave iv (circled) corrective structure—from the previously identified triangle pattern to a more complex (w)-(x)-(y) combination. While differing corrective variations remain possible, this alternate structure now appears to be nearing completion. It is likely to precede the anticipated advance of approximately 45% in wave v (circled) of the ongoing Minor degree wave C.
The Fibonacci extension target at 6.93 remains unchanged.
Trend Analysis >> Upon completion of Minor wave C, the countertrend advance of Intermediate wave (B)—in progress since April 9—is expected to give way to a decline in wave (C) of the same degree. This next downtrend may begin in the coming days and has the potential to extend through the end of the year.
NASDAQ:WULF CRYPTOCAP:BTC BITSTAMP:BTCUSD MARKETSCOM:BITCOIN
#CryptoStocks #WULF #BTCMining #Bitcoin #BTC
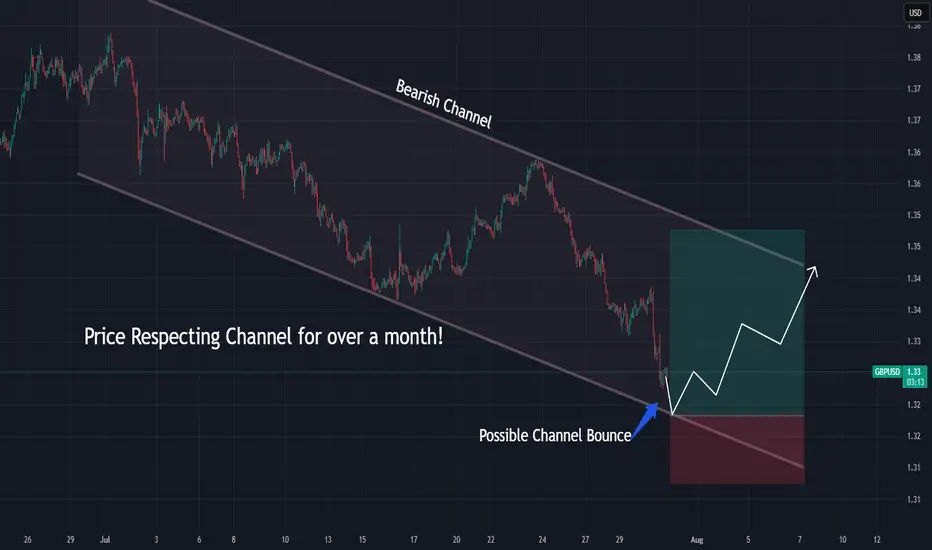
GBPUSD Approaching Channel Support — Rebound Ahead?GBPUSD is nearing the bottom of a well-defined bearish channel while Stoch RSI begins to curl upward.
📌 Bearish channel structure intact
📌 Possible bounce off ~$1.322 zone
⏱️ Timeframe: 1H
#gbpusd #forex #tradingstrategy #channeltrading #technicalanalysis #quanttradingpro #tradingview
Gold Bounces From Support — Reversal Starting?Gold just wicked into support and is showing early signs of a reversal.
📌 Stoch RSI curling up from oversold
📌 Price bounced clean from the demand zone
⏱️ Timeframe: 1H
#gold #xauusd #tradingstrategy #quanttradingpro #stochrsi #tradingview #supportresistance

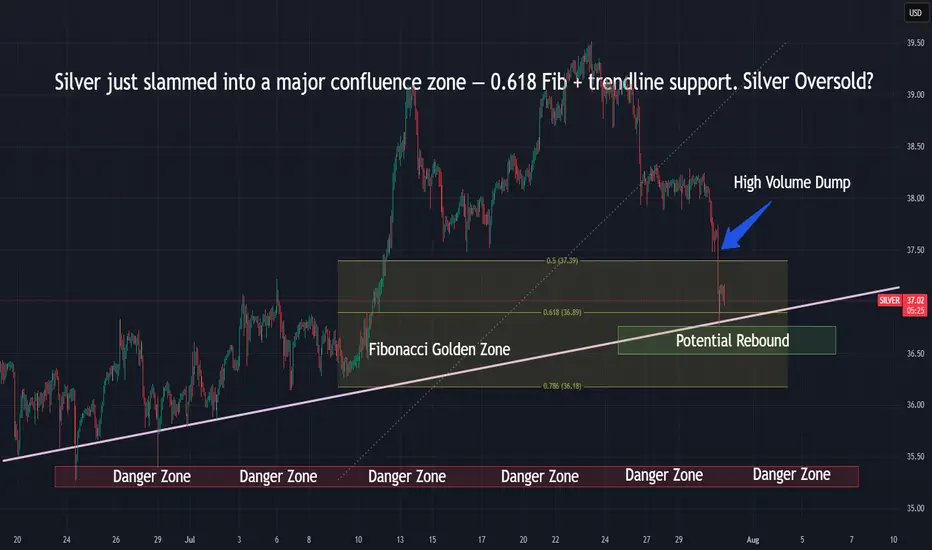
Silver Hits Fibonacci Support — Rebound or Dump?Silver just slammed into the 0.618 Fib — a key reversal zone.
📌 Eyes on bounce or breakdown toward the danger zone below $36
⏱️ Timeframe: 1H
#silver #xagusd #fibonacci #commodities #tradingstrategy #tradingview #quanttradingpro
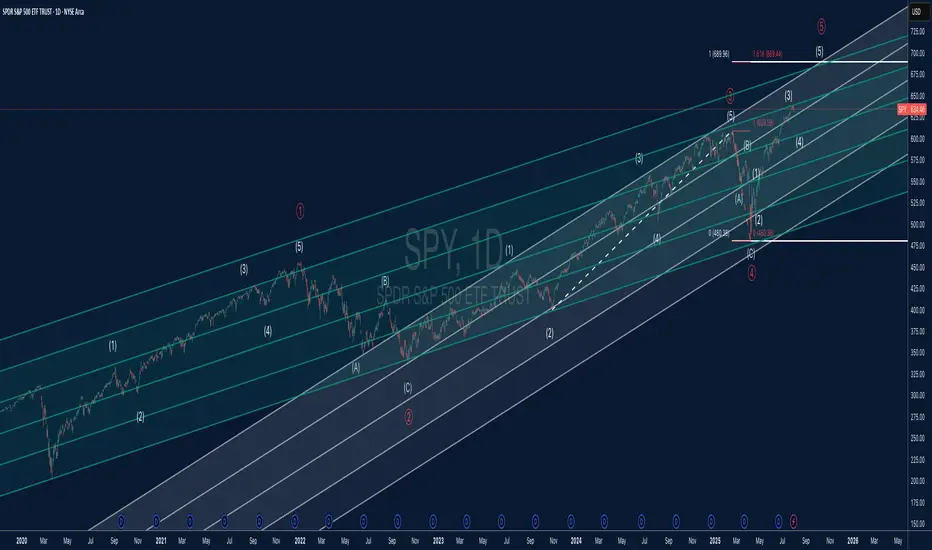
SPY Elliott Wave + Parallel Channel AnalysisThis chart offers a detailed Elliott Wave count for SPY (S&P 500 ETF) on the daily timeframe, combined with a structured parallel channel system to highlight key trend dynamics.
🔍 Elliott Wave Structure:
The price is currently advancing in what appears to be Wave (5) of Primary Wave ⑤, suggesting we may be in the late stages of a major impulsive cycle.
Each impulsive and corrective wave is clearly labeled, with the internal structure confirming classic Elliott Wave symmetry.
The 1.618 Fibonacci extension around $689 marks a critical upside target and potential completion zone for Wave (5).
Wave (4) held well at the lower channel boundary and completed near $480, establishing a solid base for the current advance.
📊 Channel Insights:
A system of parallel channels is applied to capture the overall trend and momentum structure.
Price is climbing toward the upper boundary of the long-term ascending channel, which has acted as dynamic resistance in previous waves.
The median lines have provided reliable support and resistance throughout the trend, making them important reference levels moving forward.
⚠️ Key Technical Levels:
Resistance: $689.44 (Wave ⑤ target at 1.618 Fib extension)
Support Zones: $609 (prior Wave (3) high), $575 (mid-channel support), and $480 (major cycle low)
A confirmed break above $690 could suggest a parabolic move, but risk of reversal grows as the upper channel is tested.
📈 Market Outlook:
SPY remains in a strong uptrend but is nearing a major confluence of wave and channel resistance.
A completed five-wave sequence would suggest the potential for a higher-degree correction, possibly leading into a Wave A/B/C scenario.
Short-term bullish bias remains valid while above $609, but watch for divergence or exhaustion signs near $689–$700.
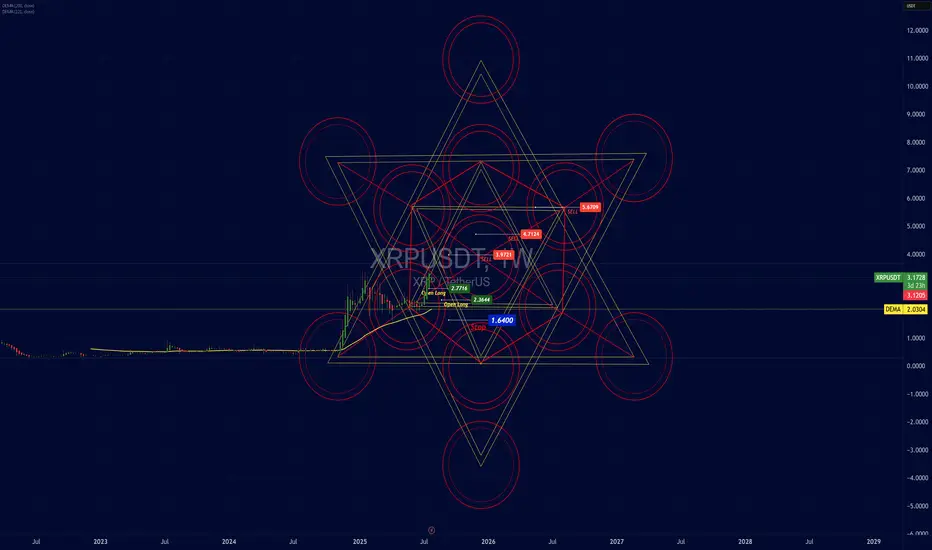
Analytical Geometry Strategy Applied to the Market — XRP/USDTAnalytical Geometry Strategy Applied to the Market — XRP/USDT
Position Trader: Action Based on the Structural Geometry of the Metatron's Cube
Operational Introduction
In medium to long-term strategic positioning (position trading), market entry must not be random or emotional — it must be grounded in predictable zones of symmetry and imbalance.
For that, we apply Analytical Geometry to chart structure, using the Metatron’s Cube — a three-dimensional geometric figure composed of 13 spheres and 78 interlinked vector lines.
The cube is a projection from a six-dimensional hyperplane onto the 2D Cartesian plane. Its application on the chart allows us to:
Delimit areas of vector confluence (support/resistance)
Identify angular energy zones and technical pressure points
Anticipate critical price inflection points based on mathematical symmetry
Structural Application on the XRP/USDT Chart
The projection of Metatron’s Cube onto the XRP/USDT chart reveals:
Entry points (Open Long) located at the lower inner vertices of the cube, where vectors converge toward the central axis — the liquidity attraction point
Supply zones (Sell) aligning with circular and angular intersections of the lines, where multiple vectors overlap — indicating movement saturation and possible redistribution
Stops placed below the angular base, representing a break in symmetry (the point where the vector loses cohesion with the model)
Structural Coordinates (Based on Vector Analysis)
Entry Points (Open Long):
Point A: (x = 2.6444, y = 0)
Point B: (x = 2.7176, y = 0)
Strategic Stop:
Point C: (x = 1.6400, y = -1), just below the lower angular base — a vector dispersion zone
Technical Targets (Supply Zones):
Level 1: x = 3.9721 (first circular layer)
Level 2: x = 4.7124 (72° expansion — common in golden ratio geometry)
Level 3: x = 5.6709 (structural exhaustion zone)
Technical Justification: Why Analytical Geometry Works
Analytical Geometry, developed by René Descartes, allows for the representation of curves, vectors, and spatial structures using numerical coordinates.
Metatron’s Cube functions as a vector mesh over the price chart — translating market behavior into a mathematical language of:
Proportions
Intersections
Angular projections
This approach enables us to:
Model price behavior as a multivariable function
Anticipate reaction zones based on angular and linear symmetry
Protect capital with stops anchored in vector-based rupture zones
Scientific Relevance
Metatron’s Cube is not merely symbolic — it remains actively used in modern physics and aerospace engineering.
At NASA, geometries derived from the Cube are applied to:
Orbital simulations
Spatial perimeter calculations on nonlinear geodesics
Angular mass distribution in interplanetary navigation systems
The same mathematical foundation used to understand celestial body dynamics is used here to identify repeatable behavior patterns in the market — with a high degree of precision.
Technical Conclusion
The market’s geometric structure is not random — it is vectorial, symmetrical, and proportional
Using Metatron’s Cube as a geometric projection allows for rational and coordinated alignment of entry, stop, and target points
The first target has already been validated, proving the structure’s effectiveness
The position remains active, with upper targets defined by vector intersections and angular saturation zones
Closing Insight
"The market’s geometry is the invisible code behind apparent movement. He who understands the vectors, masters the cycles."
This strategic model combines analytical geometry, energetic symmetry, and technical foundation in a unified framework — with precision, logic, and harmony.
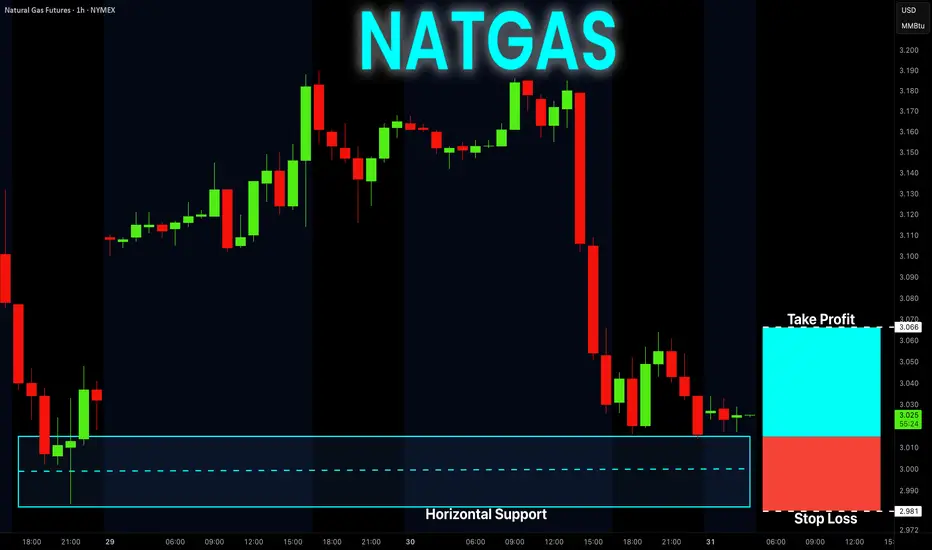
NATGAS Free Signal! Buy!
Hello,Traders!
NATGAS went down and
Almost reached the horizontal
Support of 3.014$ from where
We can enter a long trade
With the Take Profit of 3.066$
And the Stop Loss of 2.981$
Buy!
Comment and subscribe to help us grow!
Check out other forecasts below too!
Disclosure: I am part of Trade Nation's Influencer program and receive a monthly fee for using their TradingView charts in my analysis.
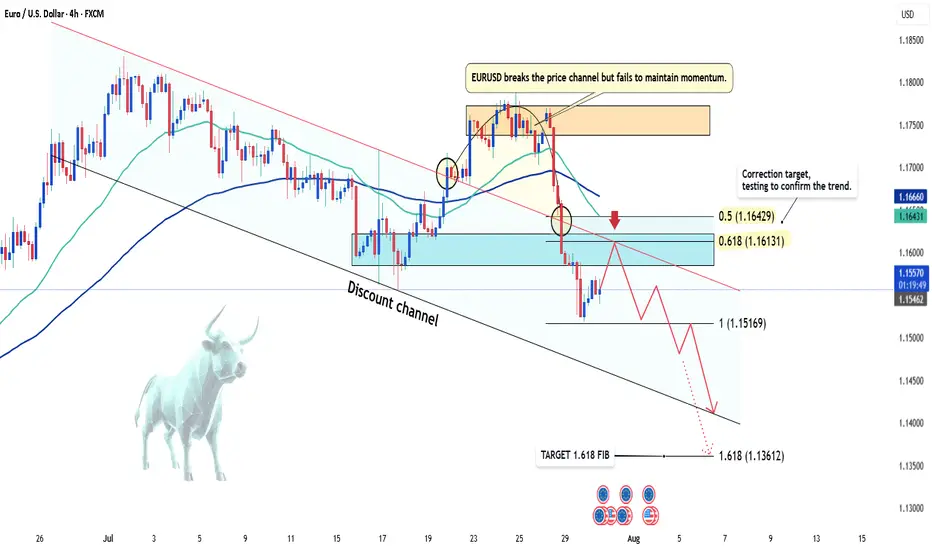
EUR/USD Latest Update TodayHello everyone, what do you think about FX:EURUSD ?
EUR/USD previously broke the downward price channel, but failed to maintain the momentum, leading to a strong correction phase. Currently, the price is trading around 1.156 and testing key Fibonacci levels, with the 0.5 - 0.618 levels marked as potential reversal zones, as highlighted in the analysis.
With the current market sentiment, the strong recovery of the USD has been the main factor driving the EUR/USD movement in recent days. Positive economic data from the US has strengthened the US dollar, decreasing the appeal of gold and safe-haven assets like the EUR. Furthermore, expectations surrounding Fed policy decisions continue to add pressure on EUR/USD, with investors bracing for the possibility of the Fed maintaining high interest rates for a longer period.
For traders, it's clear that the bearish trend is in favor, as indicated by the EMA reversal. The Fibonacci levels 0.5 (1.164) and 0.618 (1.161) will be crucial zones, where reaction signals could open opportunities for SELL positions. The next target will be at Fib 1 and Fib 1.618.
That's my perspective and share, but what do you think about the current trend of EUR/USD? Leave your comments below this post!
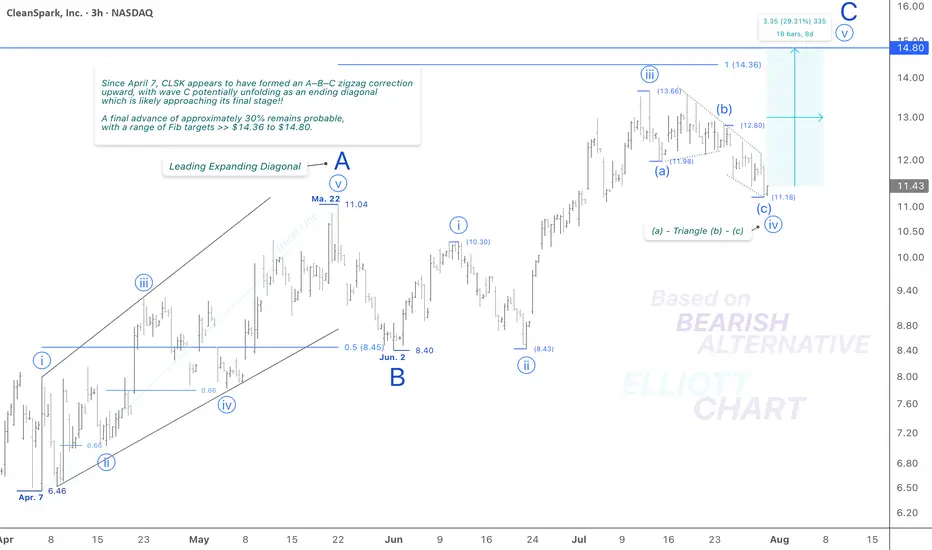
CLSK / 3hToday’s unexpected 2.6% decline, along with the continued development of an ending diagonal in the final leg of the correction, supports a reversion to the previously considered structure: an formation for wave iv (circled). This revised interpretation aligns more closely with the current price action and wave behavior.
I continue to view Minor wave C as an impulsive sequence as well, which now appears to be entering its final stage—an anticipated advance in wave v (circled), with a projected Fib target in the 14.36–14.80 range.
Wave Analysis >> While the current outlook on NASDAQ:CLSK remains consistent with previous analysis, the 3-h frame above shows that Minor wave C—completing the corrective advance of wave (B)—appears to be unfolding in an impulsive sequence, likely entering its final stages.
Within this structure, Minute wave iv (circled) has taken the form of an correction. A final push higher in Minute wave v (circled) is now anticipated, which would complete the ongoing wave C and, in turn, mark the conclusion of the countertrend advance in Intermediate degree wave (B).
Trend Analysis >> Upon completion of Minor wave C, a broader trend reversal to the downside is anticipated, marking the beginning of the final decline in Intermediate wave (C). This bearish phase may develop over the coming months and could persist through the end of the year.
#CryptoStocks #CLSK #BTCMining #Bitcoin #BTC
NASDAQ:CLSK MARKETSCOM:BITCOIN CRYPTOCAP:BTC BITSTAMP:BTCUSD
EURUSD market structure analysis on M15, H1 timeframesH1 Timeframe – Main Trend: BULLISH
🟢 Current Situation:
The H1 structure is showing a clear sequence of Higher Highs (HH) and Higher Lows (HL) ⇒ indicating an uptrend.
The market is currently in a retracement phase following the last bullish impulse.
Price is approaching a demand zone from a previous structure, where buy orders may be stacked.
📉 M15 Timeframe – Main Trend: BEARISH (within H1 pullback)
🔍 Current Observations:
While H1 is in a retracement, M15 shows a clear bearish market structure (Lower Lows – Lower Highs).
However:
Price has tapped into the H1 demand zone.
A liquidity grab (sweep of highs/lows) just occurred on M15.
This was followed by a Break of Structure (BOS) to the upside ⇒ signaling potential absorption of sell-side liquidity and a reversal in alignment with the higher timeframe (H1).
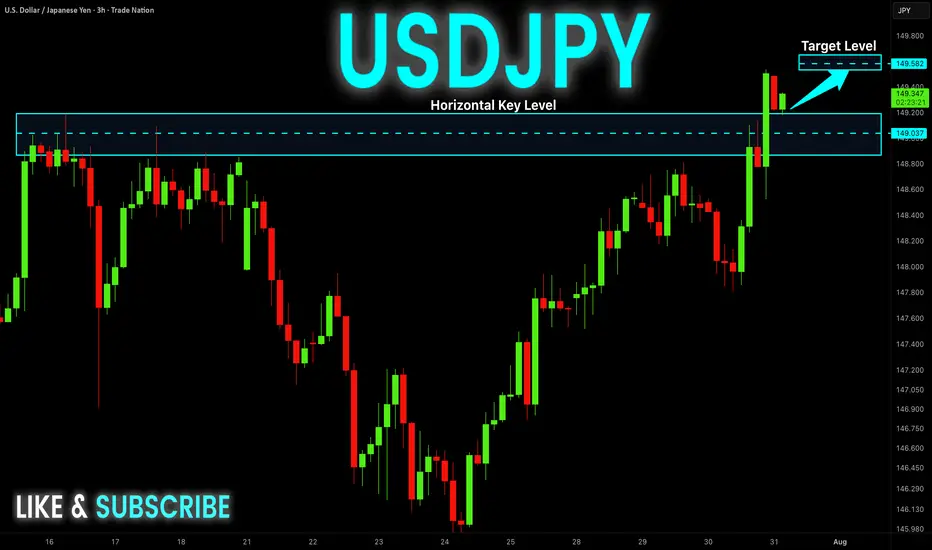
USD-JPY Will Keep Growing! Buy!
Hello,Traders!
USD-JPY keep growing and
The pair made a bullish breakout
Of the key horizontal level
Of 149.181 and the pair is
Already retesting the new
Support and we will be
Expecting a further
Bullish move up
Sell!
Comment and subscribe to help us grow!
Check out other forecasts below too!
Disclosure: I am part of Trade Nation's Influencer program and receive a monthly fee for using their TradingView charts in my analysis.
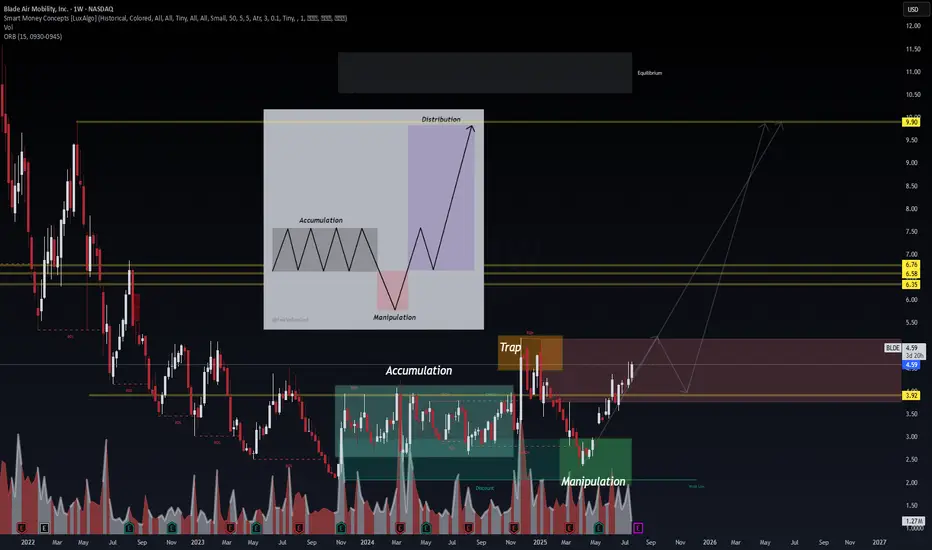
BLDE – VolanX Smart Cycle Activation📈 BLDE – VolanX Smart Cycle Activation
Timeframe: Weekly
Posted by: WaverVanir International LLC | VolanX Protocol
Model: Accumulation → Manipulation → Expansion
After multiple Breaks of Structure (BOS) and prolonged markdown, BLDE has now confirmed a Smart Money Accumulation Cycle. A clear manipulation sweep below prior lows has triggered the upside phase. This chart follows the classic SMC model with:
🔹 Accumulation → Trap → Manipulation → Expansion
🔍 Key Observations:
Accumulation zone: $2.00–$4.00
Trap high: ~$5.00 (liquidity run & rejection)
Clean reclaim of $3.92 structure now acting as launchpad
Next zones of interest:
• $6.35
• $6.58
• $6.76
• Ultimate distribution zone: $9.90
📊 VolanX Thesis:
We are entering a Mark-Up Phase consistent with the VolanX Alpha Expansion Model. As liquidity rotates upward, expect a stair-step climb toward the equilibrium zone near $9.90.
🧠 Strategic Insight:
If price pulls back into the $3.92–$4.10 range, that would be considered a high-probability re-entry for bulls aligned with institutional footprints.
🛡️ Risk Lens:
Monitor for early distribution at $6.76. VolanX Guardian Protocol flags rising volume anomalies in that range.