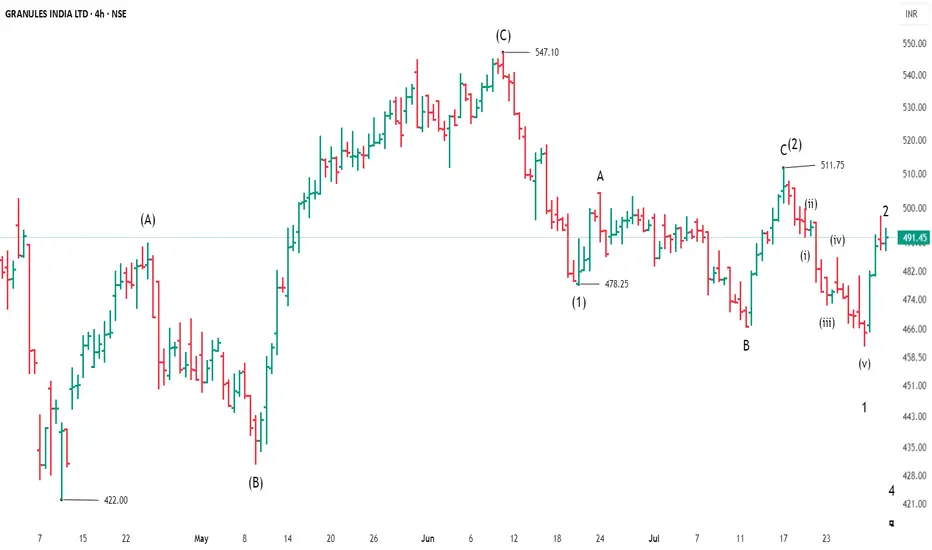
GRANULES india ltd - short term trend - bearishaccording to EWP analysis, Granules india Ltd
from the bottom of 422 to 547 price has unfolded in Flat correction
wave (B) retraced wave (A) X more than 78.6%
Wave(C) projected wave (A) X 1.618%
from the top of 547 to 478 is impulsive wave (1)
from 478 to 511 price is unfolded in extended flat corrective wave format.
from price 511 to down trend is identified as wave(3) in progress
followed expecting impulsive wave towards down trend or another correction resulting in complex correction.
target for impulsive wave(3) would be 400 -wave(A) X1.618%
Wave Analysis
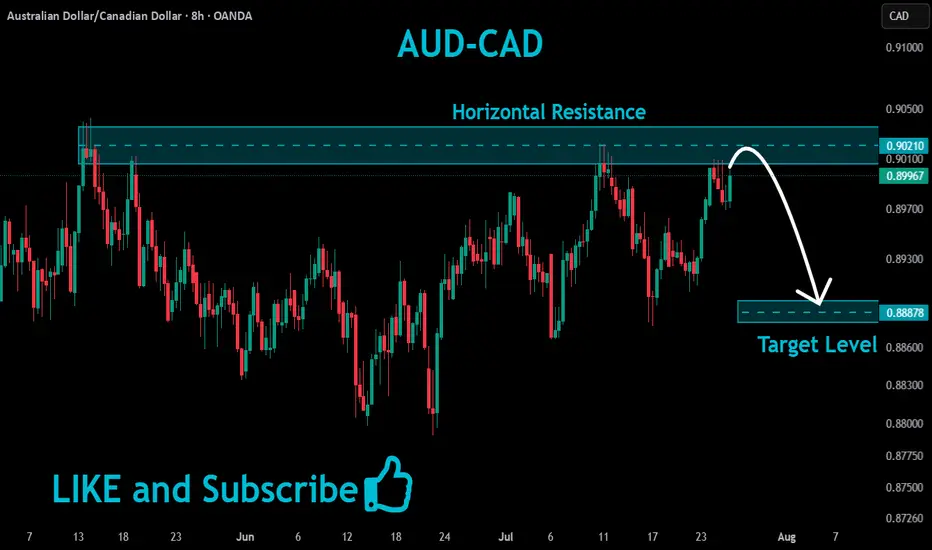
AUDCAD Resistance Ahead!
HI,Traders !
#AUDCAD is trading in an
Uptrend but the pair is locally
Overbought so after the pair
Hits the horizontal resistance
Level of 0.90210 we will be
Expecting a local bearish
Move down !
Comment and subscribe to help us grow !
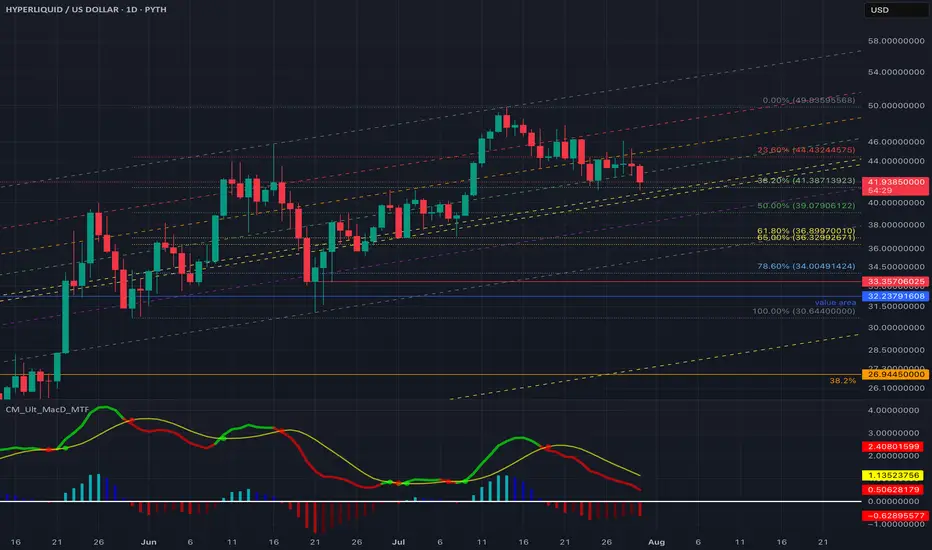
Analyzing Healthy Pullback on $HYPE with Fibs + RSIAfter a strong rally to ~$49.83, PYTH:HYPEUSD is now retracing into a critical Fibonacci confluence zone — a key moment to watch as we position for the next potential leg up.
Key Observations
Price is hovering around Fib 0.382 and nearing the Fib Channel 0.618
RSI is approaching oversold (currently ~32)
MACD remains bearish with momentum still building
If the golden pocket zone (~$39–$40) holds, it could mark the end of this short-term correction.
Trade Setup to Watch
When price taps the $39–$40 level, we will be looking for
✅ MACD crossover on lower timeframes
✅ Bullish RSI divergence
Because this could signal a short-term bounce opportunity.
So, I am expecting the entry zone around $39.0 – $40.0
TP1 - $44.4 (Fib 0.236 – first resistance)
TP2 - $49.8 (Previous swing high)
TP3 - $53–$55++ (Extension target if bullish continuation resumes)
If there is any changes in the macro environment, we also have a contingency plan to buy more lower. If price breaks below the golden pocket, strong support lies in the $30–$33 region. So we will do big accumulation there. It is a huge discounts imo. It is like 5% of probability to actually happen at the current market condition though.
Even a deeper move toward $27 (TOTALLY unlikely at the moment!) would be a mega long opportunity. When it happens, it should not be a breakdown panic.
Final Thoughts
Current price action appears to be a standard pullback.
The confluence of Fib retracement + channel support makes this a high-probability bounce zone.
Watch for bullish divergence or volume spike between $36–$39
Patience now = Better positioning later.
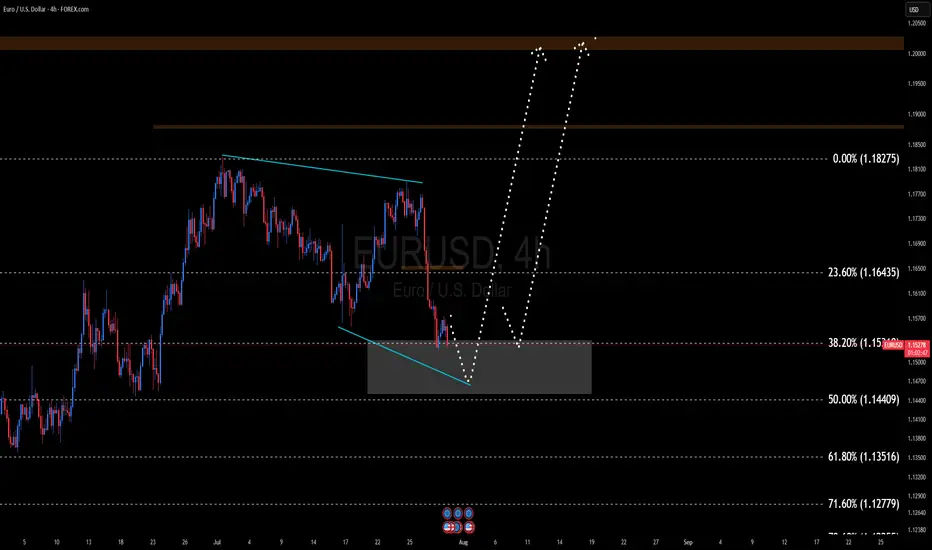
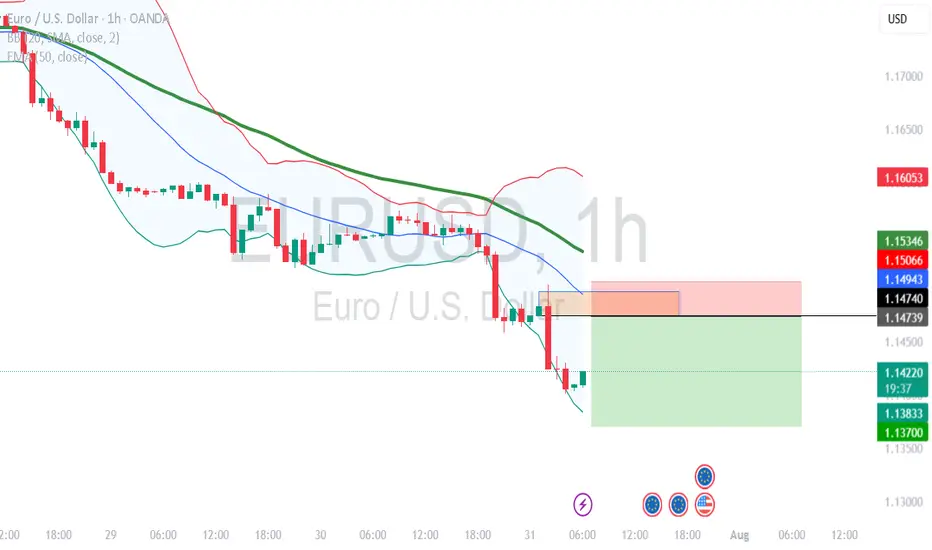
EURUSD Bear dominating the market30th June Daily candle closed with strong bearish.
we could observed a drop-base-drop candle pattern in a lower time frame.
for today plan:-
i will wait at the "base" area around 1.147*** area for the bearish signal.
calculate your own risk & reward.
Good luck
XAUUSD Update CONSOLIDATIONAfter bullish rejection, Gold make a new lower and break 3283 support level.
Now it seemslike bounce to make a correction and retest 3305 resistance.
If 3305 reject, price will continue moving downside and retest 3245 support.
If it break 3245...it will continue to find it support, near 3205 support zone.
Have a blessing day !

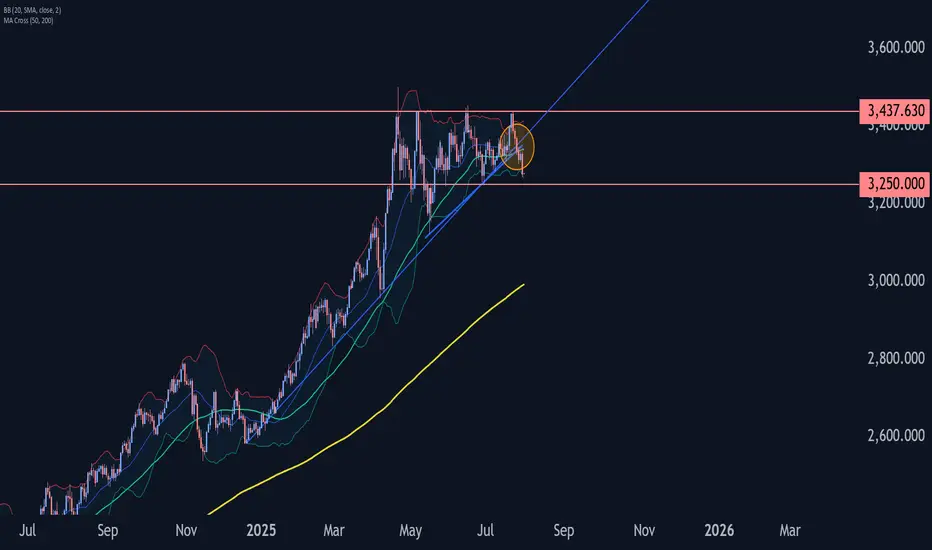
Gold Wave Analysis – 30 July 2025- Gold falling inside wave b
- Likely fall to support level 3250.00
Gold is under bearish pressure after the price broke the two upward-sloping support trendlines from May and February.
The breakout of these support trendlines accelerated the active short-term correction b – which belongs to the impulse wave 3 from June.
Gold can be expected to fall further to the next round support level 3250.00 (former low of waves 2 and (b) from May and June).
RDDT Earnings Play — July 30 (BMO)
## 🚀 RDDT Earnings Play — July 30 (BMO)
**🎯 Bullish Call Trade | 75% Confidence | High Momentum Setup**
---
### 📈 REDDIT, INC. (RDDT) – EARNINGS SNAPSHOT
🧠 **Revenue Growth**: +61.5% TTM — AI + Ads combo paying off
💸 **Margins**:
• Gross: 90.8% ✅
• Op: 1.0% 🚩
• Profit: 8.1% 👍
🧾 **EPS Surprise Streak**: ✅ 5 for 5 | Avg. +191%
🎯 **Target Price**: \$155.58 (+9.5%)
⚖️ **Forward P/E**: 222.6 — Rich but justified?
**Score: 8/10**
📊 Sector: Comm Services (AI-driven tailwinds)
---
### 💥 OPTIONS FLOW SNAPSHOT
💰 Calls Stack at \$150 & \$160
🛡️ Puts cluster \$140–\$149 = Hedges, not bearish bets
📉 IV High = Juicy premiums
📈 Gamma Bias: Positive Skew
**Score: 7/10**
---
### 🔍 TECHNICAL CHECK
📍 Price: \~\$145.32
🧭 20D MA: \$147.89
📊 RSI: 59.5 (Momentum neutral, room to run)
🔓 Resistance: \$150
🛡️ Support: \$140
**Score: 6/10**
---
### 🌎 MACRO CONTEXT
🧠 Sector tailwinds from AI hype + digital ad rebound
🛑 No major regulatory red flags
**Score: 8/10**
---
## 🔥 THE TRADE SETUP
**📈 Direction**: Bullish
🎯 **RDDT 08/01 \$150C**
💸 **Entry**: \$9.55
🛑 **Stop Loss**: \$4.78
📈 **Target**: \$19.55+
🧮 **Size**: 1 Contract = \$955 Risk
🕒 **Entry Timing**: Pre-earnings close
📆 **Earnings Time**: BMO (Before Market Open)
📊 Expected Move: \~5%
📈 Setup = High risk / High reward, theta-sensitive
---
## ⚡ TRADE PLAN
✅ Take partial profit at 100%, full at 200%
⏳ Exit within 2H post-ER if target unmet
🛑 Cut below \$4.78 to cap drawdown
---
## 🧠 CONVICTION SCORE
🎯 75% Bullish Bias
📊 Based on fundamentals, options, and flow
📉 Risk = Valuation + Thin Op Margin
📈 Reward = Explosive upside w/ surprise history
---
💬 **Watch for \$150 breakout. If cleared post-ER = moonshot to \$160 possible.**
📢 #RDDT #EarningsTrade #RedditStock #CallOptions #AIStocks #TechMomentum #OptionsFlow #IVSurge #TradingViewIdeas #SwingTrade #OptionsStrategy #VolatilityPlays #RDDTstock

XAUUSD Long@3275 TP@3350 SL@3243XAUUSD
Long@3275
TP@3350
SL@3243
It is better to long XAUUSD@3275 as the price hold above the dow theory of daily and weekly timeframe. Good risk/reward ratio. Target for 3350.

META Earnings Trade Setup — July 30 (AMC)
## 🧠 META Earnings Trade Setup — July 30 (AMC)
📈 **META (Meta Platforms Inc.)**
💥 **Confidence**: 85% Bullish
💡 **Play Type**: Pre-earnings call option
📊 **Fundamentals + Flow + Setup = High Conviction Swing**
---
### 📊 FUNDAMENTALS SNAPSHOT
✅ **Revenue Growth**: +16.1% YoY
✅ **Profit Margin**: 39.1%
✅ **Gross Margin**: 81.8%
📈 **8/8 EPS Beats** — Avg Surprise: +13%
🧠 **Digital Ad Rebound + AI Integration = Growth Engine**
🟢 **Score: 9/10**
📌 Bottom line: Elite execution + consistent guidance beats
---
### 🔥 OPTIONS FLOW CHECK
💰 **Call Walls**: \$720 / \$730
📈 **Call/Put Skew**: Bullish tilt
🔎 **IV Rank**: 0.65 — High enough for a move, not extreme
📈 **Market Expectation**: \~6% move
🟢 **Score: 8/10**
📌 Institutional flow leans long — smart money eyes upside
---
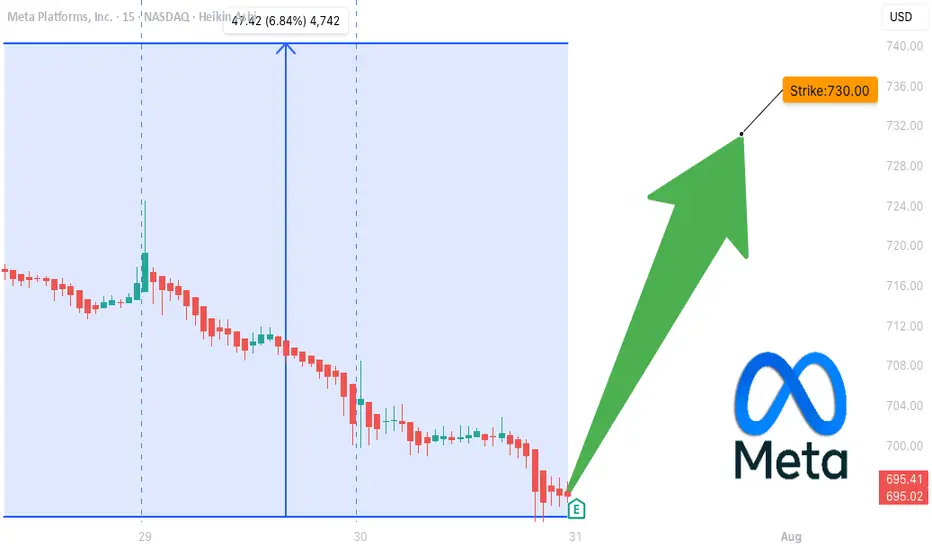
### 📉 TECHNICAL SETUP
📍 **Price**: \~\$700
📉 RSI: 34.34 → OVERSOLD
📉 20D MA: \$713.27 (near-term bounce target)
📌 Support: \$692.50 | Resistance: \$720
🟡 **Score: 7/10**
📌 Post-consolidation rebound setup into earnings
---
### 🌎 MACRO CONTEXT
💡 Growth + AI names in focus
📢 Communication Sector → Risk-On Rotation
📌 META riding digital ad/AI secular trends
🟢 **Score: 8/10**
📌 Macro tailwinds match company strengths
---
## 🎯 TRADE IDEA
**META 08/01 \$730 CALL**
💵 Entry: \$10.00
🎯 Target: \$30.00 (300% ROI)
🛑 Stop: \$5.00 (50% loss cap)
⏰ Entry: Pre-close on July 30 (AMC earnings)
📏 Size: 1 Contract (Risk \$1,000 max)
### ⚖️ Risk/Reward
* Max Risk: \$1,000
* Target Profit: \$3,000
* IV Crush Protection: **Exit within 2 hours post-earnings**
---
## 📌 WHY IT WORKS
✅ Meta beats 8 straight quarters
✅ Fundamentals elite
✅ Bullish options stack
✅ Oversold tech setup
⚠️ Risk? Always — but *structured speculation wins* 📐
---
📣 Tag someone who trades earnings like a sniper 🎯
\#META #EarningsPlay #OptionsTrading #IVCrush #CallOptions #TechStocks #AIStocks #TradingView #DigitalAds #SwingTrade #StructuredRisk
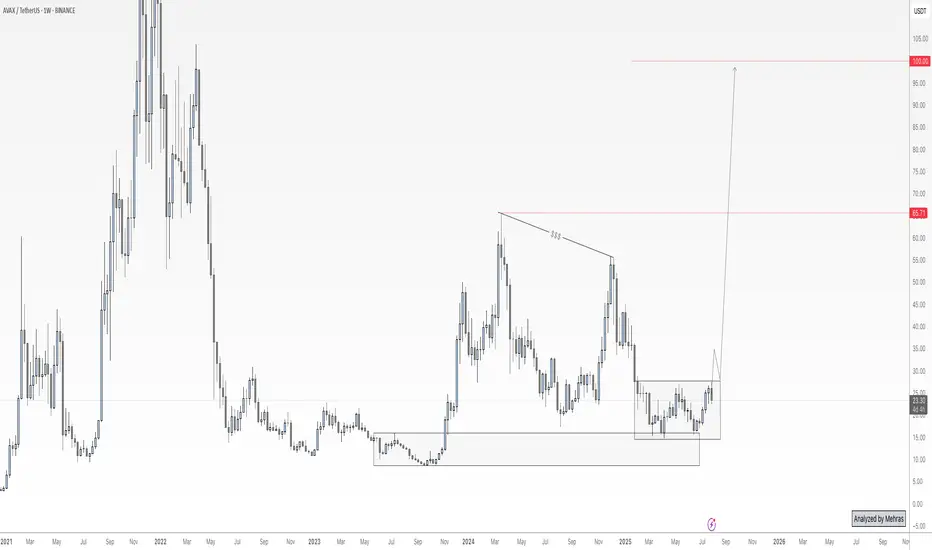
AVAX – Hidden Chance for Latecomers🔥AVAX – High-Potential Setup Amid Market Catch-Up
While many crypto assets have surged in the recent bullish wave, AVAX appears to have been left behind — and that could present a high-reward opportunity ahead.
From both a fundamental and on-chain perspective, this project shows promising signs, especially with notable activity among whale wallets. I believe AVAX has the potential for a strong long-term rally — but there’s one critical condition to watch.
Price has recently reacted to a key custom demand zone. However, for confirmation of buy-side strength, we need to see a clean breakout and daily close above the ~$28 level. If that breakout is confirmed, I’ll be looking to accumulate for a long-term hold, with a target of $65 — and possibly up to $100 if momentum continues.
That said, risk management remains my top priority. I’ll allocate no more than 3–4% of my total portfolio to this position.
Keep an eye on the $28 breakout. If the trade is triggered, I’ll provide updates here.
🔁 This analysis will be updated whenever necessary.
Disclaimer: This is not financial advice. Just my personal opinion.
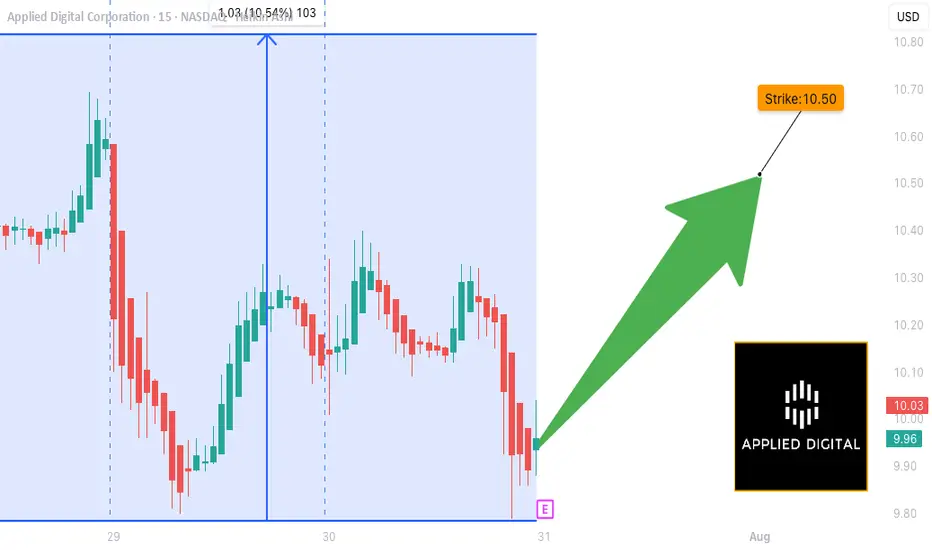
APLD (Applied Digital):EARNINGS TRADE SETUP (2025-07-30)
🚨 **EARNINGS TRADE SETUP: APLD (Applied Digital)**
🗓️ Earnings: **July 31 (AMC)**
💥 Confidence: **65% Moderate Bullish**
🔥 Recent Run: **+94% past 3 months**
🧠 AI Infrastructure Hype + High IV = Opportunity
---
### 📊 FUNDAMENTALS SNAPSHOT
🟢 **Revenue Growth**: +22.1% YoY
🔴 **Profit Margin**: -110.4%
🔴 **Operating Margin**: -34.7%
⚠️ Historical EPS Beat Rate: **12% only**
📈 Analyst Target: **\$14.61** (+42.8% upside)
🔎 **Verdict**: High growth, deep losses — speculative with upside
---
### 🧠 OPTIONS FLOW
💣 **High IV Crush Risk**
🟥 **Put Wall**: \$10.00 (6,700 contracts)
🟩 **Speculative Calls**: \$10.50 & \$11.00 loaded
⚖️ Mixed Sentiment → Tilted Bullish
---
### 📉 TECHNICAL CHECK
💹 Price: **\$10.12**
📉 Below 20D MA (\$10.31)
📌 Support: **\$10.00**
📌 Resistance: **\$10.50**
⚠️ RSI Cooling → Watch for breakout or rejection
---
### 💥 TRADE IDEA
**🎯 Call Option — Strike \$10.50 — Exp 08/01**
💵 Entry: \$0.57
🚀 Profit Target: \$2.28 (200–400% ROI zone)
🛑 Stop Loss: \$0.285
📈 Size: 1 contract (2% of portfolio)
🕓 Exit: 1–2 hours post earnings to avoid IV crush
---
### 🧠 TRADE LOGIC
Risky setup — but technicals + AI narrative + speculative flow = **earnings lotto ticket with strategy.**
💬 *"Speculation with structure beats blind YOLO."*
---
📌 Tag a trader who likes calculated risk 📈
📉 Don’t forget to scale OUT, not just IN.
\#APLD #EarningsPlay #OptionsTrading #TradingView #AIStocks #YOLOWithStops #IVCrushProof #CallOptions #SwingTrade #BullishSetup
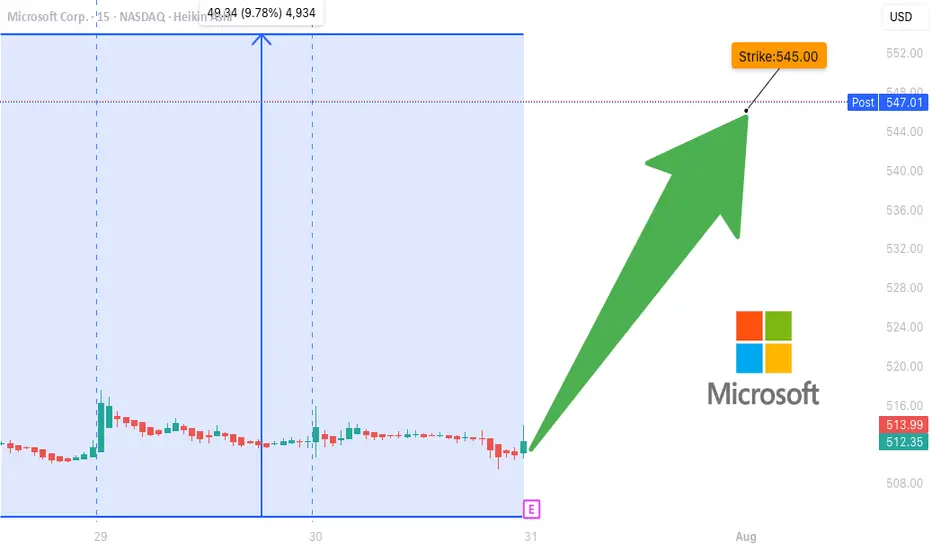
MSFT Earnings Play (2025-07-31) — STRONG BULLISH SETUP
**🚨 MSFT Earnings Play (2025-07-31) — STRONG BULLISH SETUP 🚨**
**Microsoft \ NASDAQ:MSFT Pre-Earnings Trade Idea — 545C (Aug 1)**
---
### 🧠 **Earnings Thesis (🔥 80% Conviction)**
MSFT is set to report **BMO July 31**, and all signs point *bullish*:
📈 **Revenue Growth**: +13.3% YoY, driven by **AI + Cloud** momentum
💰 **Margins**: Profit 35.8%, Op 45.7%, Gross 69.1% — textbook pricing power
📊 **Guidance**: 100% beat history, avg. +5.8% surprise
📌 **Analyst Consensus**: 💪 Strong Buy | Target: \$549.90
📊 **Sector Tailwinds**: Tech favored in current macro with Fed on hold
➡️ **Score: 9/10 Fundamentals | Bullish Momentum Across the Board**
---
### 🔍 **Options Flow & Technicals**
🔥 **Implied Move**: \~6.3% by Aug 1
📉 **IV Rank**: 0.75 (Room to expand post-earnings)
💸 **Call Flow**: Strong OI in 540–550 zone, gamma buildup may fuel squeeze
📊 **RSI**: 70.14 → Bullish, close to overbought
📈 **Support**: \$505 | **Resistance**: \$518.29
➡️ **Score: 8/10 Options | 8/10 Technicals**
---
### 🧨 Trade Setup: 545 CALL (Aug 1 Exp)
🎯 **Entry Price**: \$0.90
📅 **Expiry**: 2025-08-01
📈 **Profit Target**: \$1.80 (⚡️+100%)
🛑 **Stop Loss**: \$0.45
📐 **Size**: 2 contracts (2% portfolio risk)
💡 **Timing**: Enter **EOD July 30 (Pre-earnings)**
⚠️ **IV Crush Alert** → Exit within 2 hours *post-earnings*
---
### ✅ RISK PLAN
* Position: Max 2–3% of portfolio
* IV crush & gap protection: Tight stop and quick post-earnings exit
* Exit Plan: \$1.80 or Stop \$0.45, OR close manually after earnings move
---
📊 **Trade JSON Snapshot**
```json
{
"ticker": "MSFT",
"direction": "CALL",
"strike": 545,
"entry": 0.90,
"target": 1.80,
"stop": 0.45,
"expiry": "2025-08-01",
"entry_time": "EOD Jul 30",
"earnings_date": "2025-07-31 BMO",
"confidence": "80%",
"expected_move": "6.3%",
"iv_rank": "0.75"
}
```
---
🧠 **Summary**
MSFT is poised for a **clean earnings beat** with bullish fundamentals, strong options flow, and upside momentum. This is a **high-conviction, short-dated trade** with defined risk.
🎯 **Watchlist it. Size smart. Exit fast.**
Apple - The next major push higher!🍎Apple ( NASDAQ:AAPL ) will head for new highs:
🔎Analysis summary :
Apple has been underperforming markets for a couple of months lately. However technicals still remain very bullish, indicating an inherent and substantial move higher soon. All we need now is bullish confirmation and proper risk management and this setup looks very decent.
📝Levels to watch:
$200, $300
🙏🏻#LONGTERMVISION
Philip - Swing Trader

BITCOIN → Correction within a downward channel. 112K or 125K?BINANCE:BTCUSDT is consolidating. However, a local downward trading range is forming relative to the current setup. What is the probability of a correction continuing to 112K or growth to 125K?
Daily structure: a local correctional channel within a global bullish trend. We have cascading resistance at 119.2, 119.6, 120, and 120.8. It will be quite difficult to break through this zone on the first attempt, but MM can use it to form traps and collect liquidity.
At the bottom, everything is simpler — a breakdown of the local bullish structure, the formation of an intermediate minimum, below which there is a void down to 112K.
Yesterday, relative to 115-116K, mm staged a massacre (trap) on both sides of the market.
Liquidity collection, return to the range, and growth. The reaction to the false breakdown of support is quite strong. Since the opening of the session, Bitcoin has been heading towards resistance, but there may not be enough potential to break through the upper resistance conglomerate, so I expect to see a pullback or decline to 116-115-114.
Resistance levels: 119.2, 120.1, 120.85
Support levels: 116.37, 115.67, 112
Technically and fundamentally, I do not see any drivers that could support the market (I am talking about Bitcoin, since the driver for altcoins is the decline in Bitcoin's dominance). It is possible that this may appear later. In the current situation, I am considering a false breakout and correction, as the market has not yet finished consolidating or correcting, and the current downward trading range may be extended.
PS: As the price moves towards resistance, it is necessary to monitor the reaction. The market itself will show what it is preparing for...
Best regards, R. Linda!

Has gold bottomed out on July 30?
Key Influencing Factors
Negative Factors:
A stronger US dollar: A rebound in the US dollar index is suppressing gold prices.
Recovering risk appetite: Market demand for safe-haven assets is weakening.
Rising real interest rates: Expectations of Fed policy are impacting the cost of holding gold.
US-EU trade agreement: Easing geopolitical tensions will weaken gold's safe-haven appeal.
Potentially bullish variables:
Federal Reserve policy signals: A dovish statement on Wednesday could boost gold prices.
Geopolitical risks: Uncertainties such as the Sino-US trade negotiations and the situation in the Middle East remain.
Technical Analysis
Trend Analysis:
Short-term weakness (four consecutive negative daily candlestick patterns), but the broader bullish trend remains.
Key support level: 3300-3285 (falling below or falling to 3250); resistance level: 3330-3345 (breaking through may end the pullback).
Key Levels:
Downward Support: 3310-3300 (short-term), 3285 (strong support). Upper resistance: 3335-3345 (trend reversal expected after a breakout).
Trading Strategy
Short-term Trading:
Long positions primarily at low levels: Try a light buy position in the 3300-3310 area, with a stop-loss below 3285 and a target of 3330-3345.
Short selling at high levels is auxiliary: If it rebounds to 3335-3345 and is under pressure, you can short sell with a stop loss above 3350 and a target of 3310-3300.
Follow up on the breakout: If it breaks through 3345 strongly, you can chase long positions; if it falls below 3285, be wary of a rebound after a false break.
Medium- to Long-term Strategy:
Watch for potential bottoming opportunities near 3285. If it stabilizes, place long positions in batches, betting on dovish signals from the Federal Reserve or escalating geopolitical risks.
Risk Warning: Data-sensitive period: This week's Federal Reserve decision and economic data may trigger significant volatility, so position management is crucial. US Dollar Trends: The US dollar and gold prices show a significant negative correlation, so the US Dollar Index should be monitored closely.
Risk of false break: There may be a trap below 3300, which needs to be confirmed in combination with the K-line pattern.
Summary: Gold is under short-term pressure, but the medium- to long-term bullish outlook remains unchanged. Focus on the effectiveness of support in the 3300-3285 area and the direction of the Federal Reserve's policy. We recommend a flexible approach, using key breakthroughs as a guide for directional analysis, and cautiously holding positions before data releases.

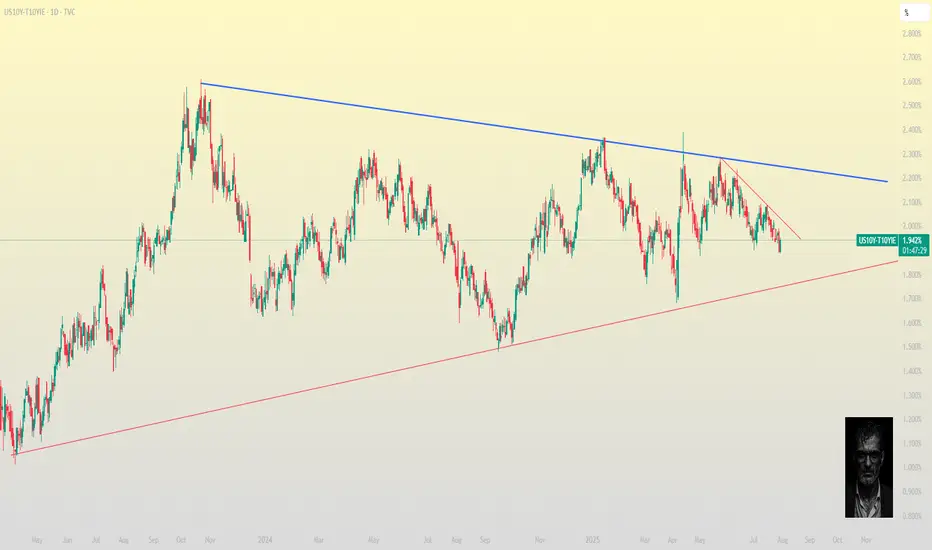
U.S. homebuilders tumble as rate cut bets decrease after Powell'** Shares of U.S. homebuilders slide on Weds after Fed chair Powell says no decision yet on rate cuts
** Markets now pointing to odds dropping below 50% that the Fed will cut rates at its next meeting in Sept, as benchmark U.S. 10-year yield
US10Y
extends rise
** Rising yields can potentially lead to higher mortgage rates, which could negatively impact homebuilders by making homes less affordable for consumers
** PHLX Housing Index
HGX
dropping >2% on the session
** Among biggest HGX fallers are: LGI Homes
LGIH
5%, DR Horton
DHI
>2%, Lennar
LEN
nearly 3%, Pultegroup
PHM
>3%
** In S&P 500
SPX
, building products maker Builders FirstSource
BLDR
down 5%, and home improvement retailers Home Depot
HD
and Lowe's
LOW
both off nearly 2%
** With moves on Weds, HGX down ~2% YTD vs 8% advance in SPX
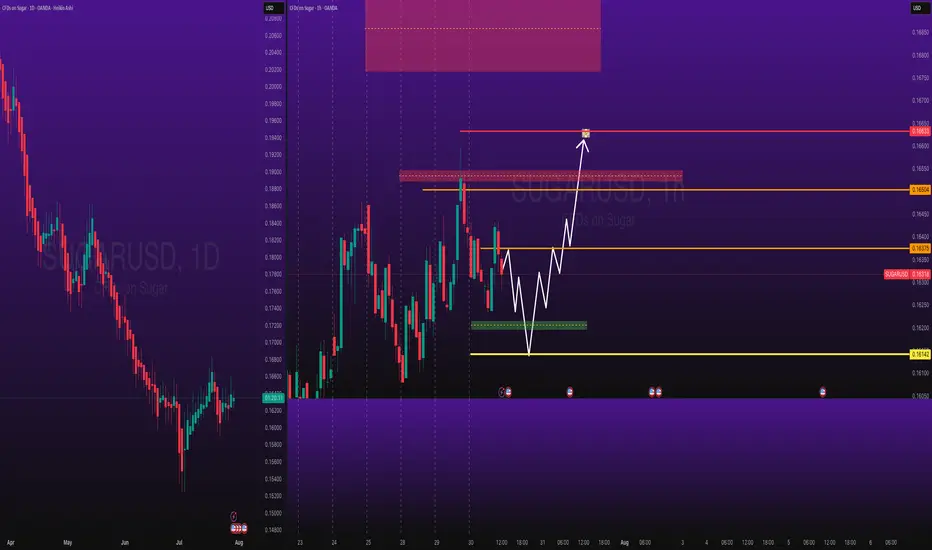
Sugar Long Trade PEPPERSTONE:SUGAR Long Trade, with my back testing of this strategy, it hits multiple possible take profits, manage your position accordingly.
Note: Manage your risk yourself, its risky trade, see how much your can risk yourself on this trade.
Use proper risk management
Looks like good trade.
Lets monitor.
Use proper risk management.
Disclaimer: only idea, not advice

Gold Slipping Lower — 3250 and 3200 in Sight!✅ Gold & DXY Update – Post-FOMC Price Action
Earlier today, before the U.S. interest rate decision, I released my outlook on both the Dollar Index and gold.
In that analysis, I highlighted the DXY’s readiness to move toward the key level of 100 — and as of now, price is actively testing that exact zone, just as expected.
As for gold, I repeatedly emphasized the visible weakness on the buy side. It was clear that there were very few remaining buy orders strong enough to hold price up in this region — and that’s exactly what played out. Price has started pushing lower, in line with our expectations.
Looking ahead, I believe the first target is 3250, followed by a deeper move toward the liquidity zone and the marked box around 3200, which could act as a key target area in the coming days.
🔁 This analysis will be updated whenever necessary.
Disclaimer: This is not financial advice. Just my personal opinion.

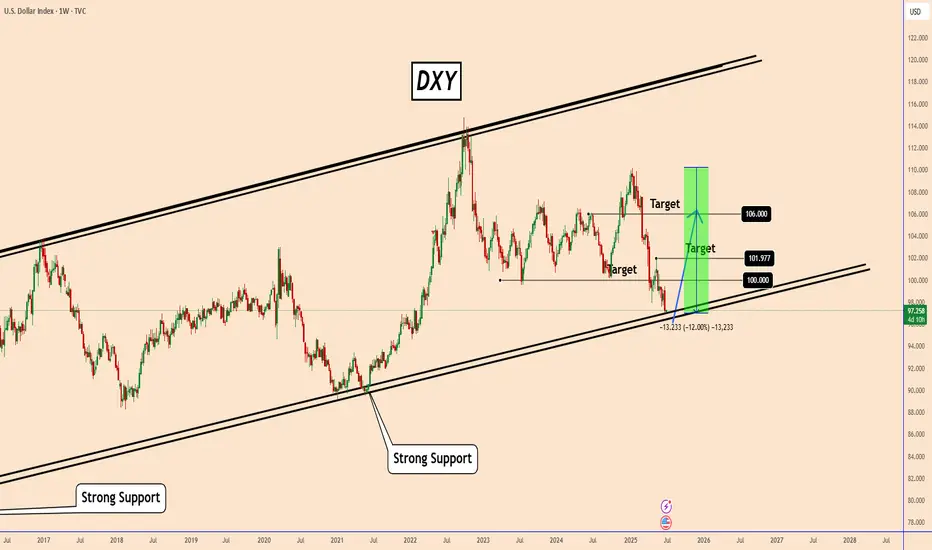
DXY: Weekly OutlookWeekly DXY Outlook
On the weekly chart, the US Dollar Index (DXY) has reached a critical zone that was last tested in February 2022.
While a rebound is not guaranteed, the fact that the DXY has declined nearly 12% over just six months—despite a resilient U.S. economy—suggests the potential for renewed strength in the dollar.
I think the index could begin a recovery toward key levels at 100.00, 101.97, and possibly 106.00/
It’s worth noting that the broader bearish trend began with the trade tensions initiated during the Trump administration, which strained relations with several major trading partners.
Given that this is a weekly chart, it should be used more as a reference point rather than a trading signal.
You may find more details in the chart!
Thank you and Good Luck!
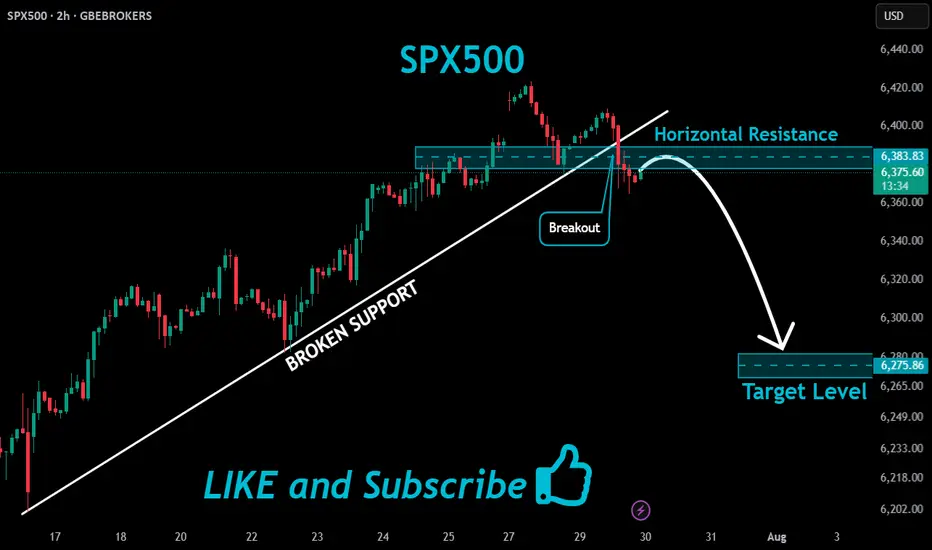
SPX500 Bearish Bias!
HI,Traders !
#SPX500 broke both the
Rising and horizontal
Support line which are
Now resistance areas
And the breakout is
Confirmed so we are
Bearish biased and we
Will be expecting a
Further bearish move down !
Comment and subscribe to help us grow !
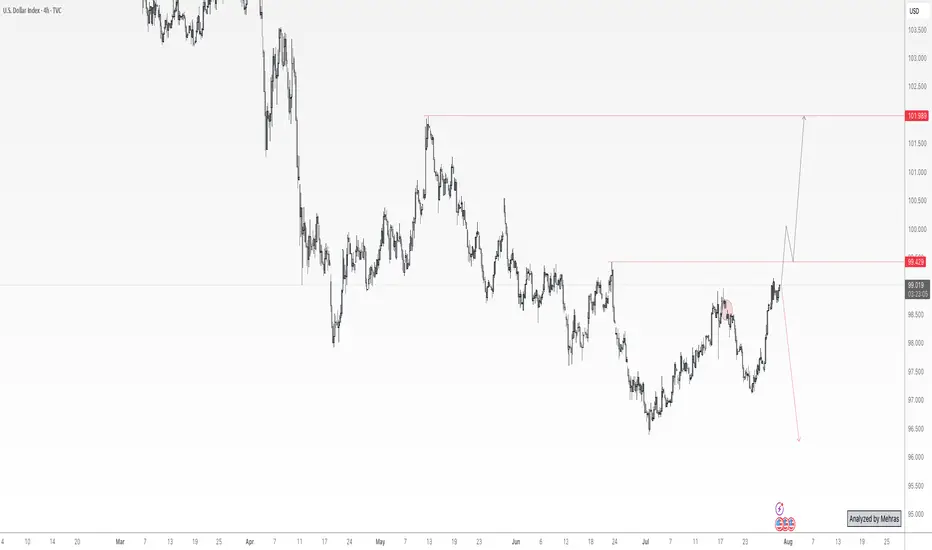
DXY Bulls Ready — Can Powell Spark the Rally?📊 DXY Pre-FOMC Outlook
In my previous analysis released on Monday, I expected the Dollar Index to fill the gap around the 98.60 zone and range below the key red line at 99.429.
Now, with less than 8 hours left until the highly anticipated FOMC rate decision, it’s time to take a closer look at tonight’s event and what it could mean for the markets.
From a purely technical perspective — setting the news aside — the Dollar Index looks ready to break through the crucial 100 level and kick off a strong bullish rally.
However, recent political pressure from Trump urging rate cuts, along with visible tension between him and Fed Chair Jerome Powell, has created uncertainty. If it weren’t for these conflicting signals, I would’ve confidently expected a clean breakout above 100.
As much as I enjoy trading news-driven events, I’ll likely stay out of the market tonight and observe from the sidelines. The setup is tempting, but the dual narratives make it risky.
That said — if you ask for my final take — I believe the stage is fully set for a bullish dollar and a corresponding drop in gold, EUR, GBP, and other major assets.
Let’s see how it plays out. 👀💥
EURUSD BULLISH TREND EUR/USD is currently in a transitional phase and appears to have completed its retracement . It is expected to enter a bullish trend, with a possible breakout from the 1.14500 – 1.15200 range. These levels may serve as key turning points for the upcoming movement.