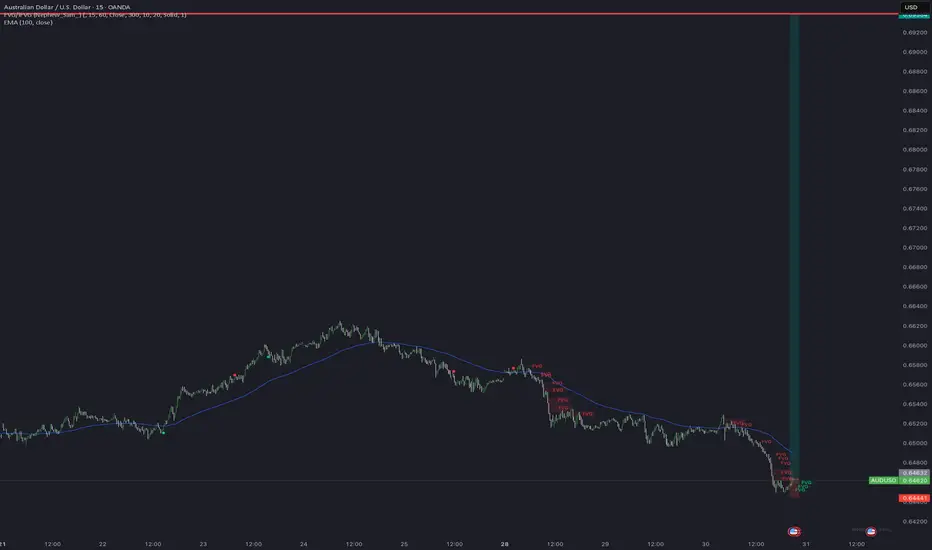
AUD USD BUYAfter a healthy correction AUD showing strength with some bullish divergence. A good entry for the restarec Elliot Wave.
Wave Analysis
Cello has bottomed out and will move upsideCello According to wave analysis has bottomed out and can give good risk reward from here
Buy At 590 to 600 range
sl 564
target 700

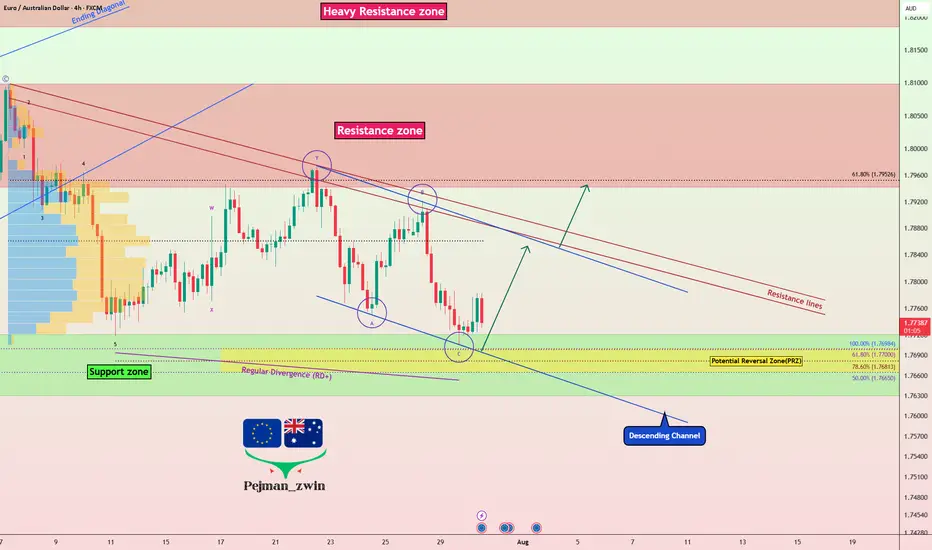
EURAUD Ready to Bounce? Key Support & Fundamentals Aligned!Today I want to share a Long position idea on EURAUD ( OANDA:EURAUD ) with you.
From a fundamental perspective , both the Euro (EUR) and Australian Dollar (AUD) are currently under pressure. However, the Aussie appears fundamentally weaker in the short term, making the EURAUD Long setup more favorable at this stage.
AUD Weakness :
The Reserve Bank of Australia (RBA) has held rates steady at 3.85%, but recent inflation data has dropped to 2.7%, the lowest in over 3 years.
Most economists now expect the RBA to cut rates in its next meeting in August, possibly by 25 basis points.
Slowing economic growth and dovish forward guidance from the central bank are weighing heavily on AUD sentiment.
EUR Outlook :
The European Central Bank (ECB) is also facing weak economic data, but is taking a more cautious approach toward cutting rates.
Despite softer PMIs and sluggish growth in countries like Germany and France, the ECB has not confirmed a near-term rate cut, keeping EUR relatively stable.
This divergence between the RBA’s dovish stance and the ECB’s pause is supportive of EUR strength against AUD.
Summary :
With the RBA likely to ease policy soon and the ECB holding ground for now, the interest rate differential favors EURAUD upside. Fundamentals point toward further weakness in AUD, making the EURAUD Long a strategically sound trade idea for the coming days.
-------------------------------------------
Now let's analyze the conditions of the EURAUD chart on the 4-hour time frame .
EURAUD is currently trading near the Support zone(1.772 AUD-1.763 AUD) , Potential Reversal Zone(PRZ) , and near the lower line of the descending channel .
According to Elliott Wave theory , EURAUD appears to have completed a Zigzag Correction(ABC/5-3-5) .
Also, we can see the Regular Divergence(RD+) between Consecutive Valleys .
I expect EURAUD to rise to at least 1.784 AUD .
Second Target: 1.792 AUD
Note: Stop Loss(SL): 1.762 AUD
Please respect each other's ideas and express them politely if you agree or disagree.
Euro/Australian Dollar Analyze (EURAUD), 4-hour time frame.
Be sure to follow the updated ideas.
Do not forget to put a Stop loss for your positions (For every position you want to open).
Please follow your strategy and updates; this is just my Idea, and I will gladly see your ideas in this post.
Please do not forget the ✅' like '✅ button 🙏😊 & Share it with your friends; thanks, and Trade safe.
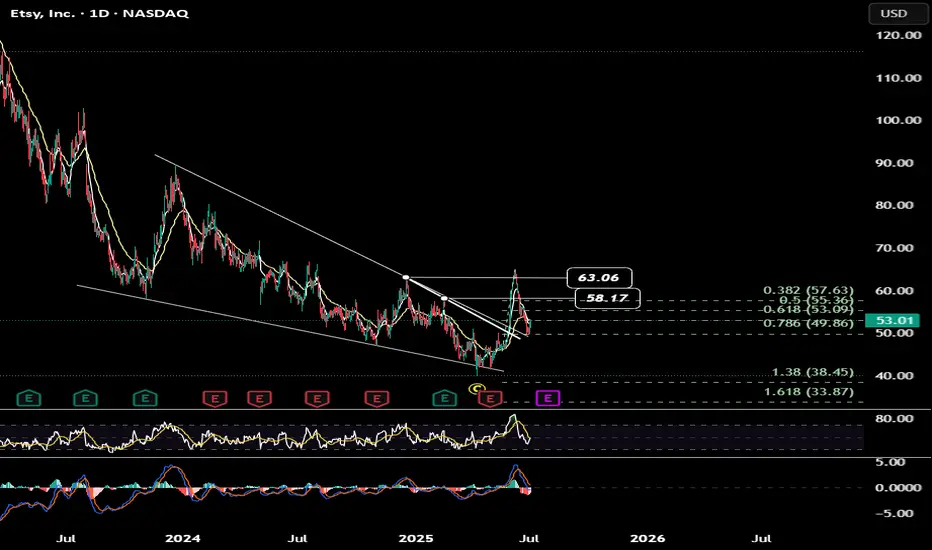
ETSY UPDATE ETSY is retesting ed trendline along with 78% fib . another chance or what !!!! same stop for me .
BTC FOMCOnce Again Ive the same view on BTC
There is a chance that it will go down now towards 113.500 straight so the internal buy towards 122.600 should be taken with low risk
if that level is reached the sell to 113.500 is prettyu much asured and also on 113.500 the buy to all time highs 127.500 and 133.000
GG

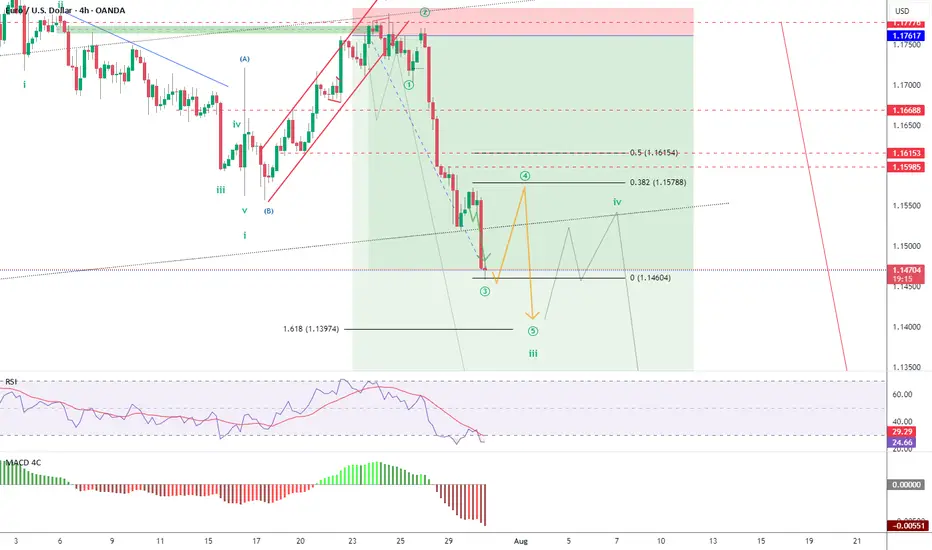
EUR/USD Elliott Wave: Corrective Pullback in Progress Wave ((4))EUR/USD 4H chart with Elliott Wave count. The pair remains in a steady downtrend after peaking at the wave (C) high, and is now in the middle of a larger wave iii decline. Bearish impulse waves dominate, with lower lows confirming the trend (mid-wave iii scenario). Now expecting a wave ((4)) relief bounce (corrective) within this wave iii. Price could rebound toward 1.15788–1.16153, the ~38.2–50% Fibonacci retracement zone of the prior drop.
This area is a likely resistance for the bounce, suggesting only a temporary uptick in an otherwise bearish move. After wave ((4)) completes, the downtrend should resume as wave ((5)) of iii kicks in. The next downside target is around 1.13974 (or lower) – near a 1.618 Fibonacci extension projection where wave ((5)) may complete. This would likely finish wave iii and aligns with the broader bearish Elliott Wave count.
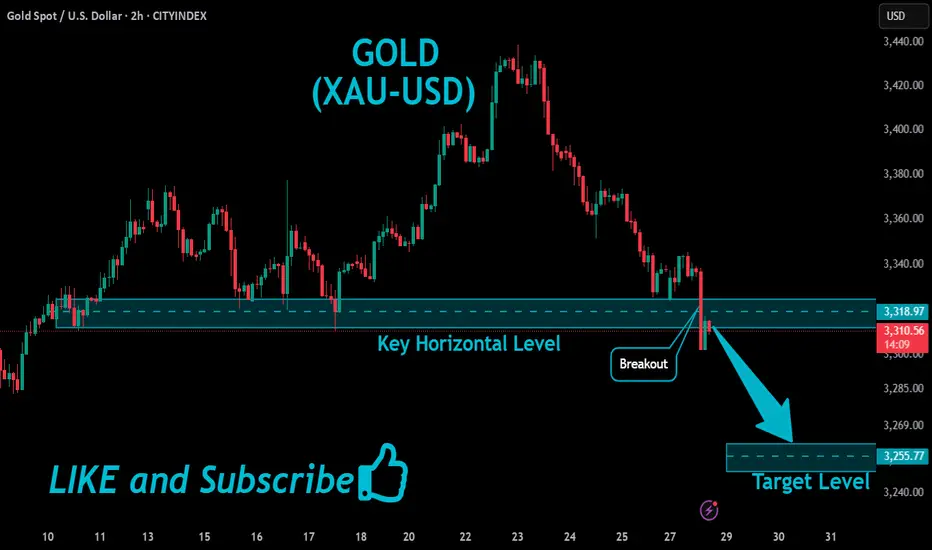
GOLD Bearish Breakout!
HI,Traders !
#GOLD is trading in a strong
Downtrend and the pair
Broke the key horizontal
Level around 3318.97 which
Reinforces our bearish
Bias and we will be
Expecting a further
Bearish move down !
Comment and subscribe to help us grow !
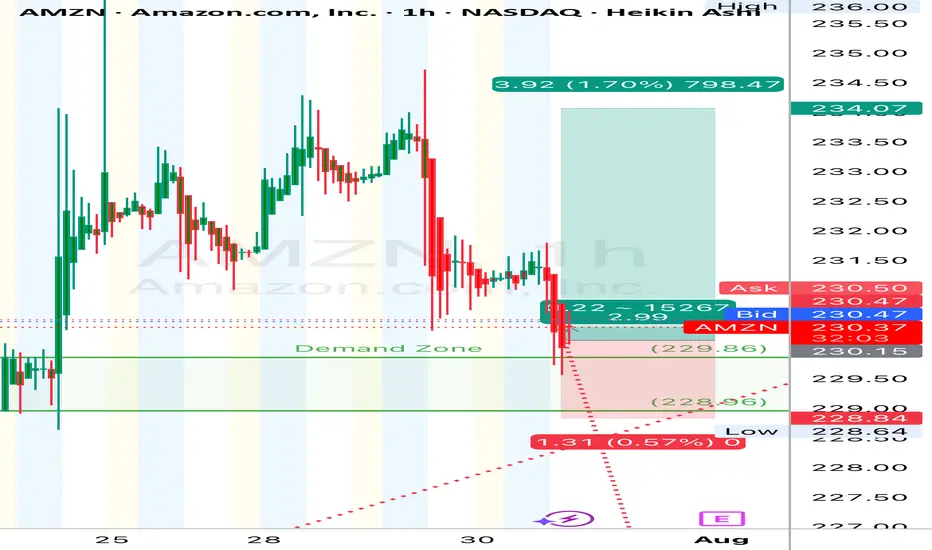
(AMZN) | 1H Chart Long
“Buyers defended the zone hard. Tight bull flag breakout setup forming after the demand tap. Looks like this thing wants to take another leg up. Clean R/R if managed tight.”
Price surged impulsively from mid-July lows, followed by a shallow correction—suggestive of a micro **Wave 4**.
* Current bounce off demand zone implies the potential start of **Wave (5)** to retest or break highs.
* **Demand Zone:** \$228.00–\$230.00 —
* **Supply Zone:** \$236.00 —234
🎯 **Trade Setup (Long Bias):**
* **Entry:** \$230.20 (current level near demand bounce)
* **Stop Loss:** \$228.80 (below the demand zone)
* **Take Profit :** \$236.00
* **Risk/Reward:** \~**1:3 RR**
*“The goal of a successful trader is to make the best trades. Money is secondary.” – Alexander Elder*
#### ⚠️ **Disclaimer:**
This is for educational purposes only and not financial advice. Trade at your own risk. Always manage your capital responsibly and use proper risk management.
GOLD FOMC Ok it will be rising this previous FOMC 90 minutes but then will fall fasta and sharp
Sell levels 3305 / 3310 SL above .618
Targets 3277 3263
Reversal spectation on 3263 towars all time highs 3550 and 3650

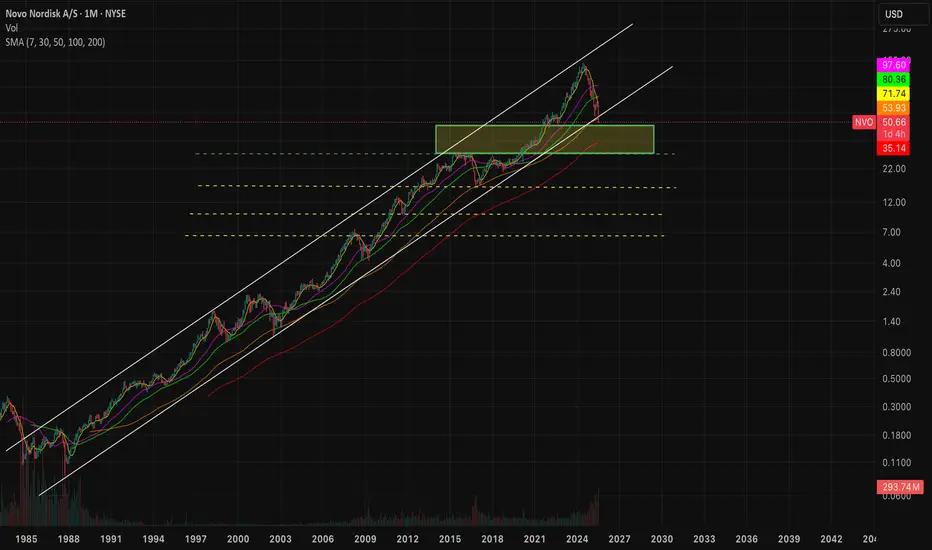
$NVO Accumulating long term compounder! - Previously, I have shorted NYSE:NVO when it was in $75-85 when moat was weakening and then went long around $58 to $75 for 40% on the long side. Everything is documented in my two posts.
- People are asking me if NYSE:NVO is cheap or not. After cutting guidance, I believe most of the estimates for EPS about NYSE:NVO are way off which would be revised downwards.
- At the same time, I believe NYSE:NVO has kitchen sinked their guidance because of new CEO transition which is very common in the publicly traded company.
- NYSE:NVO might not be cheap after cutting guidance honestly but not overvalued either.
- NYSE:NVO could be a dead money for some time 6 months, 1 year or 2 years who knows?
- But I know that weight loss industry in general is growing overall at least till 2030 and beyond.
- Some concerns I have is NYSE:NVO leadership is getting challenged by NYSE:LLY so it could be possible that NYSE:NVO might get lesser piece of the pie. However, overall piece is growing along with it so NYSE:NVO should continue to grow but at a lower rate than earlier.
- Net free cash flow should grow and company might return on investment to shareholders via share buybacks?
- Finally, I am buying NYSE:NVO in increments and have bought first lot of shares in $50.xx and will continue to add more if it drops more. I think NYSE:NVO can test 200 monthly moving average @ $35.
- I have marked the accumulation box in the chart for your reference.
SHIB Bullish DivergenceBINANCE:SHIBUSDT
Trade Setup:
Target 1: 0.00001335 (0.786 Fibonnaci Golden Zone).
Target 2: 0.00001391 (0.618 Fibonnaci Golden Zone).
Target 3: 0.00001430 (0.5 Fibonnaci Golden Zone).
Target 4: 0.00001597 (0 Fibonnaci).
Stop Loss: 0.00001172 (1.272 Fibonnaci).
RSI Analysis: The RSI is showing a bullish divergence, suggesting potential bullish momentum. The current RSI is around 24.02, approaching oversold territory, so caution is advised.

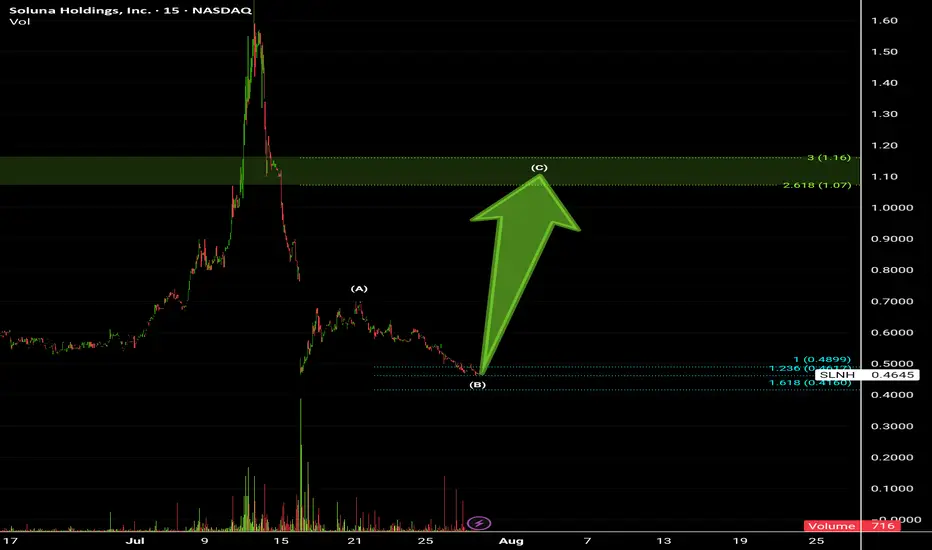
Soluna Holdings Inc.Stock on triggering level, Target prices between 261.8% - 300%
Highly recommended for Buying now 👌
Above 1$ will be the Target price.
Buy it now as much as you can before ignition starting UP 🔥🔥🔥💥💣🚀
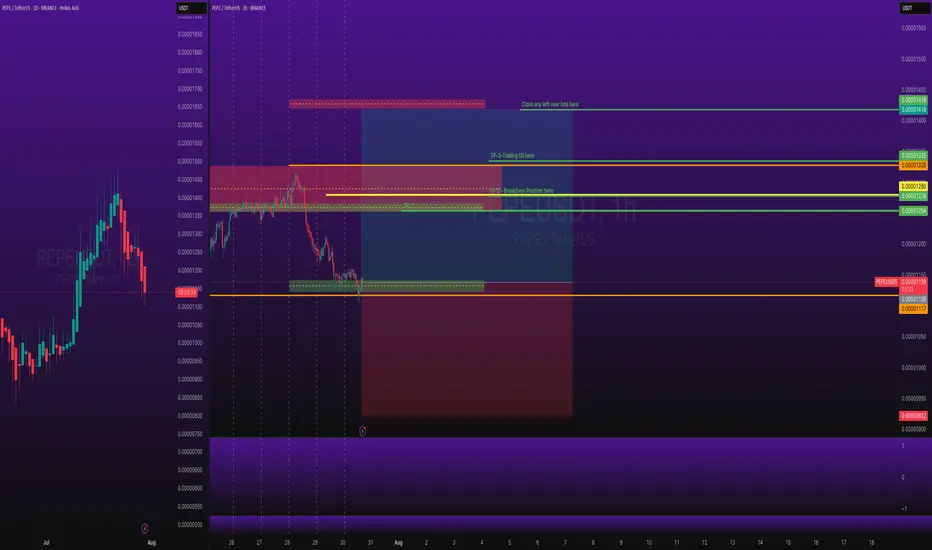
Crypto Trade: PEPEUSDT Long Swing Trade BINANCE:PEPEUSDT Long Swing Trade, with my back testing of this strategy, it hits multiple possible take profits, manage your position accordingly.
This is good trade, don't overload your risk like greedy, be disciplined trader.
I manage trade on daily basis.
this is good trade, lets see, don't be greedy, risk what you can afford.
Use proper risk management
Looks like good trade.
Lets monitor.
Use proper risk management.
Disclaimer: only idea, not advice
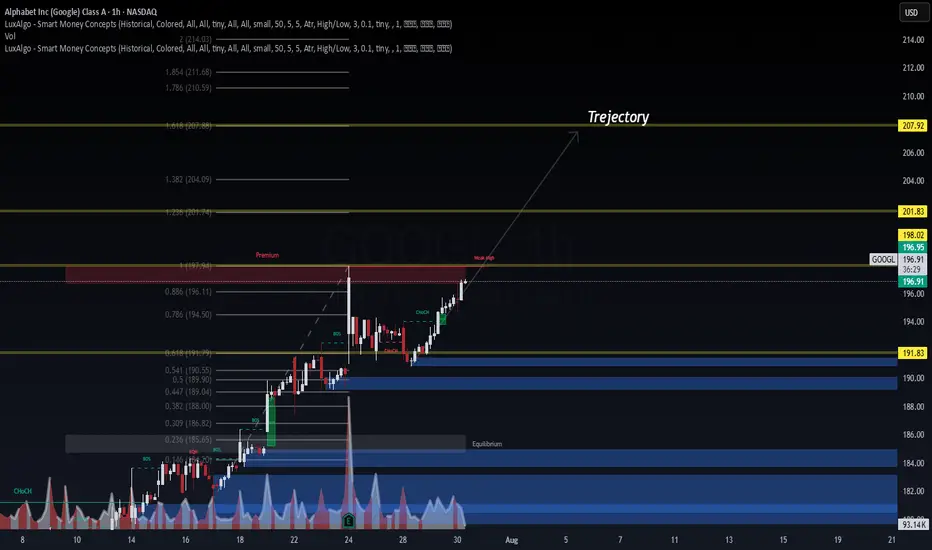
GOOGL Forecast – Dual AI Model Confirmation📊 GOOGL Forecast – Dual AI Model Confirmation
🔹 Posted by WaverVanir | VolanX Protocol
NASDAQ:GOOGL is showing strong bullish structure backed by both Smart Money Concepts (SMC) and AI model consensus.
🧠 VolanX AI Protocol Forecast (30-Day)
🎯 Target: $223.08 (+13.3%)
📈 Accuracy: 98.2%
📉 Drawdown: 0.00% (Backtested)
🧮 Sharpe Ratio: 7.70
🔵 Rating: Strong Buy
📉 WaverVanir DSS Model (Sentiment Score: 83)
🔸 30-Day Target: $198.47
🔸 Micro pullback expected before resuming uptrend
🔸 Ideal for refining short-term entries
🔍 SMC Structure:
BOS + CHoCH Confirmed
Premium zone at $197.94 cleared
1.236 Fib target: $201.83
1.618 Fib confluence: $207.92
Trajectory path = $223.08 if liquidity extends
📌 Strategy:
Entry: ~$196.95
TP1: $200.89
TP2: $223.08
SL: $188.80
R:R ~ 3.2:1
📢 Signal powered by WaverVanir DSS + VolanX Protocol
This is institutional-grade AI meets market structure.
#GOOGL #VolanX #WaverVanir #AITrading #SmartMoneyConcepts #SMC #Fibonacci #SwingTrade #Forecast #TradingView #StockSignals #InstitutionalAlpha #DecisionSupport #MachineLearning #DSS
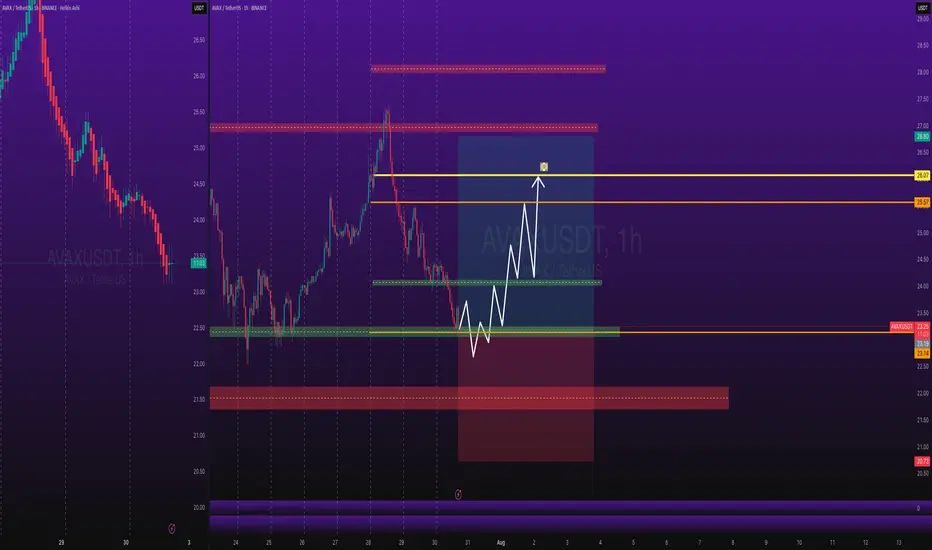
CryptoTrade: AVAXUSD Long Trade with SL and TPCOINBASE:AVAXUSDT Long Swing Trade, with my back testing of this strategy, it hits multiple possible take profits, manage your position accordingly.
This is good trade, don't overload your risk like greedy, be disciplined trader.
I manage trade on daily basis.
this is good trade, lets see, don't be greedy, risk what you can afford.
Use proper risk management
Looks like good trade.
Lets monitor.
Use proper risk management.
Disclaimer: only idea, not advice
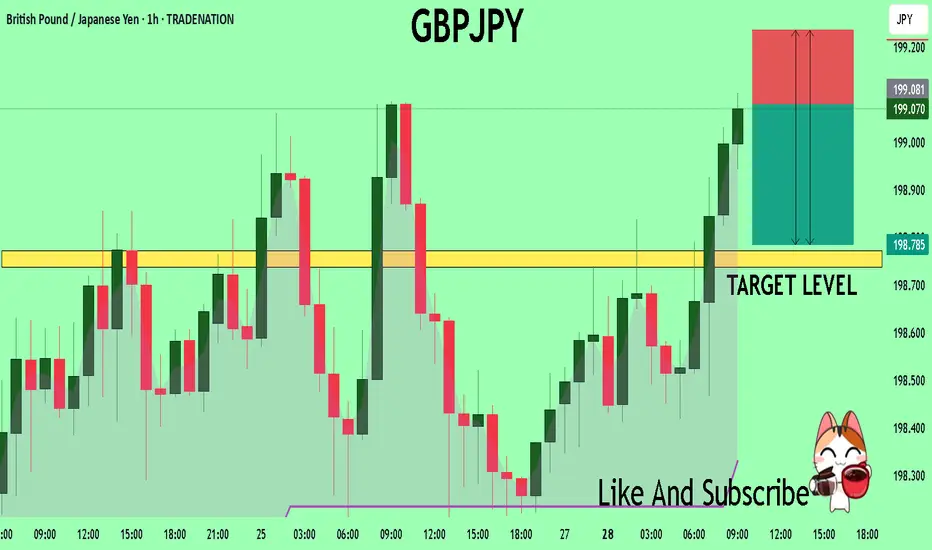
GBPJPY What Next? SELL!
My dear friends,
Please, find my technical outlook for GBPJPY below:
The price is coiling around a solid key level - 199.08
Bias - Bearish
Technical Indicators: Pivot Points Low anticipates a potential price reversal.
Super trend shows a clear sell, giving a perfect indicators' convergence.
Goal - 198.77
Safe Stop Loss - 199.23
About Used Indicators:
The pivot point itself is simply the average of the high, low and closing prices from the previous trading day.
Disclosure: I am part of Trade Nation's Influencer program and receive a monthly fee for using their TradingView charts in my analysis.
———————————
WISH YOU ALL LUCK
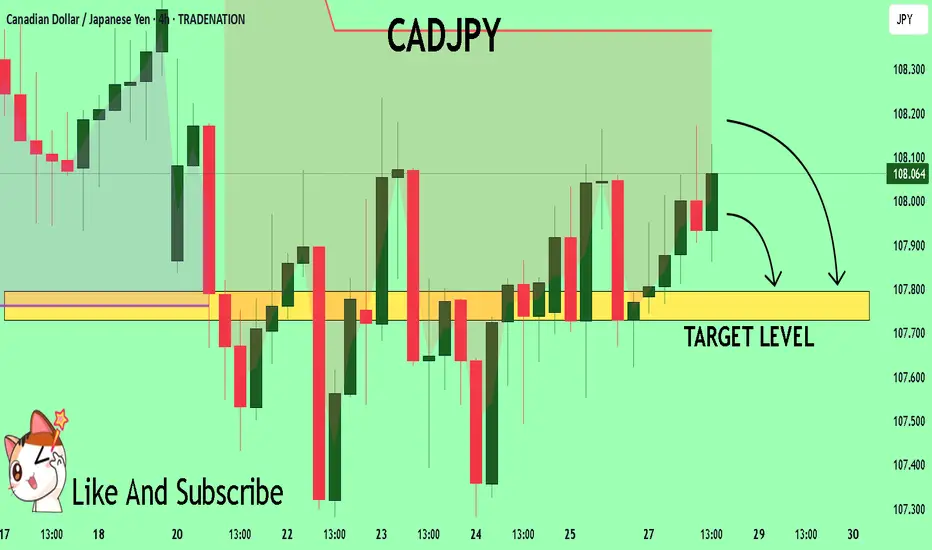
CADJPY Trading Opportunity! SELL!
My dear followers,
I analysed this chart on CADJPY and concluded the following:
The market is trading on 108.08 pivot level.
Bias - Bearish
Technical Indicators: Both Super Trend & Pivot HL indicate a highly probable Bearish continuation.
Target - 107.79
About Used Indicators:
A super-trend indicator is plotted on either above or below the closing price to signal a buy or sell. The indicator changes color, based on whether or not you should be buying. If the super-trend indicator moves below the closing price, the indicator turns green, and it signals an entry point or points to buy.
Disclosure: I am part of Trade Nation's Influencer program and receive a monthly fee for using their TradingView charts in my analysis.
———————————
WISH YOU ALL LUCK
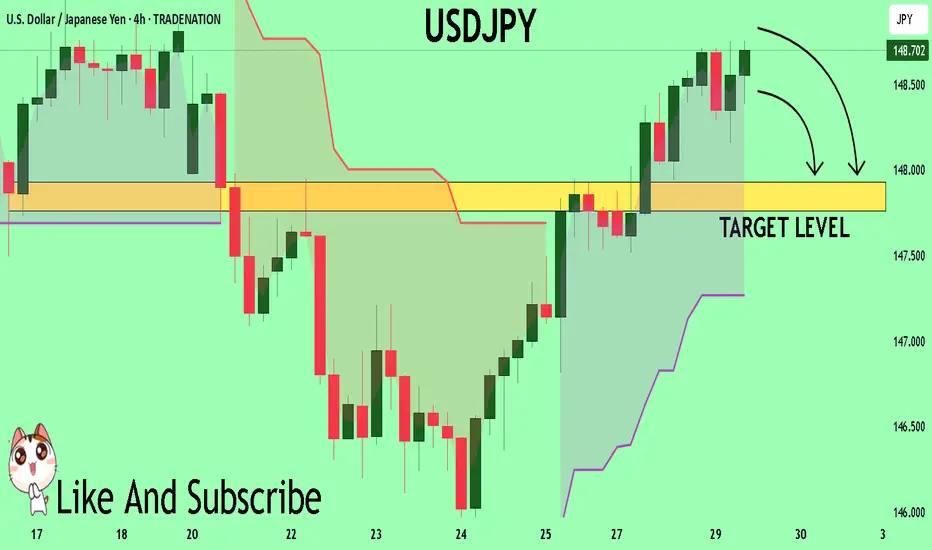
USDJPY A Fall Expected! SELL!
My dear subscribers,
My technical analysis for USDJPY is below:
The price is coiling around a solid key level - 148.71
Bias - Bearish
Technical Indicators: Pivot Points Low anticipates a potential price reversal.
Super trend shows a clear sell, giving a perfect indicators' convergence.
Goal - 147.93
About Used Indicators:
By the very nature of the supertrend indicator, it offers firm support and resistance levels for traders to enter and exit trades. Additionally, it also provides signals for setting stop losses
Disclosure: I am part of Trade Nation's Influencer program and receive a monthly fee for using their TradingView charts in my analysis.
———————————
WISH YOU ALL LUCK
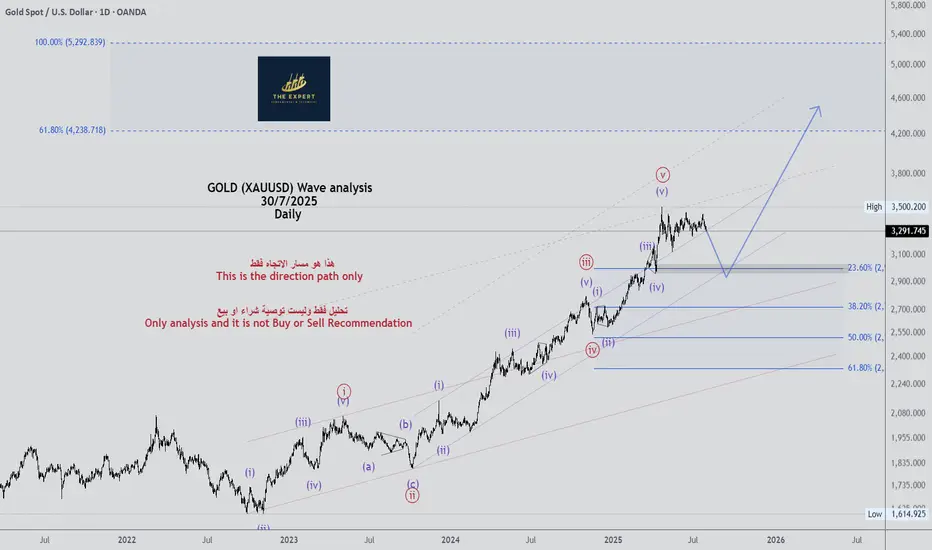
Gold analysis by majidbabaeiasl My predictions for gold in previous years have been quite accurate and calculated. Right now, I think a wave 4 correction, which is a micro-wave, is taking place.

GOLD (XAUUSD) Wave analysis Daily - 30/7/2025GOLD (XAUUSD) Wave analysis Daily - 30/7/2025
see the chart
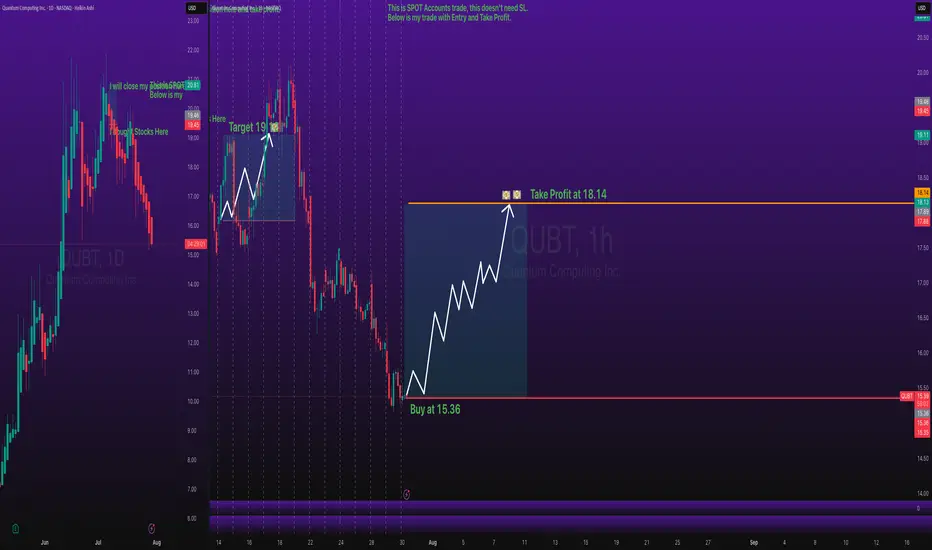
QUBT Stocks BUY Entry with Take Profit Level - Key ZonesStocks SPOT ACCOUNT: NASDAQ:QUBT stocks my buy trade with take profit.
This is my SPOT Accounts for Stocks Portfolio.
Trade shows my Buying and Take Profit Level.
Spot account doesn't need SL because its stocks buying account.
GOLD (XAUUSD) Wave analysis Weekly - 30/7/2025 (Scenario 2)GOLD (XAUUSD) Wave analysis Weekly - 30/7/2025 (Scenario 2)
