CADJPY Trading Opportunity! SELL!
My dear followers,
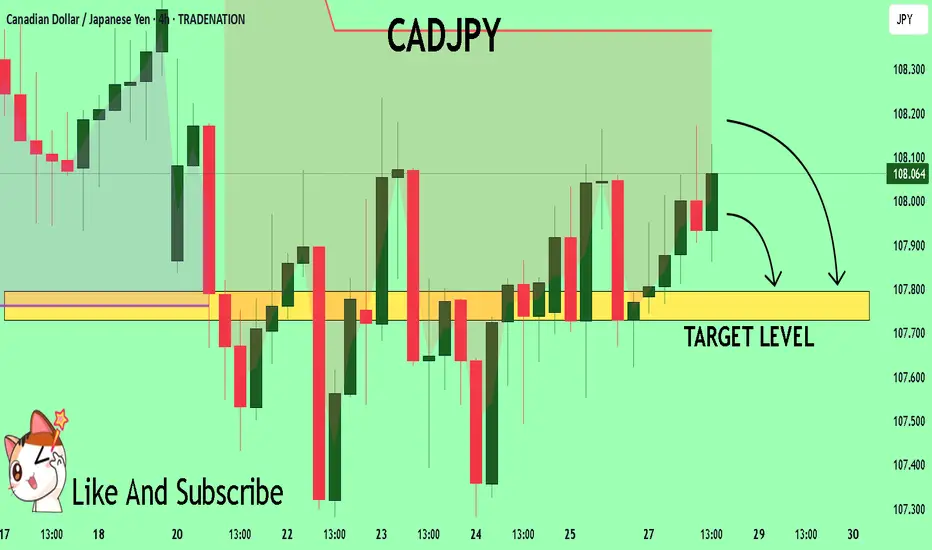
I analysed this chart on CADJPY and concluded the following:
The market is trading on 108.08 pivot level.
Bias - Bearish
Technical Indicators: Both Super Trend & Pivot HL indicate a highly probable Bearish continuation.
Target - 107.79
About Used Indicators:
A super-trend indicator is plotted on either above or below the closing price to signal a buy or sell. The indicator changes color, based on whether or not you should be buying. If the super-trend indicator moves below the closing price, the indicator turns green, and it signals an entry point or points to buy.
Disclosure: I am part of Trade Nation's Influencer program and receive a monthly fee for using their TradingView charts in my analysis.
———————————
WISH YOU ALL LUCK
Wave Analysis
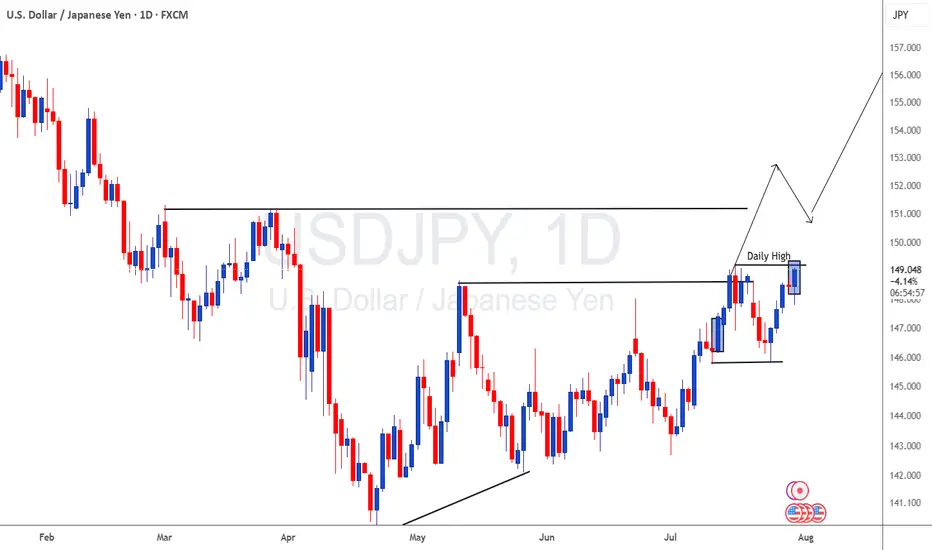
USDJPY A Fall Expected! SELL!
My dear subscribers,
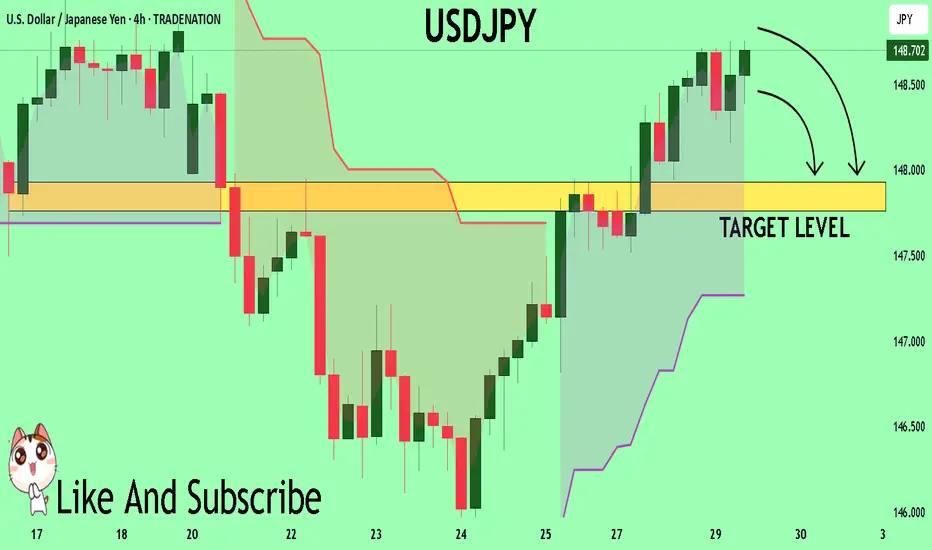
My technical analysis for USDJPY is below:
The price is coiling around a solid key level - 148.71
Bias - Bearish
Technical Indicators: Pivot Points Low anticipates a potential price reversal.
Super trend shows a clear sell, giving a perfect indicators' convergence.
Goal - 147.93
About Used Indicators:
By the very nature of the supertrend indicator, it offers firm support and resistance levels for traders to enter and exit trades. Additionally, it also provides signals for setting stop losses
Disclosure: I am part of Trade Nation's Influencer program and receive a monthly fee for using their TradingView charts in my analysis.
———————————
WISH YOU ALL LUCK
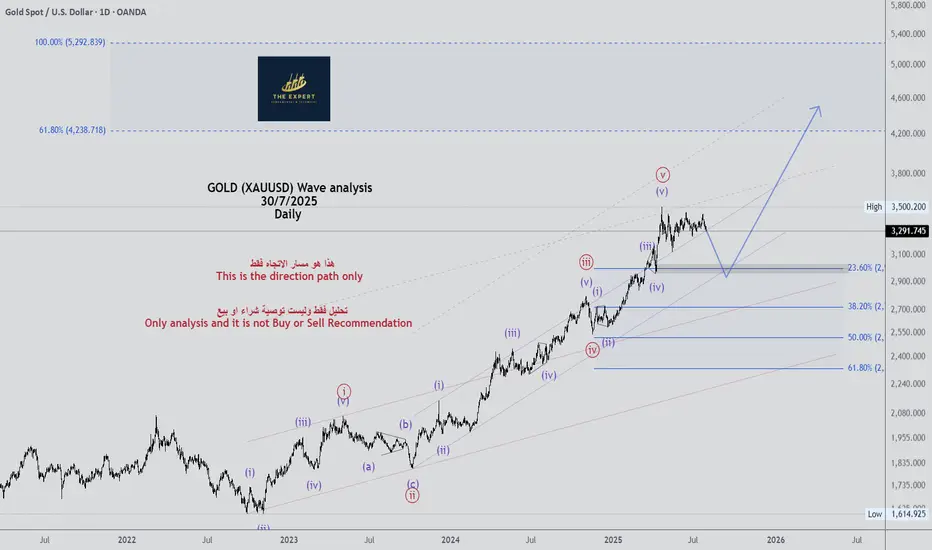
Gold analysis by majidbabaeiasl My predictions for gold in previous years have been quite accurate and calculated. Right now, I think a wave 4 correction, which is a micro-wave, is taking place.

GOLD (XAUUSD) Wave analysis Daily - 30/7/2025GOLD (XAUUSD) Wave analysis Daily - 30/7/2025
see the chart
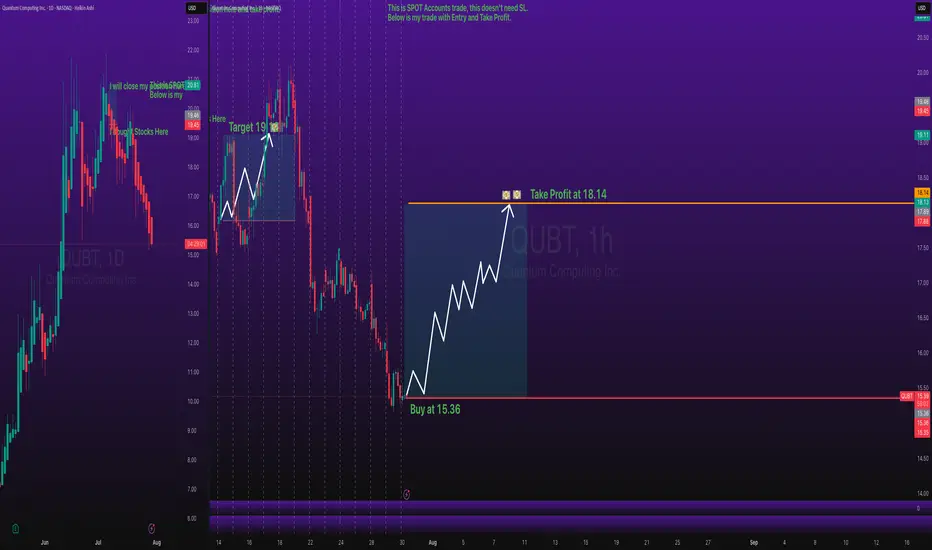
QUBT Stocks BUY Entry with Take Profit Level - Key ZonesStocks SPOT ACCOUNT: NASDAQ:QUBT stocks my buy trade with take profit.
This is my SPOT Accounts for Stocks Portfolio.
Trade shows my Buying and Take Profit Level.
Spot account doesn't need SL because its stocks buying account.
GOLD (XAUUSD) Wave analysis Weekly - 30/7/2025 (Scenario 2)GOLD (XAUUSD) Wave analysis Weekly - 30/7/2025 (Scenario 2)

GOLD (XAUUSD) Wave analysis Weekly - 30/7/2025 (Scenario 1)GOLD (XAUUSD) Wave analysis Weekly - 30/7/2025 (Scenario 1)

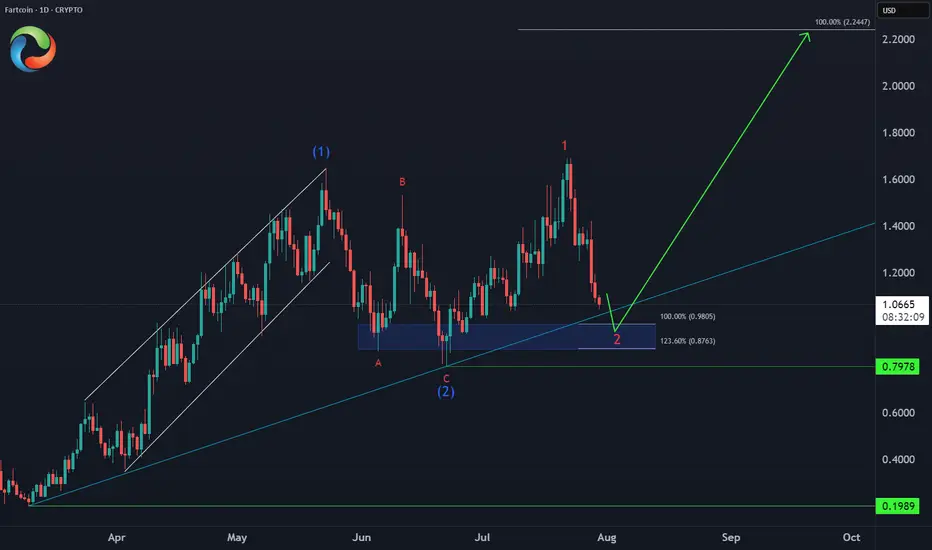
FARTCOIN Bullish Setup 📈 CRYPTO:FARTCOINUSD Entering an extreme buying area:
✅ Key support zone: $0.98-$0.87 (April trendline + equal legs)
⛔ Invalidation: $0.79
🎯 Target: $2.20 (124% upside)
This is how explosive meme setups look before liftoff.
GOLD (XAUUSD) Wave analysis Monthly - 30/7/2025 (Scenario 2)GOLD (XAUUSD) Wave analysis Monthly - 30/7/2025 (Scenario 2)

GOLD (XAUUSD) Wave analysis Monthly - 30/7/2025 (Scenario 1)GOLD (XAUUSD) Wave analysis Monthly Scenario 1 - 30/7/2025

GOLD BUY M15 Gold (XAU/USD) 15-Minute Chart Analysis – July 30, 2025
Price recently broke structure (BOS) to the downside, reaching a key demand zone near the 3293 level, which is marked as a potential weak low. The current analysis suggests a possible bullish reversal from this demand area.
Entry Zone: Price is currently testing the demand zone near 3293-3300.
Stop Loss (SL): Placed at 3293, just below the weak low.
Target (TP): 3339, which aligns with a previous strong high and resistance area.
Intermediate Resistance Levels:
3310.049
3320.396
A bullish structure is expected to form with higher highs and higher lows as price potentially climbs toward the target. The analysis anticipates a breakout from current consolidation and a move toward the upper resistance zone.

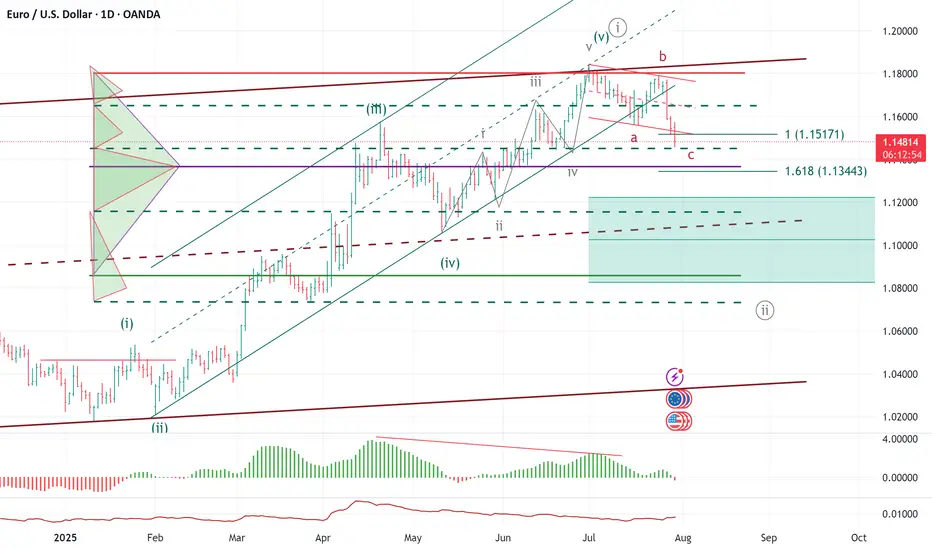
ELLIOTT WAVE EURUSD Daily update
EW Trade Set Up daily
minute ((i)) seems finished
H4 scenario 210725:
the price upward movement from 1.1557 area on 17/07/25 has broken decisively 1.1684-1.1705 area but it had not the
strenght to go further so that the lagging span (green line) could break upward the leading span B (red line).
A decrescent high has been registered at 1.1800 area on 24/07/25.
In this new scenario it looks like that the impulsive movement that started from 1.0180 on 13/01/25
finisced at 1.1834 on 010725 in the minute wave (i). (EWO divergence, break down of the upward (ii)/(iv) channel).
So i have to register that a correction to minute wave ((ii) has started
key levels VP area
1.1800
1.1370 POC
1.0850
note :
monitor the price reaction at any supports level: VP area and LVN
NIKE Confirms A Bullish Reversal With An Impulsive RecoveryWe talked about Nike on July 10 with our members, where we mentioned and highlighted a completed higher degree ABC correction in wave IV on the monthly and weekly charts.
Today we want to represent a closer view, as we see a five-wave impulsive recovery away from the lows on a daily chart. It actually confirms the bottom and bullish reversal, but since it can be trading in 5th wave that can stop around 80-85 area, we should be aware of a three-wave corrective setback soon. It can slow down the price back to the open GAP, so ideal buy zone is in the 70-60 area. Invalidation level is at 52.
Highlights:
Direction: Up, but watch out for a correction
Structure: Impulse, Wave 5 in final stages
Support: 70 / 60

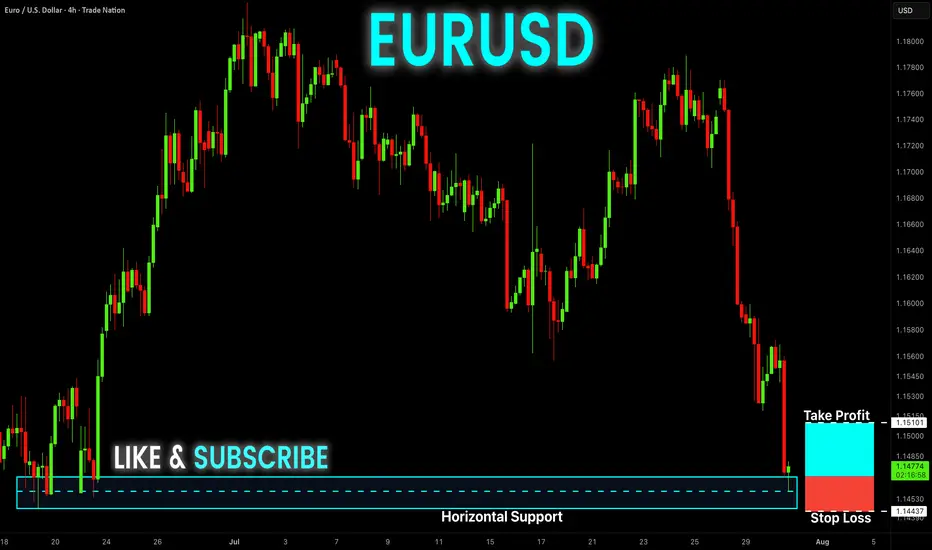
EUR-USD Free Signal! Buy!
Hello,Traders!
EUR-USD keeps falling and
The pair is locally oversold so
As the pair is retesting the
Horizontal support level
Of 1.1468 we can enter a
Long trade with Take Profit
Of 1.1510 and Stop Loss
Of 1.1443
Buy!
Comment and subscribe to help us grow!
Check out other forecasts below too!
Disclosure: I am part of Trade Nation's Influencer program and receive a monthly fee for using their TradingView charts in my analysis.
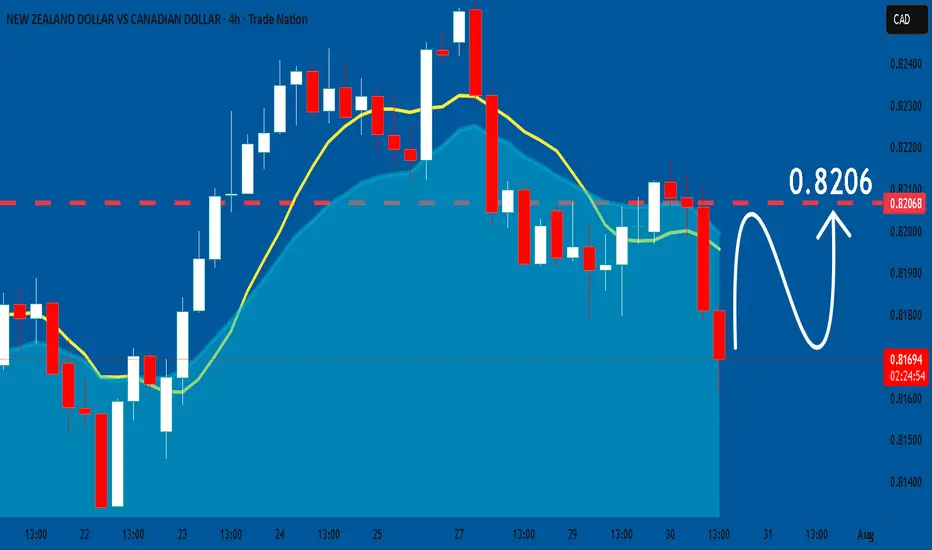
NZDCAD: Bullish Continuation is Expected! Here is Why:
The analysis of the NZDCAD chart clearly shows us that the pair is finally about to go up due to the rising pressure from the buyers.
Disclosure: I am part of Trade Nation's Influencer program and receive a monthly fee for using their TradingView charts in my analysis.
❤️ Please, support our work with like & comment! ❤️
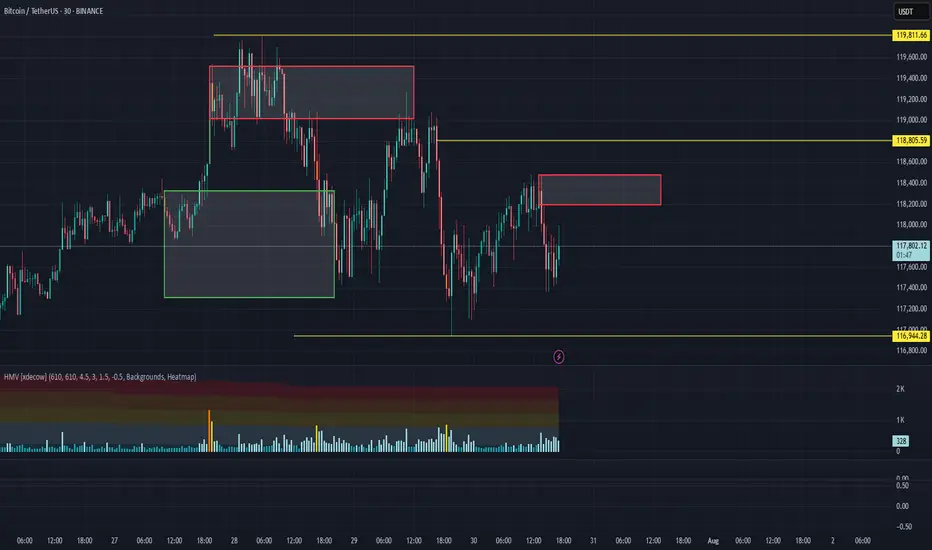
BTC/USDT Analysis — Hidden Buyer
Hello everyone! This is the daily analysis from the CryptoRobotics trading analyst.
Yesterday, Bitcoin continued its move toward the local low and formed a false breakout.
Throughout the decline, we observed a positive delta, which may indicate gradual accumulation of long positions. At the same time, the descending trendline has not yet been broken, and there was strong absorption of market buys around ~$118,400 and ~$118,800 — which makes entering long positions very risky at the moment.
Our main expectations are based on further rotation within the range marked in yesterday’s analysis. In the short term, we are watching for a test of two local zones to assess the reaction from sellers. If the reaction is weak, a test of the upper boundary of the new sideways range is quite possible.
Buy zones:
$116,200–$115,000 (volume anomalies)
$110,000–$107,000 (accumulated volume)
Sell zones:
~$118,400 and ~$118,800 (local resistances)
This publication is not financial advice.
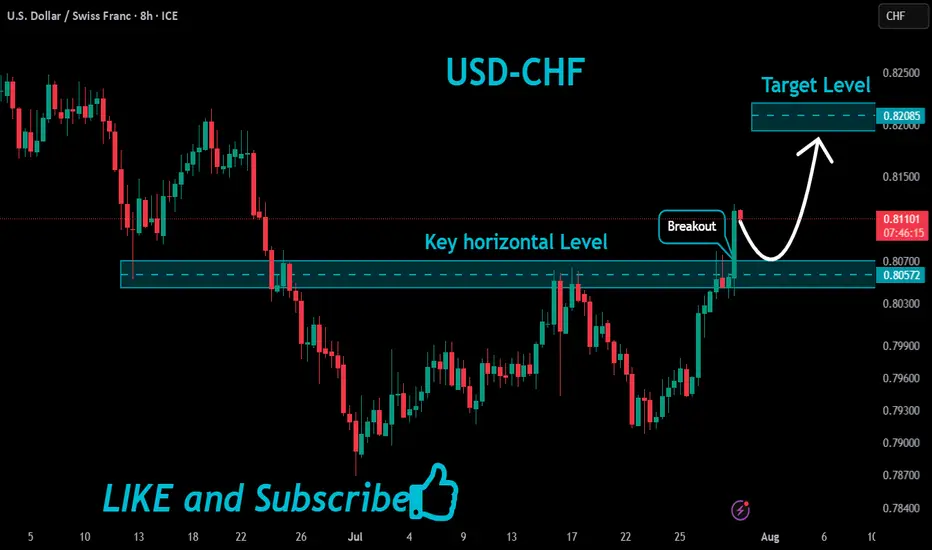
USDCHF Bullish Breakout!
HI,Traders !
#USDCHF is trading in a strong
Uptrend and the price made a
Bullish breakout of the key
Horizontal level of 0.80572
So we are bullish biased
And we will be expecting a
Further bullish move up !
Comment and subscribe to help us grow !
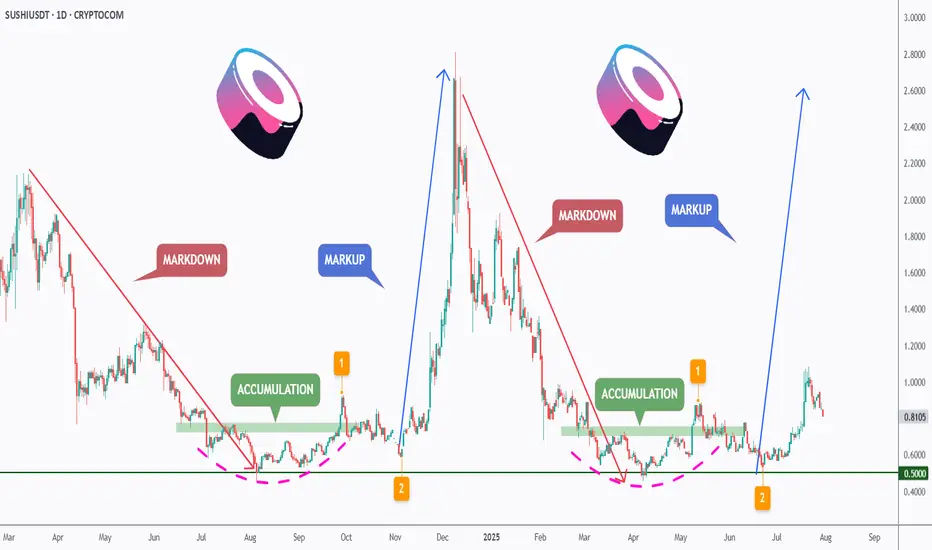
[Deep Dive] SUSHI – Edition 3: Accumulate. Anticipate. Accelerat🧠 Cycle Anatomy: What the Chart Is Telling Us
📉 Phase 1: Markdown
The bears dominated, slicing price downward into key historical support around the $0.50 mark — the same level that anchored the previous accumulation zone.
📦 Phase 2: Accumulation
Both accumulation phases (mid-2023 and Q2 2025) occurred near identical support zones, with rounded bases and sideways chop — signaling strong hands quietly absorbing supply.
📈 Phase 3: Markup Incoming?
Following breakout point “1” and retest point “2,” the current structure aligns remarkably well with the previous markup phase — which propelled SUSHI from ~$0.50 to over $3 in just weeks. While past performance isn’t a guarantee, this fractal deserves attention.
🔥 Why Fundamentals May Support This Move
- SushiSwap v3 continues rolling out on multiple chains, optimizing capital efficiency and fee structure for LPs.
- Governance has stabilized after the rough patches of 2022–2023, with more transparent treasury and development direction.
- Cross-chain expansion and integrations with major aggregators (like 1inch, Matcha, and DeBank) are boosting SUSHI’s visibility in the broader DeFi flow.
Additionally, a surge in TVL and DEX activity on low-fee chains could redirect volume back to SushiSwap — a platform known for its cross-chain capabilities.
📍 What to Watch Next
- A confirmed breakout above $1.00 would validate the “markup” thesis.
- A dip toward the $0.65–$0.70 zone could offer a high-risk/reward entry aligned with point “2.”
- Failure to hold the $0.50 level would invalidate the structure.
For now, the rhythm is clear: markdown → accumulation → markup. And if the pattern holds, SUSHI might just be preparing for its third vertical.
💬 Do you think this is just another fakeout — or is SUSHI gearing up for a DeFi comeback?
🔔 Disclaimer: This post is for educational and informational purposes only. It does not constitute financial advice. Always do your own research and manage risk carefully.
📚 Always follow your trading plan => including entry, risk management, and trade execution.
Good luck!
All strategies are good, if managed properly.
~ Richard Nasr
USDJPY UPSIDE The dollar index (DXY00) on Tuesday rose by +0.22% and posted a 5-week high. The dollar has carryover support from Monday following the EU-US trade deal that is seen as favoring the US. Also, expectations for the Fed to keep interest rates unchanged at the end of Wednesday's 2-day FOMC meeting are supportive of the dollar. The dollar extended its gains after the US Jun advance goods trade deficit unexpectedly shrank, a supportive factor for Q2 GDP, and after July consumer confidence rose more than expected.
GBPUSD DOWNSIDE UPDATE The dollar index (DXY00) on Tuesday rose by +0.22% and posted a 5-week high. The dollar has carryover support from Monday following the EU-US trade deal that is seen as favoring the US. Also, expectations for the Fed to keep interest rates unchanged at the end of Wednesday's 2-day FOMC meeting are supportive of the dollar. The dollar extended its gains after the US Jun advance goods trade deficit unexpectedly shrank, a supportive factor for Q2 GDP, and after July consumer confidence rose more than expected.

EURUSD DOWN SIDE The dollar index (DXY00) on Tuesday rose by +0.22% and posted a 5-week high. The dollar has carryover support from Monday following the EU-US trade deal that is seen as favoring the US. Also, expectations for the Fed to keep interest rates unchanged at the end of Wednesday's 2-day FOMC meeting are supportive of the dollar. The dollar extended its gains after the US Jun advance goods trade deficit unexpectedly shrank, a supportive factor for Q2 GDP, and after July consumer confidence rose more than expected.

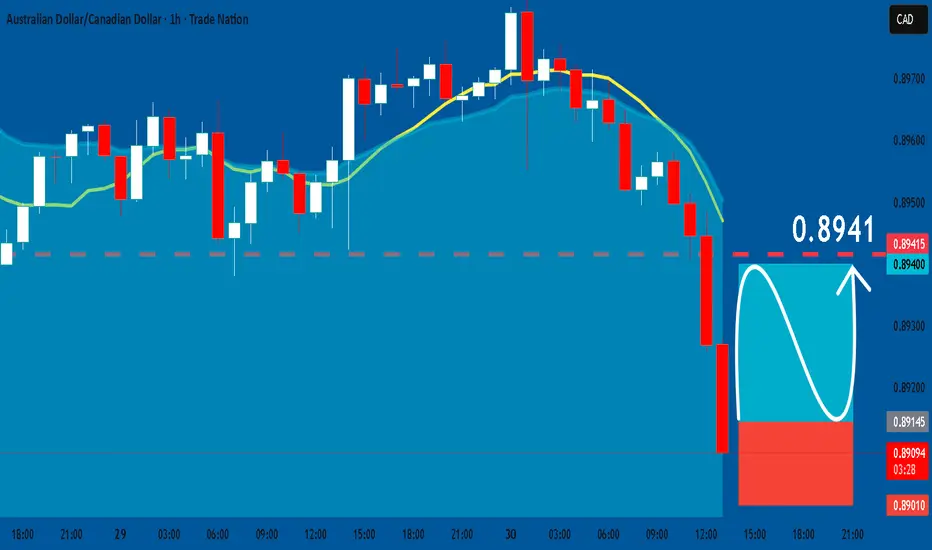
AUDCAD: Long Trade Explained
AUDCAD
- Classic bullish formation
- Our team expects pullback
SUGGESTED TRADE:
Swing Trade
Long AUDCAD
Entry - 0.8914
Sl - 0.8901
Tp - 0.8941
Our Risk - 1%
Start protection of your profits from lower levels
Disclosure: I am part of Trade Nation's Influencer program and receive a monthly fee for using their TradingView charts in my analysis.
❤️ Please, support our work with like & comment! ❤️
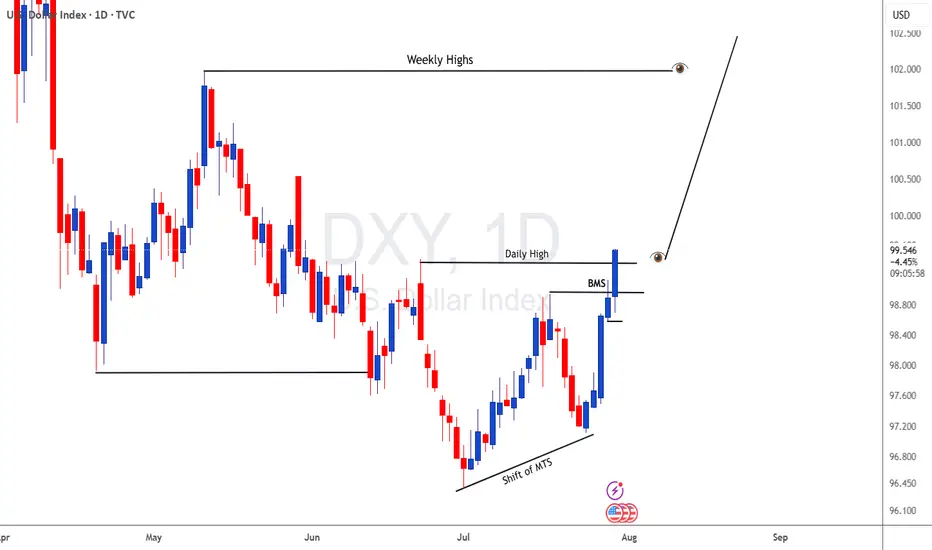
DXY UPDATE FOR LONG as we forecast a long term this an update
The dollar index (DXY00) on Tuesday rose by +0.22% and posted a 5-week high. The dollar has carryover support from Monday following the EU-US trade deal that is seen as favoring the US. Also, expectations for the Fed to keep interest rates unchanged at the end of Wednesday's 2-day FOMC meeting are supportive of the dollar. The dollar extended its gains after the US Jun advance goods trade deficit unexpectedly shrank, a supportive factor for Q2 GDP, and after July consumer confidence rose more than expected.