OIL - Likely development on the 4hr/daily scenarioThis looks like the likely scenario that will now develop on oil on the 4hr/daily timeframe.
In other words, we will look for an upside from now on first, back to the 0.618 re-tracement of the huge downside impulse that occurred in the last week of June.
So all buy setups we will be able to take until price hits the $72 area, then we will start looking for sells.
Wave Analysis

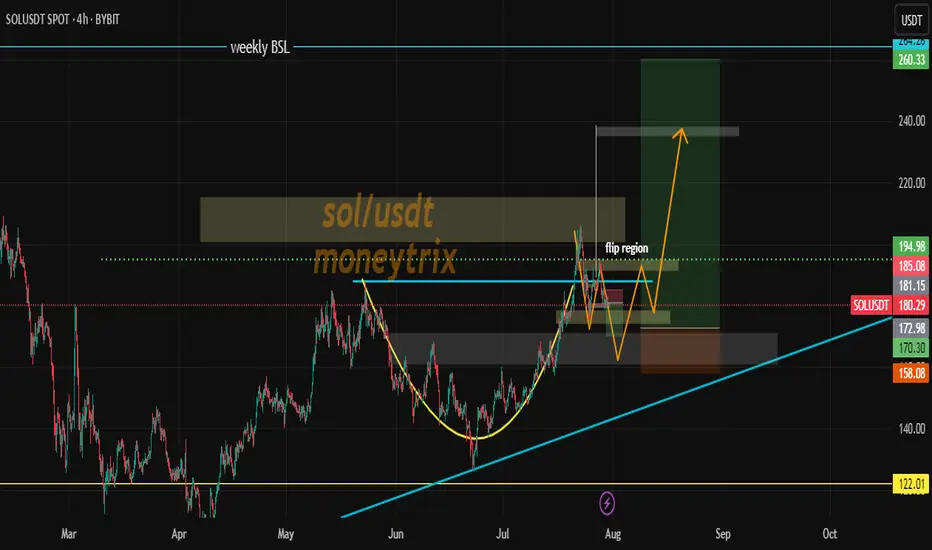
Short-Term "Counter-Short" Position A "counter-short" strategy, Short-Term "Counter-Short" Position
A "counter-short" strategy, also known as counter-trend trading, involves taking a short position against the prevailing short-term trend, anticipating a temporary reversal or correction. This is generally a high-risk, high-reward strategy that requires precise timing and strong risk management.
Long-term long positions on SOL/USDT with a cup and handle pattern aim for substantial gains after a period of consolidation. This strategy relies on identifying a well-formed bullish continuation pattern on higher timeframes, confirmed by volume, to indicate a strong upward trajectory for Solana. till previous ATH
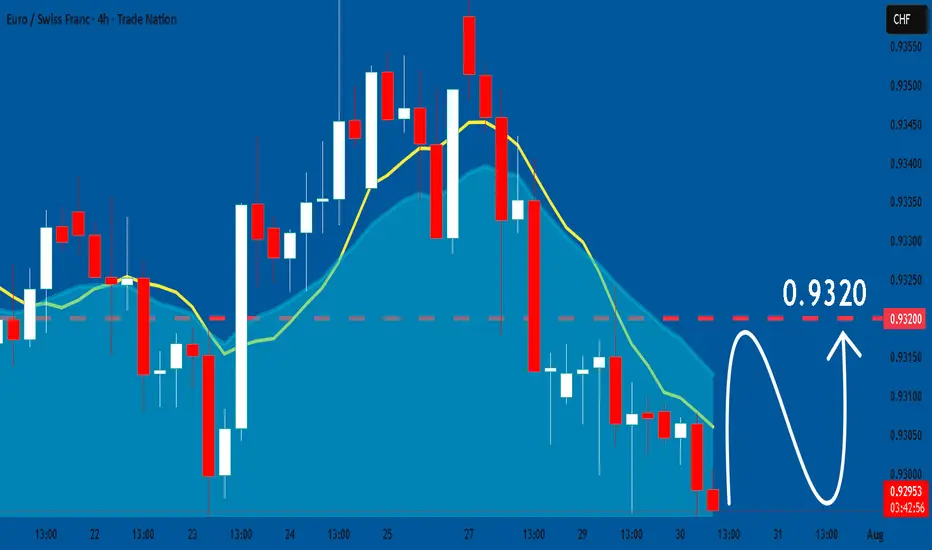
EURCHF: Market of Buyers
Looking at the chart of EURCHF right now we are seeing some interesting price action on the lower timeframes. Thus a local move up seems to be quite likely.
Disclosure: I am part of Trade Nation's Influencer program and receive a monthly fee for using their TradingView charts in my analysis.
❤️ Please, support our work with like & comment! ❤️
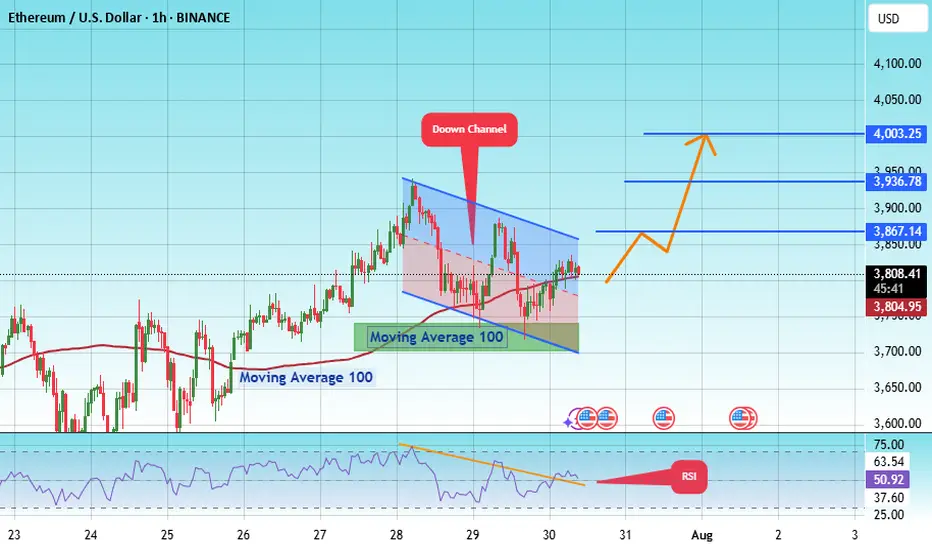
#ETH/USDT SETUP ,Bought From $4003#ETH
The price is moving within an ascending channel on the 1-hour frame, adhering well to it, and is on track to break it strongly upwards and retest it.
We have support from the lower boundary of the ascending channel, at 3700.
We have a downtrend on the RSI indicator that is about to break and retest, supporting the upside.
There is a major support area in green at 3711, which represents a strong basis for the upside.
Don't forget a simple thing: ease and capital.
When you reach the first target, save some money and then change your stop-loss order to an entry order.
For inquiries, please leave a comment.
We have a trend to hold above the 100 Moving Average.
Entry price: 3811.
First target: 3867.
Second target: 3936.
Third target: 4003.
Don't forget a simple thing: ease and capital.
When you reach your first target, save some money and then change your stop-loss order to an entry order.
For inquiries, please leave a comment.
Thank you.
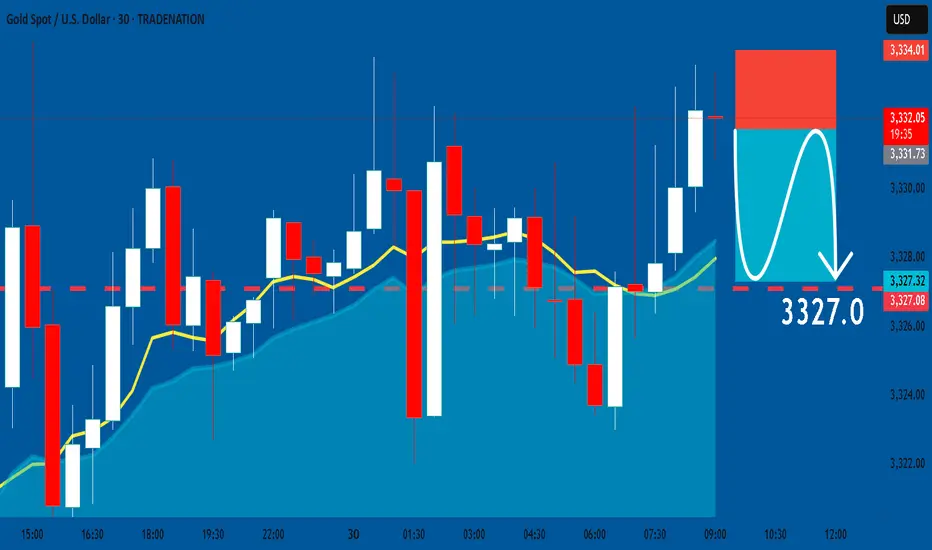
GOLD: Bearish Continuation & Short Trade
GOLD
- Classic bearish pattern
- Our team expects retracement
SUGGESTED TRADE:
Swing Trade
Sell GOLD
Entry - 3331.7
Stop - 3334.0
Take - 3327.0
Our Risk - 1%
Start protection of your profits from lower levels
Disclosure: I am part of Trade Nation's Influencer program and receive a monthly fee for using their TradingView charts in my analysis.
❤️ Please, support our work with like & comment! ❤️
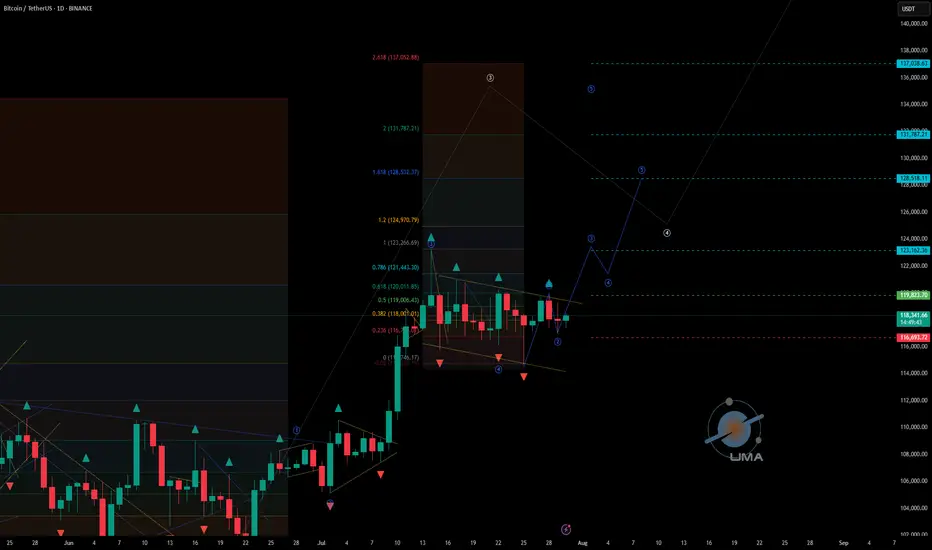
BTCUSDT - UniverseMetta - Signal#BTCUSDT - UniverseMetta - Signal
D1 - Formation of potential 3rd wave from the level in continuation of the 5th wave on W1. Stop behind the maximum of the 2nd wave.
Entry: 119823.70
TP: 123162.36 - 128518.11 - 131787.21 - 137038.63
Stop: 116693.72
AUDNZD Technical + Fundamental Align for DownsideToday I want to analyze a short position on the AUDNZD ( OANDA:AUDNZD ) pair, first, let's look at it from a fundamental analysis perspective .
Fundamental View on AUDNZD
Key reasons to short AUDNZD:
Australian weakness:
Recent data show weakening consumer sentiment and declining building approvals. The RBA seems hesitant to hike further, putting pressure on the Aussie.
New Zealand resilience:
The RBNZ maintains a relatively hawkish stance. Inflation is still a concern, and the central bank is committed to keeping rates high, supporting NZD strength.
Monetary policy divergence:
The divergence between RBA’s dovish stance and RBNZ’s hawkish approach supports further downside in AUDNZD.
----------------------
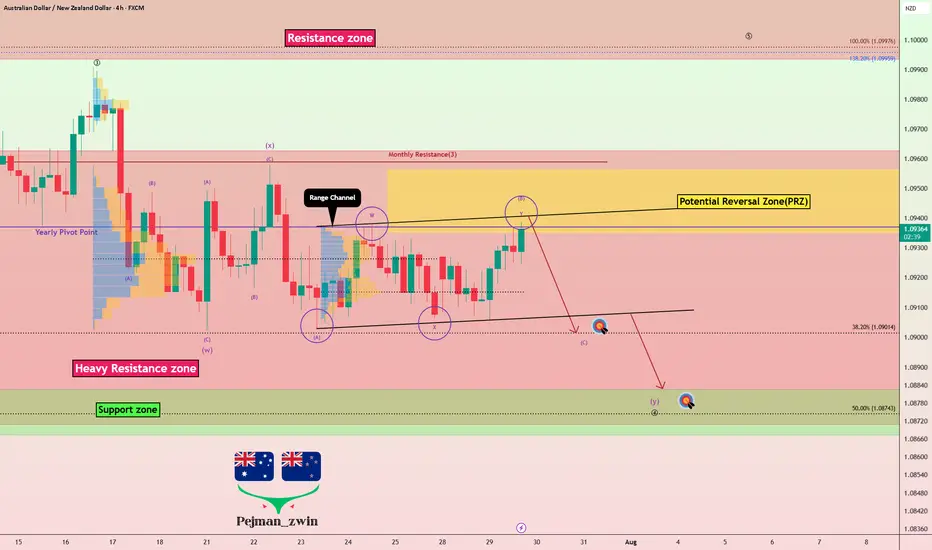
Now let's take a look at AUDNZD from a technical analysis perspective on the 4-hour timeframe .
AUDNZD is currently trading in a Heavy Resistance zone(1.0963 NZD-1.0870 NZD) near the upper line of the Range Channel , Potential Reversal Zone(PRZ) and Yearly Pivot Point .
In terms of Elliott Wave theory , AUDNZD appears to be completing microwave B of microwave Y of the main wave 4 .
I expect AUDNZD to drop to at least 1.0904 NZD(First Target) based on the above explanation .
Second Target: 1.0886 NZD
Note: Stop Loss(SL): 1.0963 NZD
Please respect each other's ideas and express them politely if you agree or disagree.
Australian Dollar/New Zealand Dollar Analyze (AUDNZD), 4-hour time frame.
Be sure to follow the updated ideas.
Do not forget to put a Stop loss for your positions (For every position you want to open).
Please follow your strategy and updates; this is just my Idea, and I will gladly see your ideas in this post.
Please do not forget the ✅' like '✅ button 🙏😊 & Share it with your friends; thanks, and Trade safe.
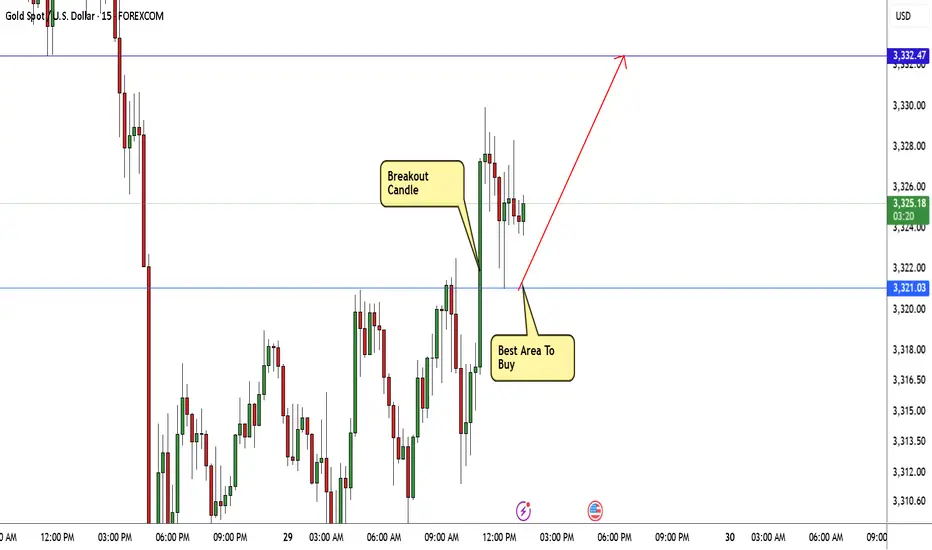
GOLD Breakout Done , Long Setup Valid To With Great ProfitHere is My 15 Mins Gold Chart , and here is my opinion , we finally above 3321.00 and we have a 15 Mins Candle closure above this strong res , so I'm waiting the price to go back and retest this res and new support and give me a good bullish price action to can enter a buy trade , and if we have a 4H Closure Above This res this will increase the reasons for buyers , just wait the price to back a little to retest it and then we can buy it . if we have a daily closure below it this idea will not be valid anymore .
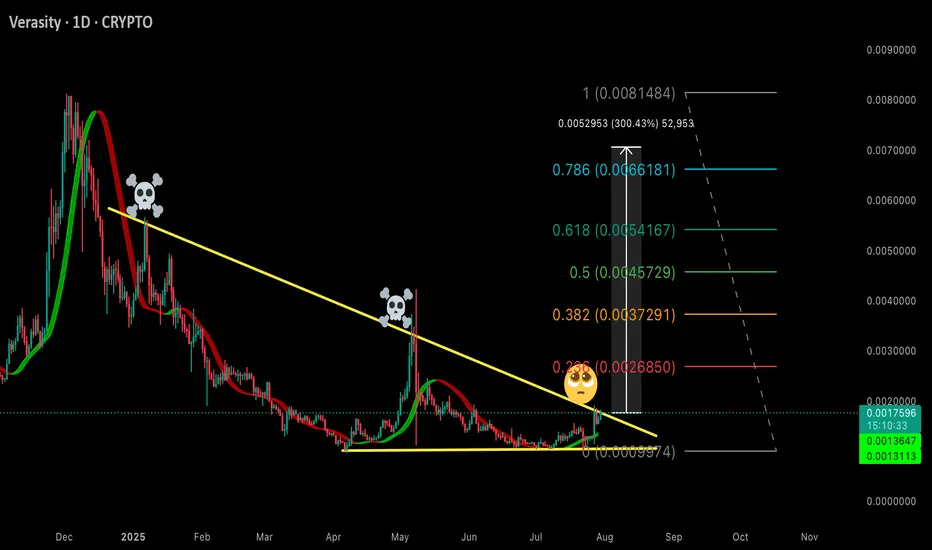
$VRANASDAQ:VRA on daily time frame non logarithmic chart pattern is showing sign of break out. are we going to break. lets wait and find out
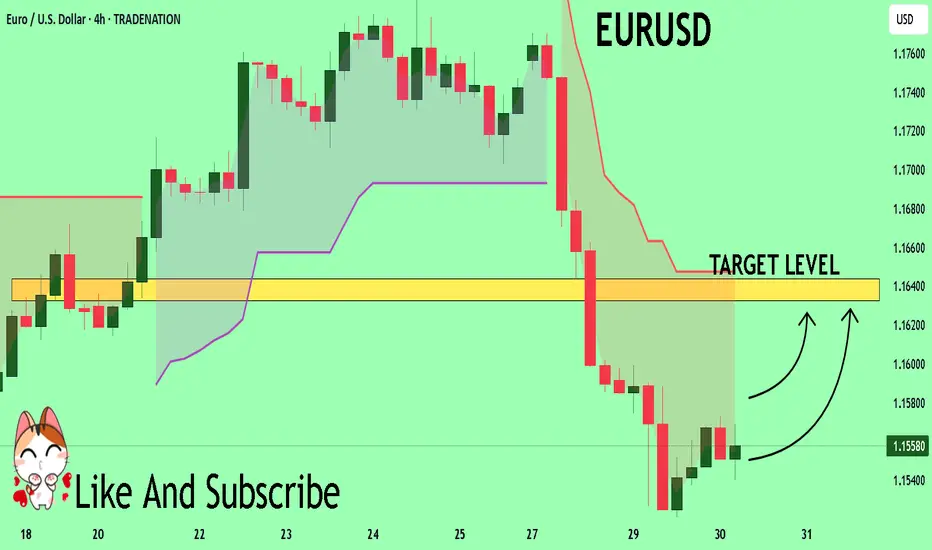
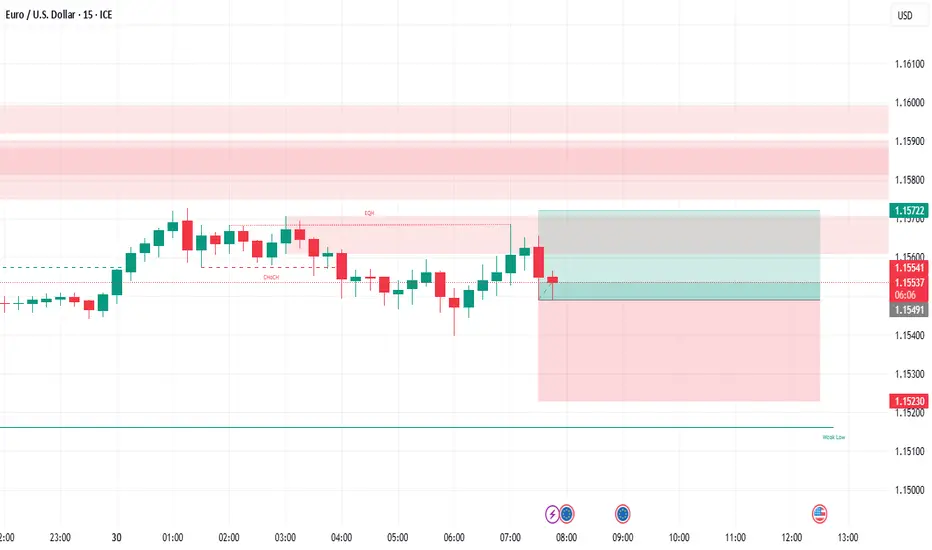
EURUSD Set To Grow! BUY!
My dear followers,
This is my opinion on the EURUSD next move:
The asset is approaching an important pivot point 1.1557
Bias - Bullish
Technical Indicators: Supper Trend generates a clear long signal while Pivot Point HL is currently determining the overall Bullish trend of the market.
Goal - 1.1632
About Used Indicators:
For more efficient signals, super-trend is used in combination with other indicators like Pivot Points.
Disclosure: I am part of Trade Nation's Influencer program and receive a monthly fee for using their TradingView charts in my analysis.
———————————
WISH YOU ALL LUCK
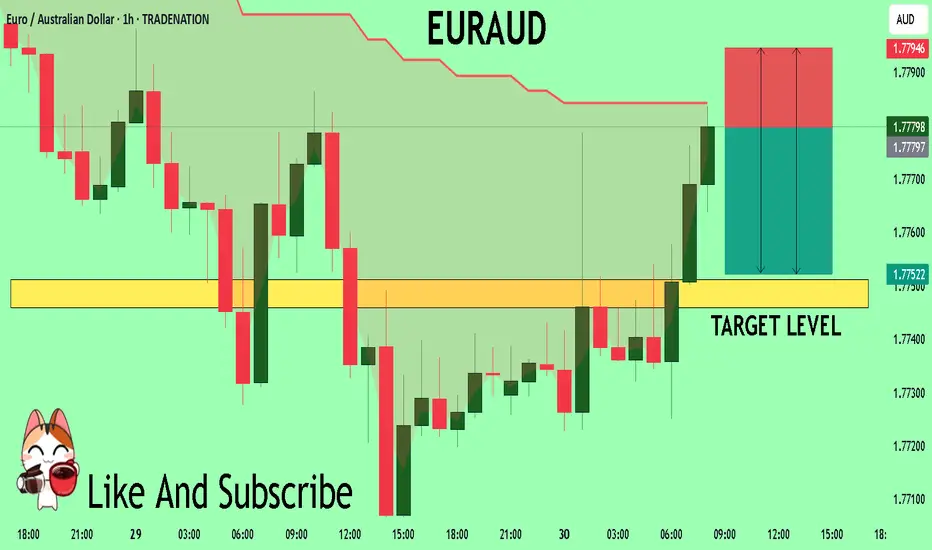
EURAUD Under Pressure! SELL!
My dear followers,
I analysed this chart on EURAUD and concluded the following:
The market is trading on 1.7780 pivot level.
Bias - Bearish
Technical Indicators: Both Super Trend & Pivot HL indicate a highly probable Bearish continuation.
Target - 1.7751
Safe Stop Loss - 1.7794
About Used Indicators:
A super-trend indicator is plotted on either above or below the closing price to signal a buy or sell. The indicator changes color, based on whether or not you should be buying. If the super-trend indicator moves below the closing price, the indicator turns green, and it signals an entry point or points to buy.
Disclosure: I am part of Trade Nation's Influencer program and receive a monthly fee for using their TradingView charts in my analysis.
———————————
WISH YOU ALL LUCK
#XAI/USDT breakout Buy breakout,#XAI
The price is moving within an ascending channel on the 1-hour frame, adhering well to it, and is on its way to breaking strongly upwards and retesting it.
We have support from the lower boundary of the ascending channel, at 0.0511.
We have a downtrend on the RSI indicator that is about to break and retest, supporting the upside.
There is a major support area in green at 0.0513, which represents a strong basis for the upside.
Don't forget a simple thing: ease and capital.
When you reach the first target, save some money and then change your stop-loss order to an entry order.
For inquiries, please leave a comment.
We have a trend to hold above the 100 Moving Average.
Entry price: 0.0591.
First target: 0.0547.
Second target: 0.0568.
Third target: 0.0591.
Don't forget a simple thing: ease and capital.
When you reach your first target, save some money and then change your stop-loss order to an entry order.
For inquiries, please leave a comment.
Thank you.

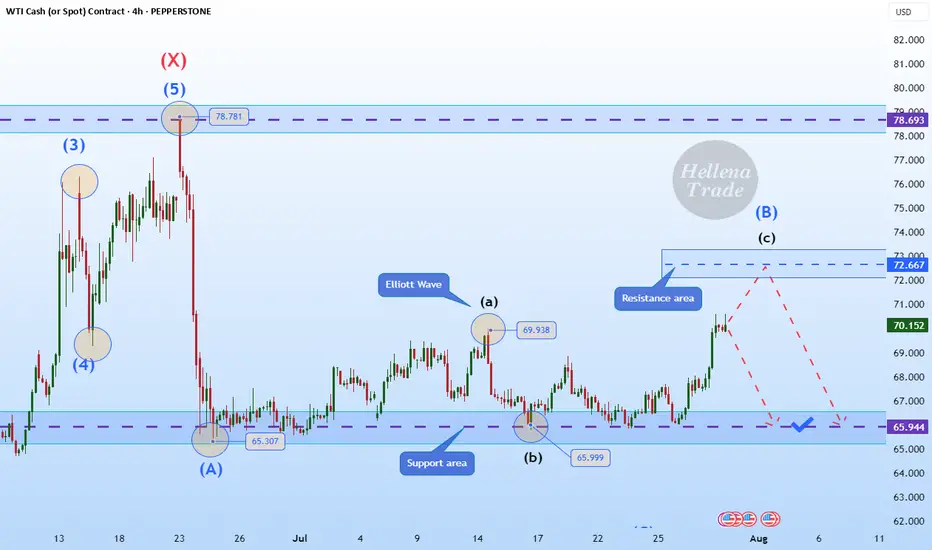
Hellena | Oil (4H): SHORT to support area of 65.944.Colleagues, I previously recommended moving trades to break-even, and for good reason. It is always necessary to hedge and reduce losses—this is part of professional work.
(Breakeven=Risk Free: Move Stop loss to the entry level).
The price has nevertheless shown a stronger correction, and I now believe that the medium-term “ABC” waves have not yet formed, nor has the large “Y” wave.
This means that I expect the completion of wave “B” and then a continuation of the downward movement in wave “C.”
I consider the support area of 65.944 to be the minimum target.
Manage your capital correctly and competently! Only enter trades based on reliable patterns!
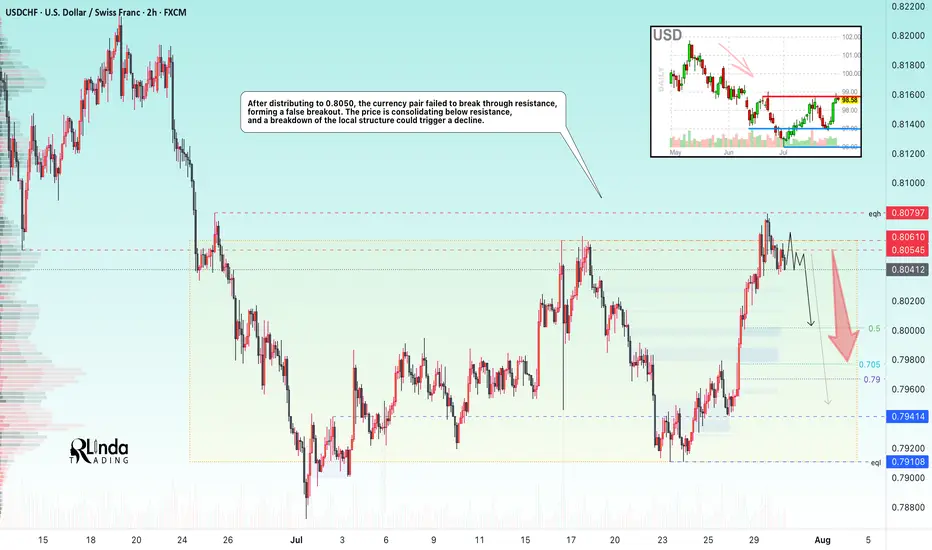
USDCHF → The resistance retest ended with a false breakoutFX:USDCHF tested resistance at 0.805 - 0.806 and formed a false breakout without the possibility of continuing growth. The global trend is downward...
Against the backdrop of the dollar's growth (reaction to news), the currency pair also moved to distribution to 0.8050. The price failed to break through resistance, forming a false breakout. USDCHF is consolidating below resistance, and a breakdown of the local structure could trigger a decline.
The dollar index is also facing fairly strong resistance and may continue its downward trend, which will also affect the decline in the USDCHF price.
Resistance levels: 0.805, 0.806, 0.81
Support levels: 0.800, 0.794, 0.791
If, within the current consolidation, the price begins to fall and break the local structure, then we can expect the decline to continue towards the specified targets!
Best regards, R. Linda!
DXY Rebound Pulls EURUSD Below 1.16Following the DXY’s significant rebound off a 17-year trendline, the EURUSD has broken below a trendline that connected all consecutive lows of 2025. This opens the door to further bearish risks, with key support levels now in sight.
If the pair closes cleanly below 1.15, 1.1440 and 1.1380, downside extensions could reach 1.12 and 1.11, respectively.
On the upside, a close back above the 2025 trendline and the 1.18 mark could reinstate bullish momentum, potentially lifting the pair toward the 2021 highs between 1.20 and 1.23.
Written by Razan Hilal, CMT
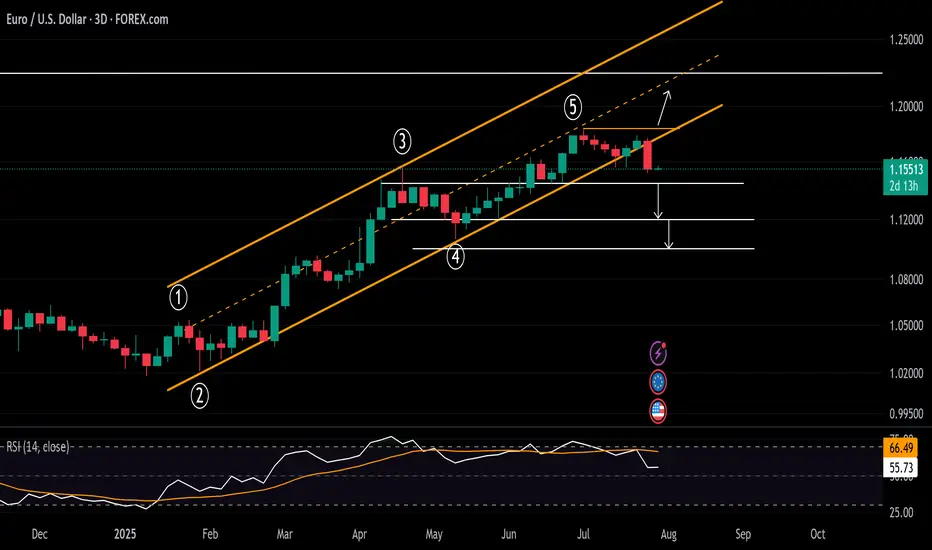
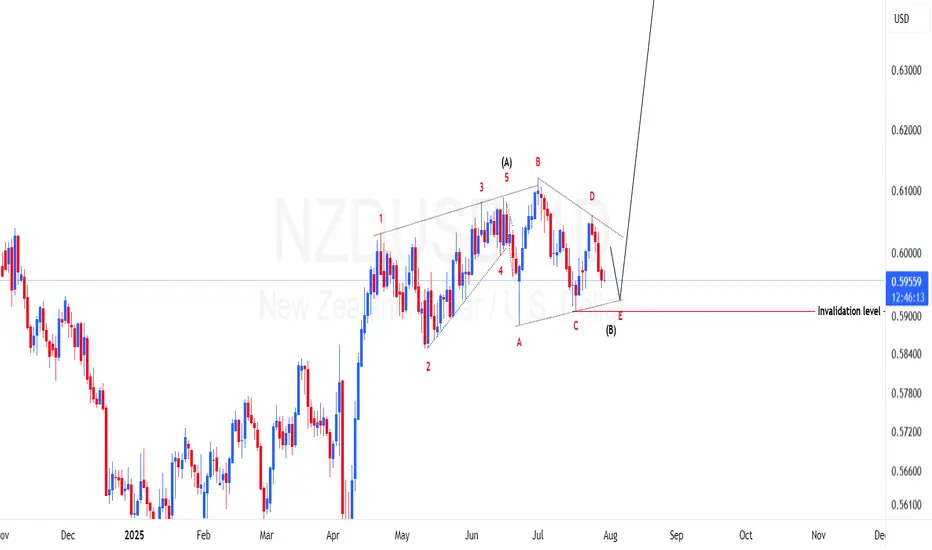
NZDUSD potential 600 pips in makingPrice of NZDUSD have made a structure that has a high probability to be a triangle just after a leading diagonal. If this view is favored then we should expect price to regain its bullish momentum to make wave C. To take advantage of this possibility a trade should find areas of support to go long. One of the places is as marked on the chart on lower trendline of the triangle.
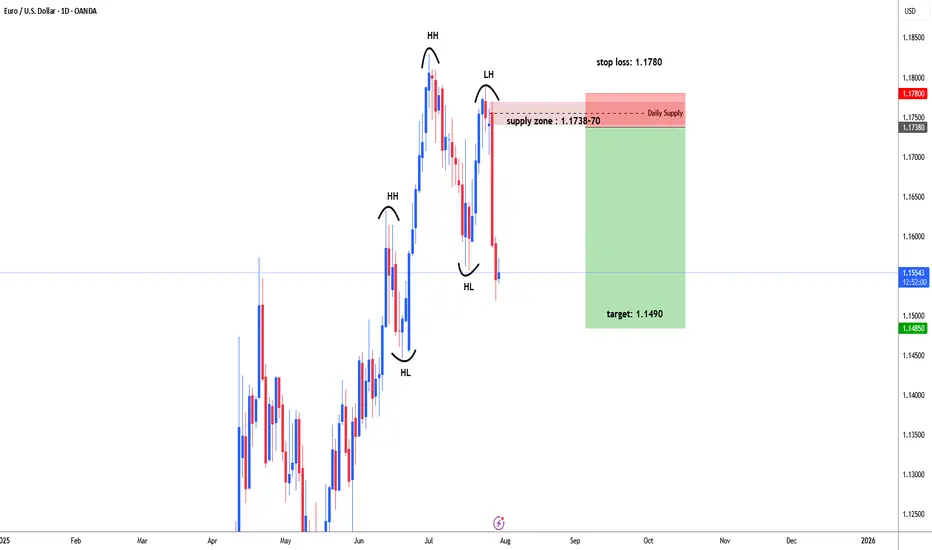
EURUSD possible bearish for 1.1490#EURUSD failed to form higher high and higher low to continue bullish trend. eurusd made a high on 1st July 1.1830, then price started retrace downside. 7th July daily bearish engulfing candle formed , early indication for selling. 23rd July price moved up side to test supply zone. Price did not break high of bearish engulfing candle and fall back. Price started heavily fall and broke recent supply level 1.1557 and form Lower High that is indication for trend reversal.
1.1738-70 ideal level for selling which is daily supply zone. stop loss above 1.1770 i.e. 1780-1.1800. target: 1.1490 and even may expect further down.
Bitcoin (BTCUSDT) - Possible Completion of a Complex CorrectionTimeframe: 4H + 1H
Methodology: NeoWave (Glen Neely) + Smart Money Concepts (ICT/SMC)
Posted by: @CryptoPilot
⸻
🧠 NeoWave Analysis: Complex Correction Ending?
From a NeoWave perspective, BTC seems to be in the final stages of a Complex Correction that started in March 2025 from ~72k. The upward move appears to form a Contracting Diametric structure (7 legs: A–B–C–D–E–F–G), with the current leg G potentially unfolding now.
• ✅ Wave A: Sharp recovery from March lows
• ✅ Waves B–F: Alternating corrective legs with varied time and complexity
• 🔄 Wave G: Could be starting now, expected to break structure to the downside
This suggests that the entire move from March till now may represent a large Wave B, setting the stage for a deeper Wave C down.
⸻
🔍 Price Action + Smart Money Confluence
The following observations strengthen the NeoWave scenario:
• 🟨 Liquidity Pools above 120k were swept recently, creating a potential Buy-side Liquidity Grab
• 🟥 Imbalance/FVGs below 114.5k remain unfilled
• 🔻 Market Structure Shift (MSS) evident on 1H chart — lower highs forming
• 🧠 Price rejected from a key Supply Zone, aligning with end of Wave F
• 🟩 If price re-tests the internal bearish OB (near 119.5k–120k), it may provide an ideal short trigger
⸻
📌 Key Levels to Watch:
Level
Description
120.2k
Liquidity sweep zone / MSS confirmed
118k
Current structure base (pivot)
114.5k
FVG + potential Wave G target
111–112k
Strong demand zone (accumulation support)
🧭 Scenario Outlook:
Primary:
→ Price is in Wave G of a Diametric (NeoWave)
→ Likely to unfold as a 3-leg Zigzag down or a Complex combination
→ Objective: break below Wave E low and target the unmitigated imbalances
Alternative:
→ Extended Flat or Triangle, if 120.5k is broken impulsively
→ Invalidation = clean break and hold above 121k
⸻
⚠️ Risk Note:
This analysis assumes Wave G is beginning. If bulls manage to reclaim 120.5k with momentum and close above, the bearish structure will be invalidated.
⸻
💬 Final Thought:
We are potentially nearing the end of a complex corrective rally. The confluence of NeoWave structural symmetry, Smart Money traps, and market inefficiencies suggests that BTC may be preparing for a retracement. Stay alert for confirmations before executing.
⸻
📌 Follow @CryptoPilot for advanced wave structure updates, market geometry insights, and ICT-style smart money traps.
💬 Share your views or alternate wave counts in the comments!

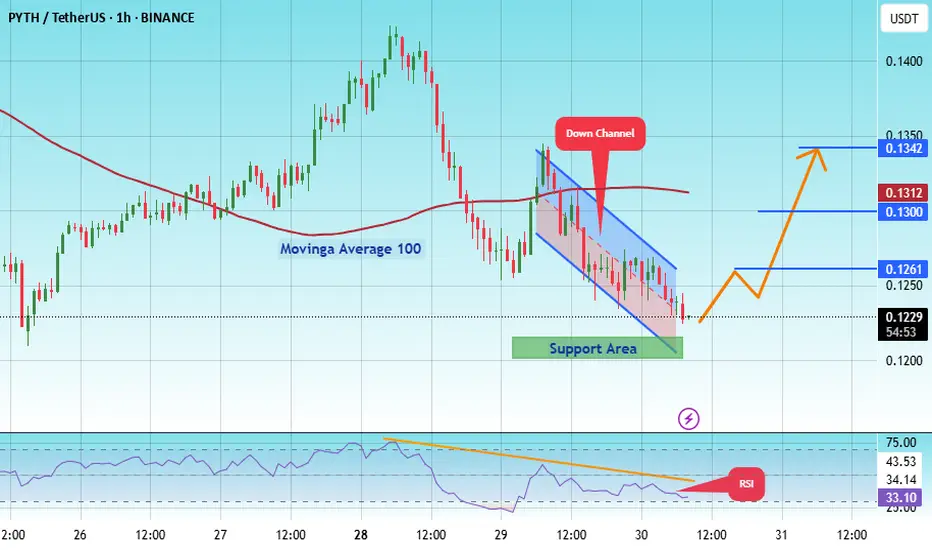
#PYTH/USDT#PYTH
The price is moving within an ascending channel on the 1-hour frame, adhering well to it, and is on track to break it strongly upwards and retest it.
We have support from the lower boundary of the ascending channel, at 1215.
We have a downtrend on the RSI indicator that is about to break and retest, supporting the upside.
There is a major support area in green at 0.1200, which represents a strong basis for the upside.
Don't forget a simple thing: ease and capital.
When you reach the first target, save some money and then change your stop-loss order to an entry order.
For inquiries, please leave a comment.
We have a trend to hold above the 100 Moving Average.
Entry price: 0.1230
First target: 0.1261
Second target: 0.1300
Third target: 0.1342
Don't forget a simple thing: ease and capital.
When you reach your first target, save some money and then change your stop-loss order to an entry order.
For inquiries, please leave a comment.
Thank you.
Gold Eyes Breakout From 3-Month Consolidation After reaching its record high of 3500 in April 2025, Gold entered a contracting consolidation phase for more than 3 months now, bounded between the 3500 resistance and 3100 support. This structure sets the stage for a breakout, with price action tracing five waves—raising the probability of another leg higher.
• Bullish Scenario: A close above the 3450 level could open the door to 3780 and even 4000, aligning with the broader monthly cup-and-handle formation target.
• Bearish Scenario: A close below 3300 could expose the market to downside risks, with potential retracements to 3280, 3250, 3200, and 3130.
Written by Razan Hilal, CMT

EurUsd Going Bullish 20 to 30 pipsEur usd now buy mode 20 to 30 pips .
If anyone wanted to learn this System Analysis contrect with me .
DXY Surge Pressures Currency Market in Volatile Market WeekThe US Dollar Index (DXY) has held its rebound off historical support zones on both the price chart and the RSI indicator throughout July. The monthly RSI is bouncing off a support line extending between the troughs of 2008 and 2020. Meanwhile, price action is rebounding from a support trendline that connects the lows of 2008, 2014, and 2021, within the 96–94 zone.
Bearish Scenario: A solid close below this support zone may confirm a long-term bearish signal, potentially pushing the index toward the 94 and 90 levels.
Bullish Scenario: A confident move above 100 and 103 could signal a reversal in the currency market, potentially leading the DXY back toward the mid-range of the long-standing channel between 105 and 107, originating from the 2008 lows.
Written by Razan Hilal, CMT

Hbar to 0.236 fib for backtest?@Dogg561 Hii
Here an update,
Hbar did a beautifull 5 move up. After this its likely it wil make an abc correction. For now just need to see a pull down for the wave A (doesnt matter where it goes), after that it needs to make a Wave B (also doesnt matter where it goes) Afther those 2 waves (A&B) you just want to count 5 waves down for the wave C (i drew 3 possible scenarios). If you put your fib tool over the complete 5 waves then you can see a super beautifull backtest on the top op wave 1 at the 0.15370 level. For now patient and wait until you see a finished abc correction to jump in again. The macro target would be 3.69 level.
