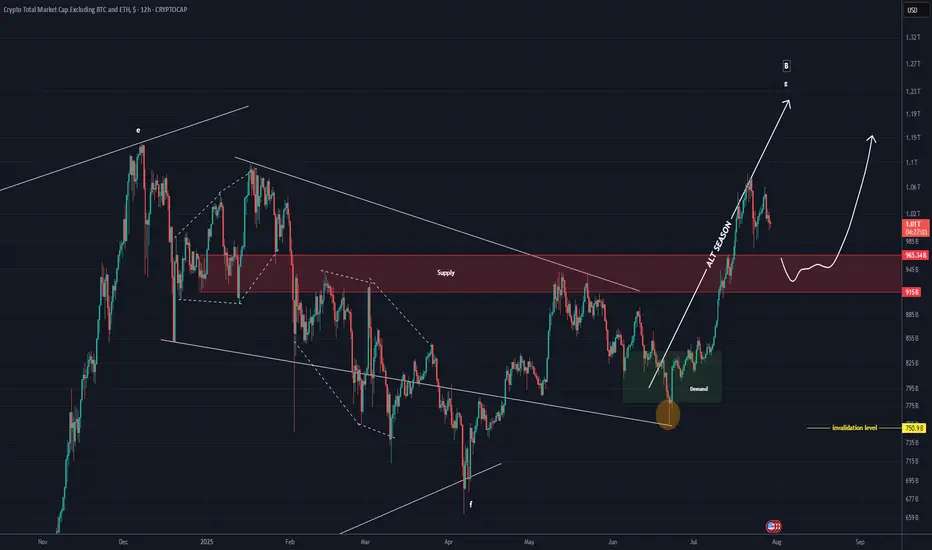
TOTAL 3 New Update (12H)This analysis is an update of the analysis you see in the "Related publications" section
This index has broken below the red zone; if a pullback to this area occurs, it may act as support again and the index could move upward
For risk management, please don't forget stop loss and capital management
Comment if you have any questions
Thank You
Wave Analysis
[XAUUSD – Intraday Price Action Outlook | 30 July 2025Gold (XAUUSD) is currently trading around 3,329 USD and is consolidating within a narrow rising channel after completing a significant downtrend. The market is showing signs of a potential breakout, either to continue a short-term bullish correction or resume the dominant bearish momentum.
Key Technical Zones:
Resistance zone: 3,339.2 – 3,348
This is a critical zone where bullish breakout confirmation is likely to attract momentum buyers. The zone aligns with upper trendline resistance and previous consolidation highs.
Support zone: 3,325.6 – 3,292.7
This range acts as a short-term support base, marked by multiple rejections and aligned with the lower boundary of the current rising wedge formation. A breakdown here could trigger strong bearish continuation.
Indicators & Confluences:
EMA200 (blue): Acting as dynamic resistance, slightly above current price.
EMA50 & EMA100: Compressing toward current price action, indicating price equilibrium and coiling volatility.
RSI (not shown): Likely hovering near 50 – signaling market indecision.
Fibonacci 0.874 has been tagged – often a zone where false breakouts or liquidity grabs occur, demanding caution.
Trading Strategy Suggestions:
Bullish Scenario (Breakout Strategy)
Entry: Buy only if price closes above 3,339.2 (confirmed breakout of wedge).
Stop-loss: Below 3,328.1 (previous supply turned demand).
Target: 3,370 – 3,392 zone (aligned with EMA200 breakout & prior structure).
Note: This setup relies on confirmation and should not be anticipated early. Wait for candle close above 3,339.2 to invalidate current wedge structure.
Bearish Scenario (Rejection & Breakdown Strategy)
Entry: Sell if price rejects 3,330–3,332 area and returns below 3,327.80 (as marked).
Stop-loss: Above 3,332.04 (above trendline and EMA cross).
Target: 3,292.74 (volume node + base of channel).
Risk/Reward: >7.0 (based on current tool parameters shown in chart).
This is a favorable setup if price respects current wedge resistance and fails to breakout convincingly.
Conclusion:
Gold is at a decisive point. The formation of a rising wedge in a prior downtrend signals potential bearish continuation, but a breakout above 3,339.2 could trigger a reversal short-term. Both bulls and bears need confirmation before entering. Monitor volume closely — rising volume on breakout/breakdown will validate either scenario.

20250730-XAUUSD IdeaSupport was found at the key level of 3310. The ADP report is scheduled to be announced at 8:15 p.m. today. Monitoring whether the price continues to break lower or begins an ABC retracement following the strong downward impulse.

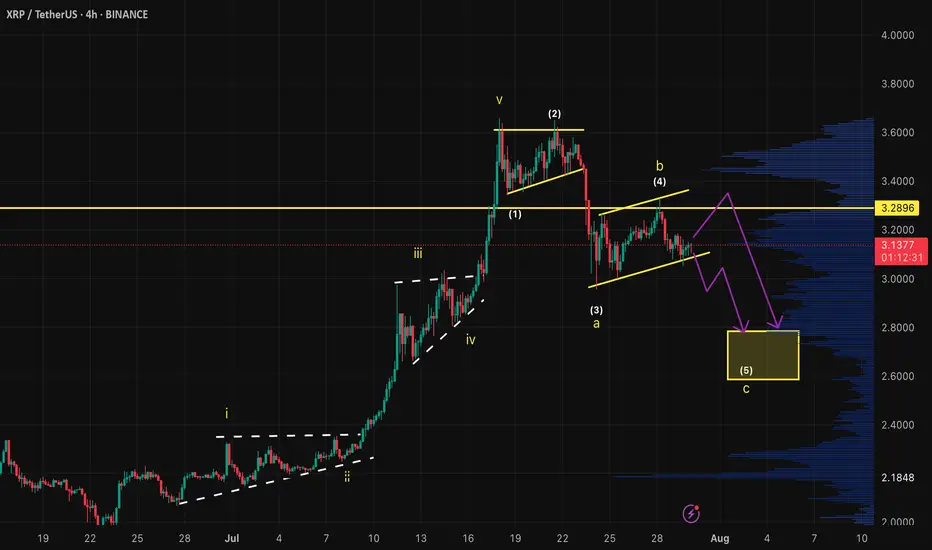
XRPUSDT ShortWe´ve just finished the 5th wave of the bullish structure and started a 5 wave corrective structure for a bigger ABC correction. Right now we´re in the 4th wave and exspecting one more bearish move into the yellow area
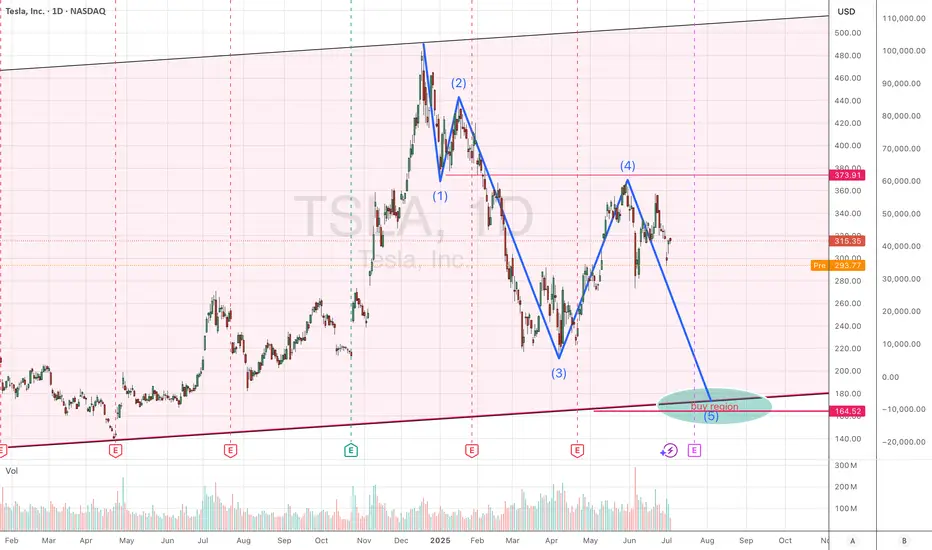
TSLA: short as short can...below 200 certainly worth considering a reentry, but currently not sure if it will stop at 200 of 150.
bullish move can start. good risk reward swing tradePerfect spot to buy as comppany has also shown positive quaterly result.
small time swing trade

U.S. Dollar Index (DXY) – July 30, 2025 | 15-Min Chart1. **Range-Bound Structure**
DXY is consolidating between 98.588 support and 99.134 resistance. The 98.68–98.74 zone has acted as demand, but repeated retests show weakening buyer interest.
2. **Failed Breakouts**
Multiple rejections at 99.134 indicate it's a trap zone where sellers absorb buy-side pressure.
3. **Bearish Momentum Signs**
Lower highs and wicks into resistance with weak closes suggest distribution. Momentum likely shows bearish divergence.
4. **Critical Levels**
* **Support:** 98.588 — a break below this opens downside potential.
* **Resistance:** 99.134 — bulls need a strong breakout above this for continuation to 99.41+.
Summary:
Sellers dominate below 99.134. If 98.588 breaks, expect bearish continuation. Only a confirmed breakout above 99.134 shifts bias bullish.

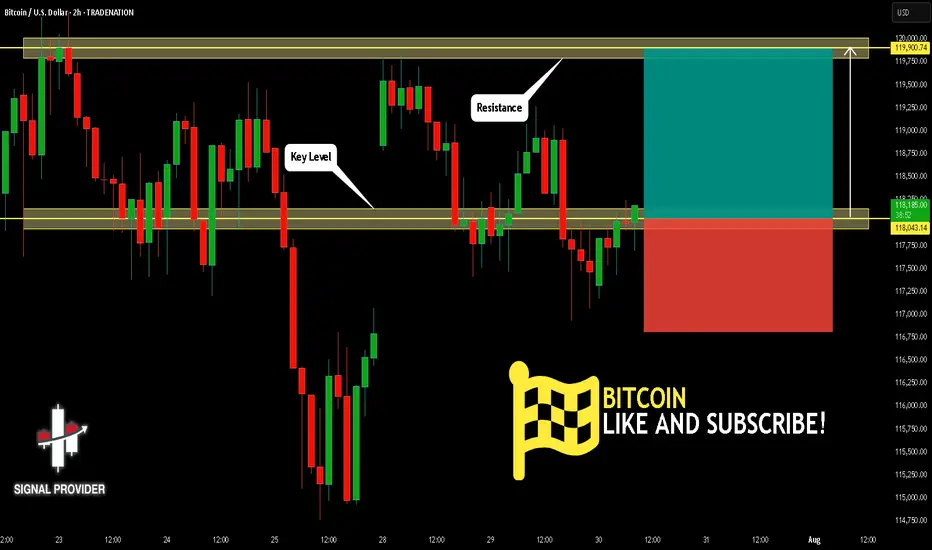
BITCOIN Will Move Higher! Long!
Take a look at our analysis for BITCOIN.
Time Frame: 2h
Current Trend: Bullish
Sentiment: Oversold (based on 7-period RSI)
Forecast: Bullish
The price is testing a key support 118,043.14.
Current market trend & oversold RSI makes me think that buyers will push the price. I will anticipate a bullish movement at least to 119,900.74 level.
P.S
The term oversold refers to a condition where an asset has traded lower in price and has the potential for a price bounce.
Overbought refers to market scenarios where the instrument is traded considerably higher than its fair value. Overvaluation is caused by market sentiments when there is positive news.
Disclosure: I am part of Trade Nation's Influencer program and receive a monthly fee for using their TradingView charts in my analysis.
Like and subscribe and comment my ideas if you enjoy them!
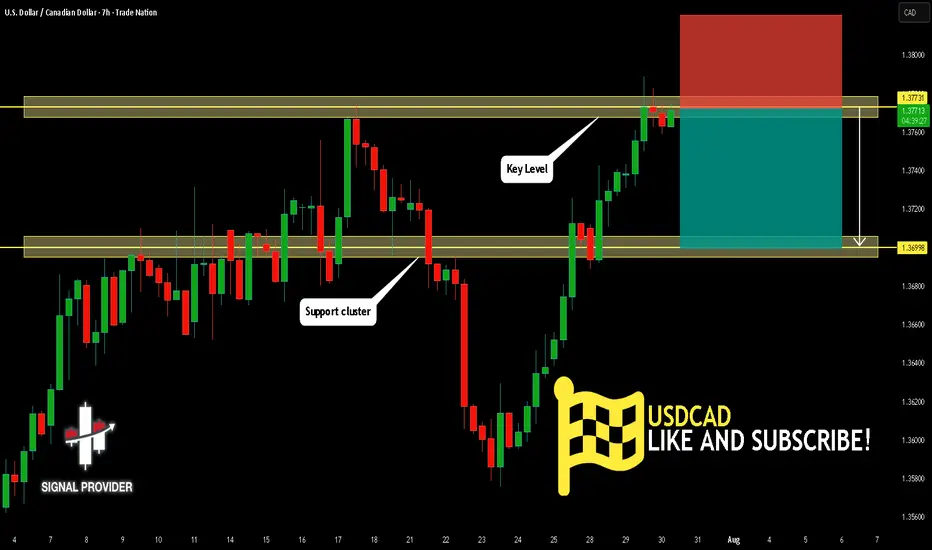
USDCAD Is Bearish! Sell!
Please, check our technical outlook for USDCAD.
Time Frame: 7h
Current Trend: Bearish
Sentiment: Overbought (based on 7-period RSI)
Forecast: Bearish
The market is trading around a solid horizontal structure 1.377.
The above observations make me that the market will inevitably achieve 1.369 level.
P.S
We determine oversold/overbought condition with RSI indicator.
When it drops below 30 - the market is considered to be oversold.
When it bounces above 70 - the market is considered to be overbought.
Disclosure: I am part of Trade Nation's Influencer program and receive a monthly fee for using their TradingView charts in my analysis.
Like and subscribe and comment my ideas if you enjoy them!
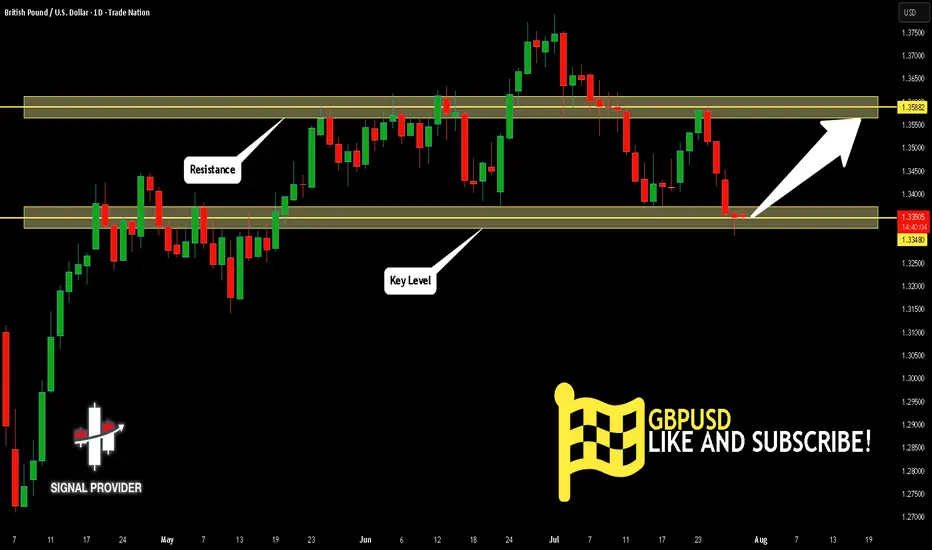
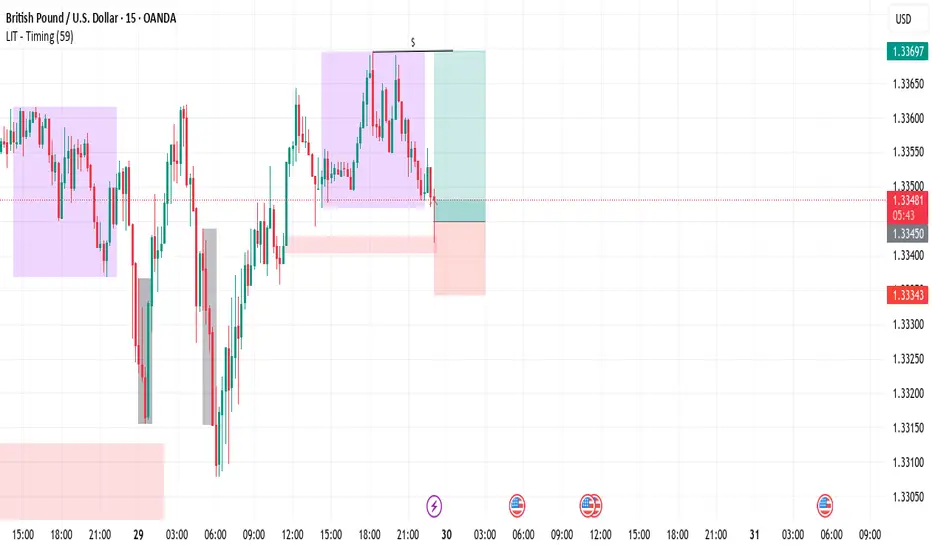
GBPUSD Is Very Bullish! Buy!
Here is our detailed technical review for GBPUSD.
Time Frame: 1D
Current Trend: Bullish
Sentiment: Oversold (based on 7-period RSI)
Forecast: Bullish
The market is testing a major horizontal structure 1.334.
Taking into consideration the structure & trend analysis, I believe that the market will reach 1.358 level soon.
P.S
Overbought describes a period of time where there has been a significant and consistent upward move in price over a period of time without much pullback.
Disclosure: I am part of Trade Nation's Influencer program and receive a monthly fee for using their TradingView charts in my analysis.
Like and subscribe and comment my ideas if you enjoy them!
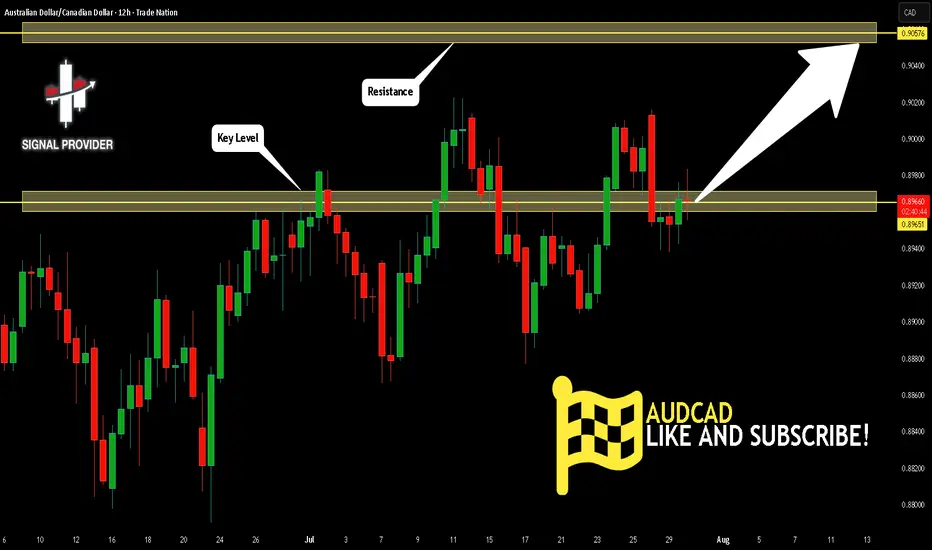
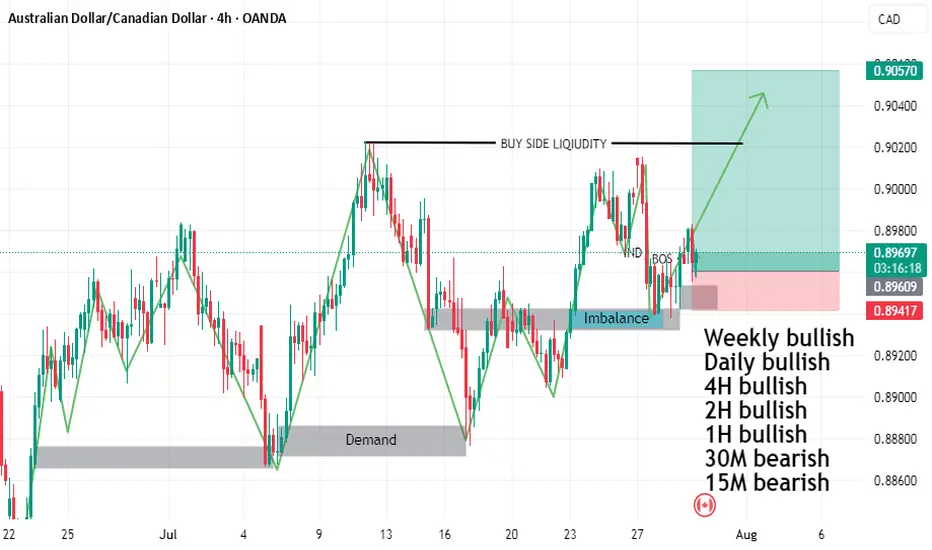
AUDCAD Is Going Up! Long!
Take a look at our analysis for AUDCAD.
Time Frame: 12h
Current Trend: Bullish
Sentiment: Oversold (based on 7-period RSI)
Forecast: Bullish
The market is approaching a key horizontal level 0.896.
Considering the today's price action, probabilities will be high to see a movement to 0.905.
P.S
Please, note that an oversold/overbought condition can last for a long time, and therefore being oversold/overbought doesn't mean a price rally will come soon, or at all.
Disclosure: I am part of Trade Nation's Influencer program and receive a monthly fee for using their TradingView charts in my analysis.
Like and subscribe and comment my ideas if you enjoy them!
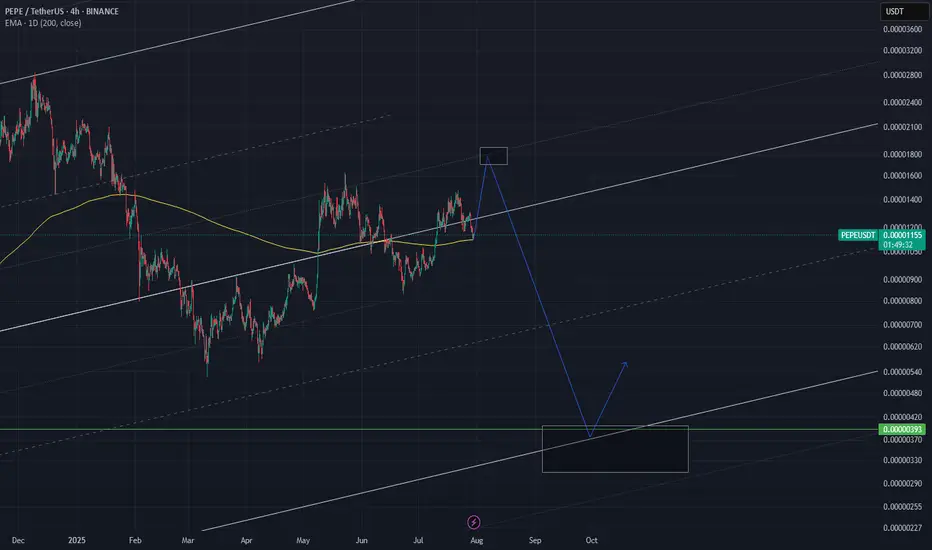
Get Ready to Sell...I'm expecting another swing high (probably by FOMC upcoming statement) just before a an almost 80% drop!
Get ready to sell your PEPE and other crypto before the huge drop.
YOU HAVE BEEN WARNED !!!
SOL Both scenarios are valid! SOL is still bullishSOL Both scenarios are valid! SOL is still bullish
SOL is in a critical zone. The price is still inside a large bullish pattern and as long as it stays inside the pattern, the trend remains bullish and SOL should follow the bullish scenario.
The bullish targets are at 205, 214 and 224
It may happen that the FOMC will bring surprises, so if SOL manages to break below the pattern, it will activate the bearish scenario after that and the chances of falling will increase further as shown in the red scenario.
The bearish targets are at 160 and 139
You may find more details in the chart!
Thank you and Good Luck!
PS: Please support with a like or comment if you find this analysis useful for your trading day

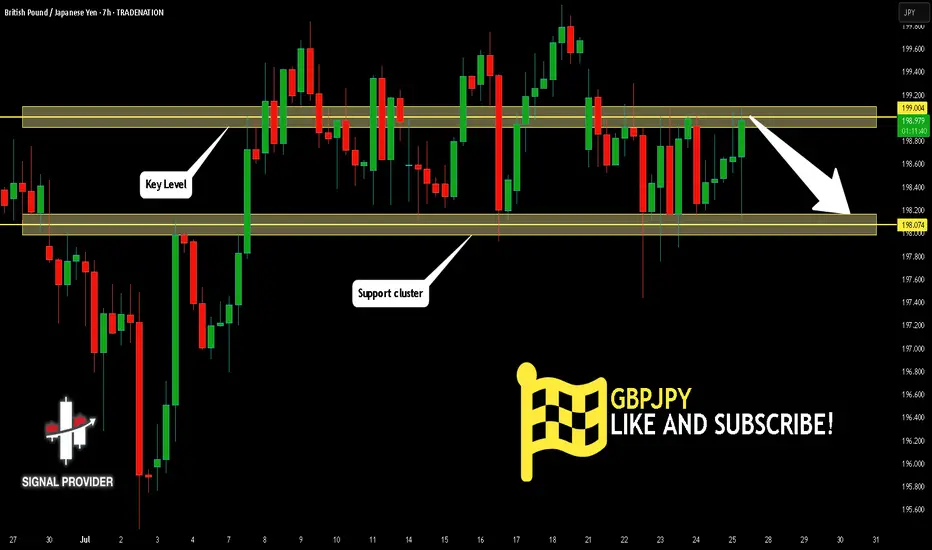
GBPJPY Is Very Bearish! Sell!
Please, check our technical outlook for GBPJPY.
Time Frame: 7h
Current Trend: Bearish
Sentiment: Overbought (based on 7-period RSI)
Forecast: Bearish
The market is trading around a solid horizontal structure 199.004.
The above observations make me that the market will inevitably achieve 198.074 level.
P.S
Please, note that an oversold/overbought condition can last for a long time, and therefore being oversold/overbought doesn't mean a price rally will come soon, or at all.
Disclosure: I am part of Trade Nation's Influencer program and receive a monthly fee for using their TradingView charts in my analysis.
Like and subscribe and comment my ideas if you enjoy them!
AUDCAD BUY SETUPTHE PRICE FORMED HEAD AND SHOULDER
and do rejection from mitigation order block and imbalance
and we have liquidity on time frame daily buy side liquidity
and time frame weekly double top
so I will buy with you
DON'T forget to follow me so that get more refresh analysis
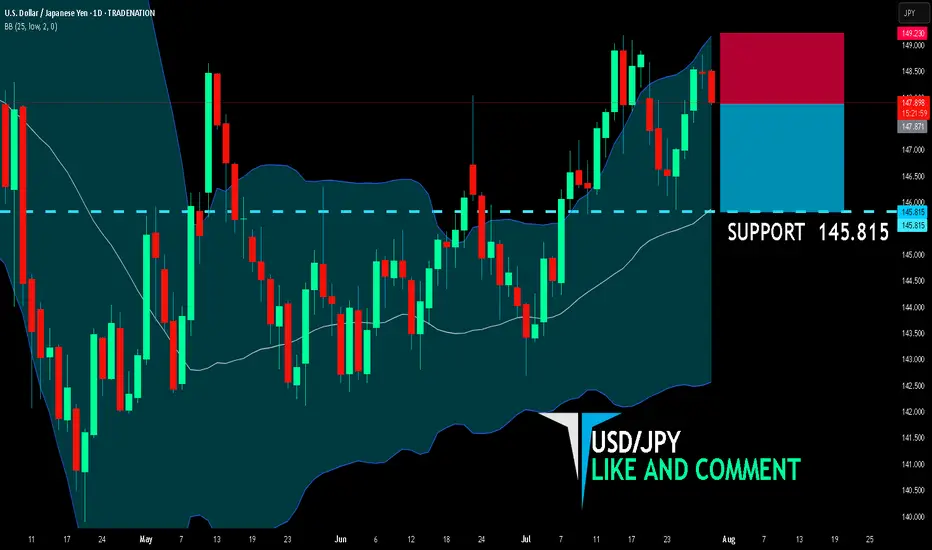
USD/JPY BEARS ARE GAINING STRENGTH|SHORT
USD/JPY SIGNAL
Trade Direction: short
Entry Level: 147.871
Target Level: 145.815
Stop Loss: 149.230
RISK PROFILE
Risk level: medium
Suggested risk: 1%
Timeframe: 1D
Disclosure: I am part of Trade Nation's Influencer program and receive a monthly fee for using their TradingView charts in my analysis.
✅LIKE AND COMMENT MY IDEAS✅
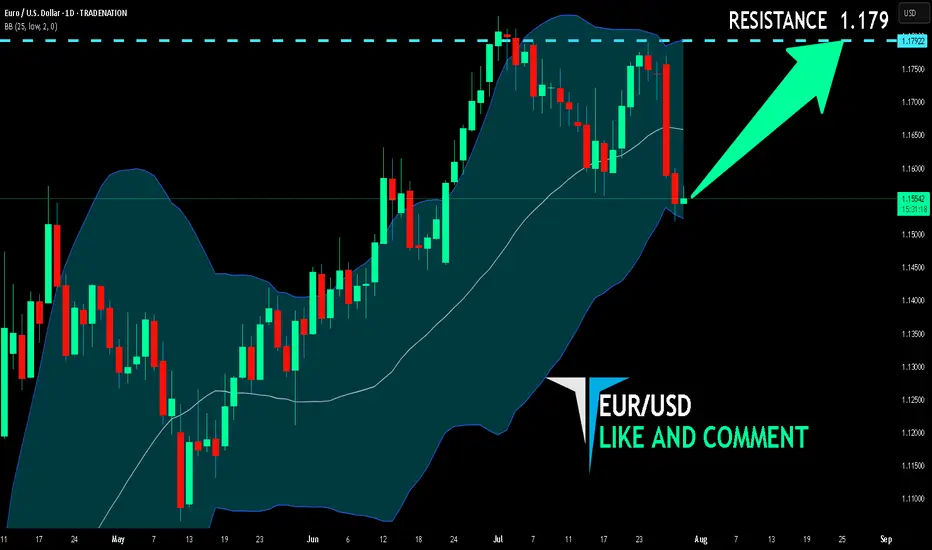
EUR/USD BULLISH BIAS RIGHT NOW| LONG
Hello, Friends!
EUR/USD pair is in the uptrend because previous week’s candle is green, while the price is obviously falling on the 1D timeframe. And after the retest of the support line below I believe we will see a move up towards the target above at 1.179 because the pair is oversold due to its proximity to the lower BB band and a bullish correction is likely.
Disclosure: I am part of Trade Nation's Influencer program and receive a monthly fee for using their TradingView charts in my analysis.
✅LIKE AND COMMENT MY IDEAS✅
perfect buying spot with risk reward of 1 : 6buy at 470 to 475 levels
sl 458 daily candle closing basis
target 570

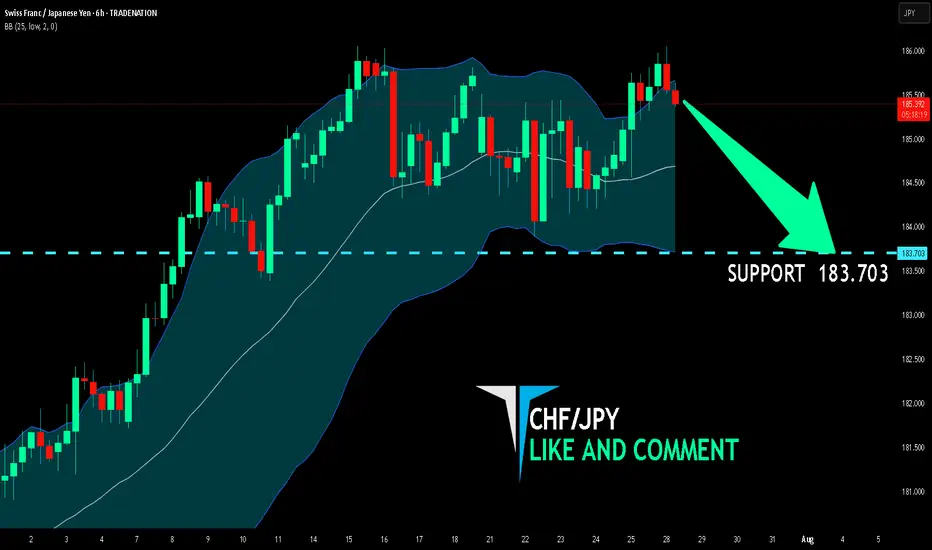
CHF/JPY BEARISH BIAS RIGHT NOW| SHORT
Hello, Friends!
The BB upper band is nearby so CHF-JPY is in the overbought territory. Thus, despite the uptrend on the 1W timeframe I think that we will see a bearish reaction from the resistance line above and a move down towards the target at around 183.703.
Disclosure: I am part of Trade Nation's Influencer program and receive a monthly fee for using their TradingView charts in my analysis.
✅LIKE AND COMMENT MY IDEAS✅
Gold Eliot analysis My predictions about gold in previous years have been quite accurate and calculated. Currently, I think a wave 4 correction, which is a micro-wave, is taking place. As we can see, this micro-wave will probably decrease between $2,700 and $3,000 and then advance to targets above $4,000. Majid Babaei Tehran August 1404
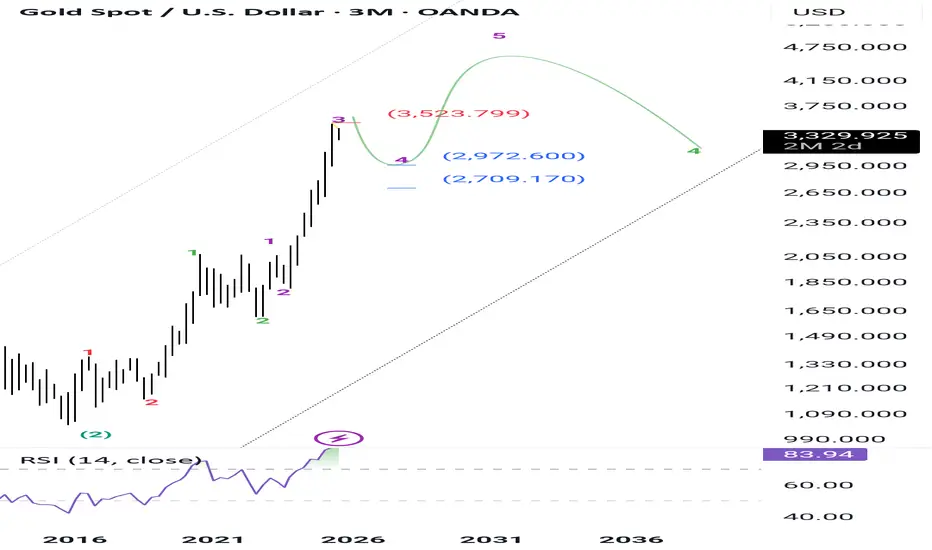
Gold annalize Majid babai aslMy predictions about gold in previous years have been quite accurate and calculated. Currently, I think a wave 4 correction, which is a micro-wave, is taking place. As we can see, this micro-wave will probably decrease between $2,700 and $3,000 and then advance to targets above $4,000. Majid Babaei Tehran August 1404

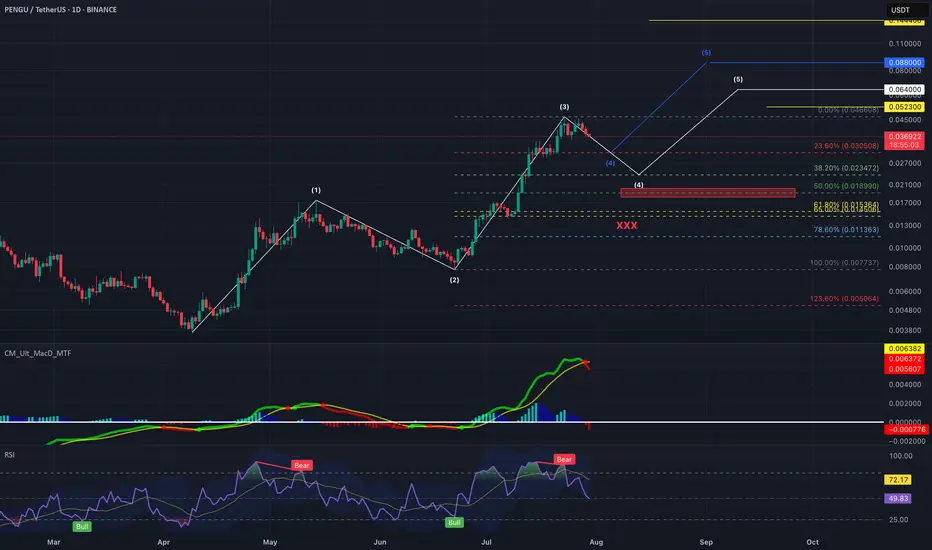
PENGU Update | Elliott Wave Cooling Before Final Push?Our original analysis anticipated this pullback and it’s playing out beautifully. Wave 3 wrapped up at 0.0466, and we’re now seeing signs of a healthy Wave 4 retracement.
Current Structure
Wave 3 completed from 0.0077 to 0.0466. Really strong wave 3.
Now retracing with:
- MACD bearish crossover
- RSI bearish divergence
And Wave 4 pullback zone is likely between 0.0305 – 0.0255 (Fib 0.236–0.382 of Wave 3)
We're now in the cool-down phase, with momentum indicators rolling over. The red box around 0.0185–0.0200 is key support. If that holds (Wave 1 high), structure remains valid for a Wave 5 extension.
Wave 5 Upside Targets are
0️⃣ $0.0438 – $0.0473 (Base case recovery)
1️⃣ $0.0523 (Typical Wave 5 projection)
2️⃣ $0.0640 (Extended Wave 5)
3️⃣ $0.0880 Parabolic (FOMO scenario, 10% chance)
Breakdown below Wave 1 invalidates the count (red box region). CSECY:PENGU has been leading the meme sector this cycle, and there’s no more "positive" news around NYSE:PUMP to drain liquidity yet. So, I believe we might actually see a shallow pullback.
This Wave 4 is likely the last dip before a clean leg up. Unless macro FUD derails the market, we expect continuation into Wave 5.
Patience is key. Let the retrace finish. Then… maybe moon. 🌝