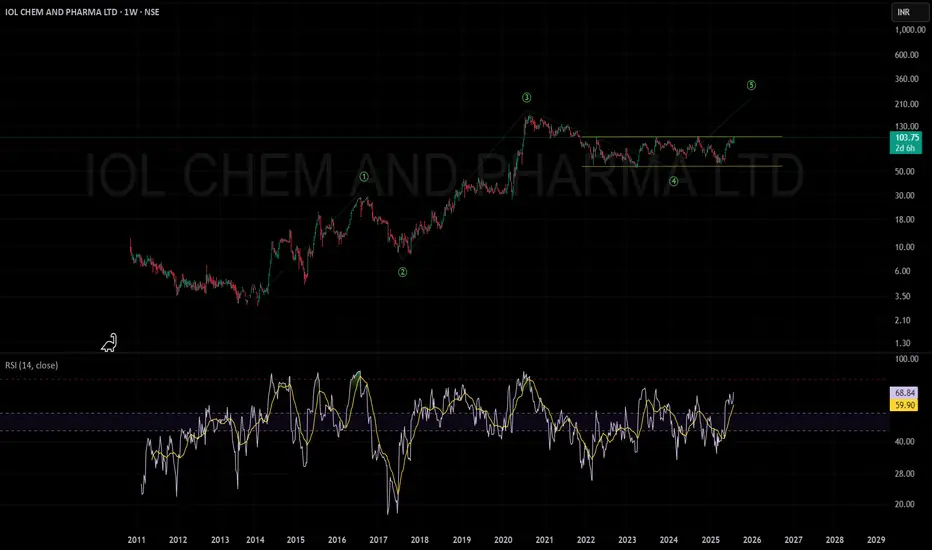
IOLCP positionally looking goodIOL CHEM AND PHARMA LTD (Weekly Chart) – Key Points
Trend:
The stock has finished a long consolidation (Wave ④) and is starting a new upward rally (Wave ⑤ expected).
Price Movement:
Current price: ₹101.47 after a recent sharp rise.
Important resistance to watch: ₹120–₹130 zone.
Momentum (RSI):
RSI at 67.59 — shows strong momentum.
Volume:
Rising volume near breakout, supporting the current price move.
Possible Scenarios:
If price breaks above ₹120–₹130 with good volume:
Likely starts a new strong rally (Wave ⑤).
Possible targets: ₹210–₹360.
If resistance holds and RSI turns overbought:
Short-term pullback or pause likely.
Support to watch: ₹90–₹100.
Summary:
The setup is bullish, but key resistance and overbought risks need monitoring before any new major upswing.
Wave Analysis
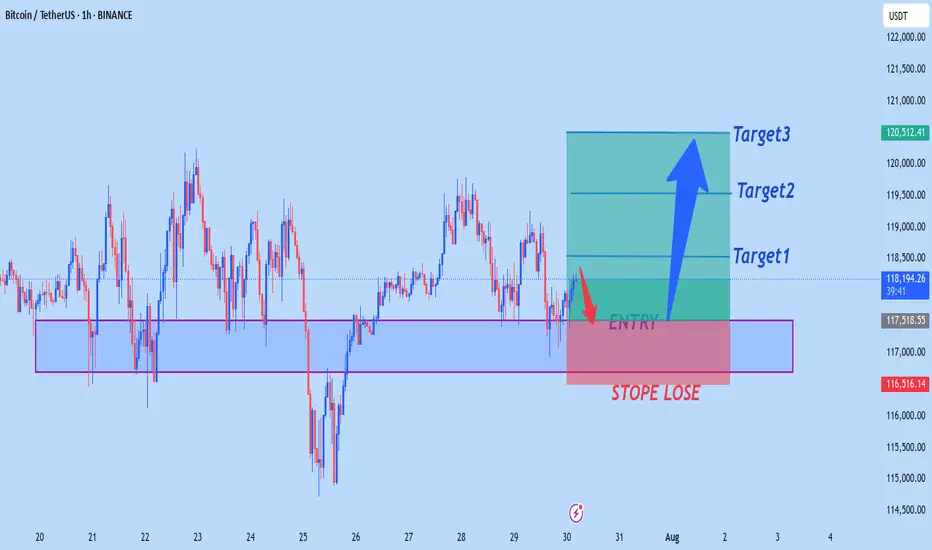
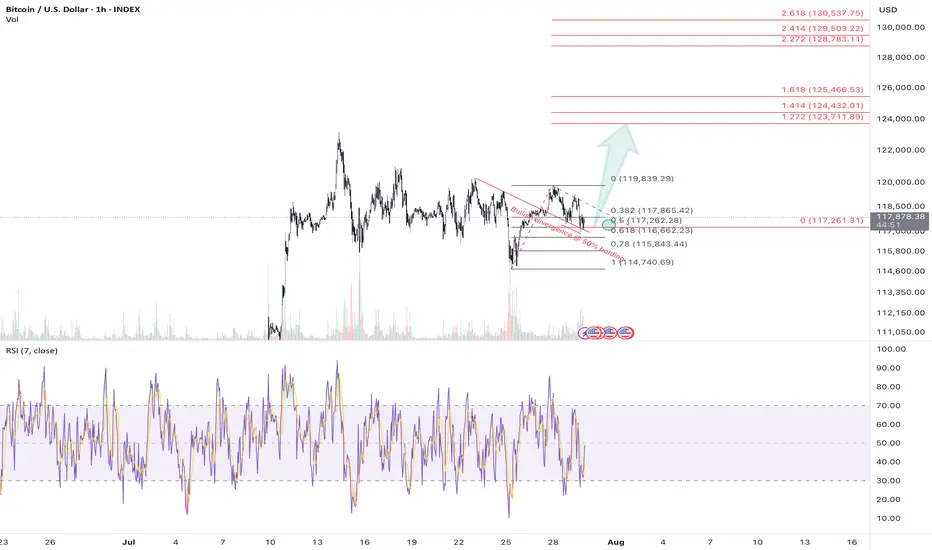
BTCUSD NEW OUTLOOKBtcusd buy from 117,500
Target1 118,500
Target2 119,500
Target3 120,500
Stope Lose 116,500
TRADE AT YOUR OWN RISK
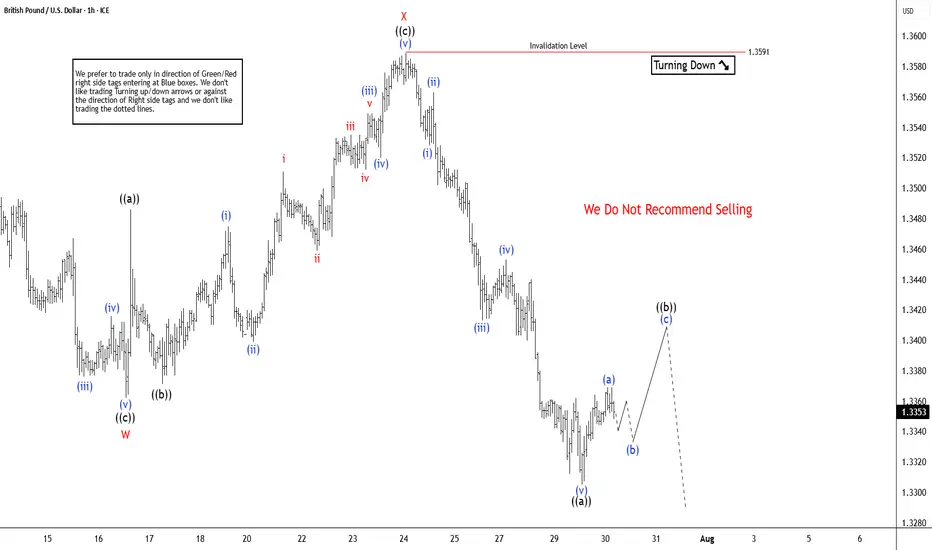
GBPUSD Elliott Wave Insight Bounce Should Fail Into Support ZoneThe GBPUSD is trading in higher high sequence from 9.22.2022 low in weekly. The bounce is corrective Elliott Wave sequence & expect further upside. It favors pullback in proposed 7 swings from 7.01.2025 high & extend into 1.3162 – 1.2898 area, while below 7.23.2025 high. It should find buyers into extreme area for next leg higher in daily or at least 3 swings bounce. In 4-hour, it started correcting lower from 7.01.2025 high. It ended W at 1.3362 low of 7.16.2025 & X at 1.3589 high of 7.23.2025 each in 3 swings. Below X high, it favors downside in Y in 3 swings as it broke below 7.16.2025 low, expecting into extreme area. Within W, it ended ((a)) at 1.3523 low, ((b)) at 1.3620 high & ((c)) at 1.3362 low. Above there, it placed ((a)) at 1.3486 high, ((b)) at 1.3371 low & ((c)) as X connector at 1.3589 high. The double correction unfolds in 3-3-3 structure, which will complete, when current bounce fails below 7.23.2025 high to new low into extreme area. It ended ((a)) of Y into 0.618 – 0.764 Fibonacci extension area of W & expect 3 or 7 swings bounce in ((b)).
Below X high, it placed ((a)) of Y at 1.3305 low & favors bounce in ((b)) in 3 or 7 swings against 7.23.2025 high. Within ((a)), it ended (i) at 1.3528 low, (ii) at 1.3563 high, (iii) at 1.3413 low, (iv) at 1.3543 high & (v) at 1.3305 low. Above there, it favors bounce in (a) of ((b)) and expect small upside before it should pullback in (b). The next pullback in (b) should stay above 1.3305 low choppy price action before continue upside in (c). Ideally, ((b)) can bounce between 1.3413 – 1.3481 area as 0.382 – 0.618 Fibonacci retracement of ((a)) before continuing lower. Wave ((b)) bounce expect to fail below 1.3591 high before extending lower in ((c)) into 1.3162 – 1.2898 to finish double correction. Because of higher high in daily since September-2022 low, it should find buyers in extreme area to resume higher. It expects sideways to higher until FOMC event followed by selloff, while bounce fail below 7.23.2025 high. We like to buy the pullback into extreme area for next leg higher or at least 3 swings reaction.
XAUUSD CAN FLY HIGHXauusd market running in side from last few days now market will touch the support zone so if you to buy gold then you have to good oppourtanity to buy from support level
TRADE AT YOUR OWN RISK
REGARD ALBERT

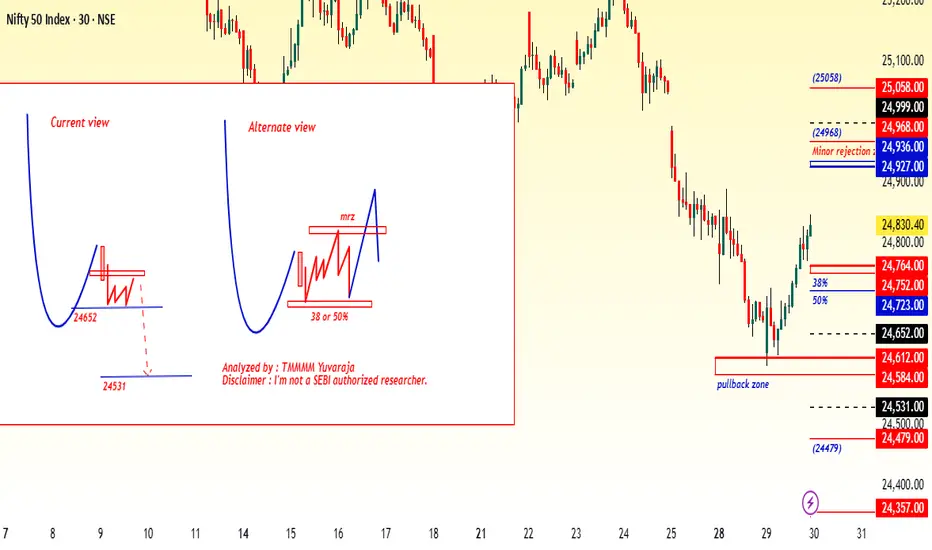
#Nifty directions and levels for July 30th:Good morning, friends! 🌞
Here are the market directions and levels for July 30th:
There have been no major changes in the global market. The global sentiment remains moderately bullish,
while the local market continues to show a bearish tone.
Today, Gift Nifty indicates a gap-down opening of around 40 points.
What can we expect today?
In the previous session, both Nifty and Bank Nifty took a solid pullback after the gap-down start.
However, neither of them broke the 38% Fibonacci level in the current swing.
So, unless the 38% level is broken, we should continue to approach the market with a bearish view.
At the same time, key parameters have been lagging recently, which has made it difficult for the market to take a clear direction.
My primary expectation is consolidation within the previous day's range.
However, if the market breaks the bottom with a solid structure, then we can expect the correction to continue.
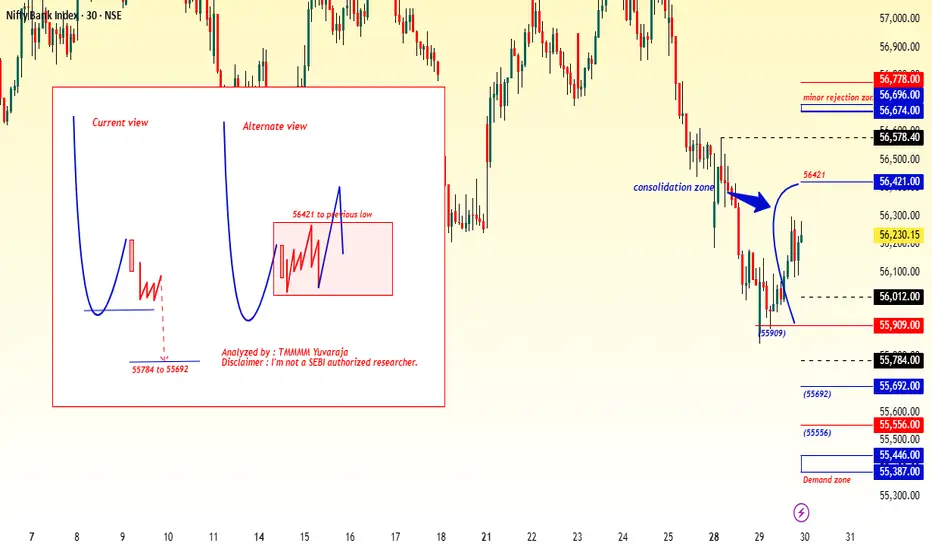
#Banknifty directions and levels for July 30th:
What can we expect today?
In the previous session, both Nifty and Bank Nifty took a solid pullback after the gap-down start.
However, neither of them broke the 38% Fibonacci level in the current swing.
So, unless the 38% level is broken, we should continue to approach the market with a bearish view.
At the same time, key parameters have been lagging recently, which has made it difficult for the market to take a clear direction.
My primary expectation is consolidation within the previous day's range.
However, if the market breaks the bottom with a solid structure, then we can expect the correction to continue.
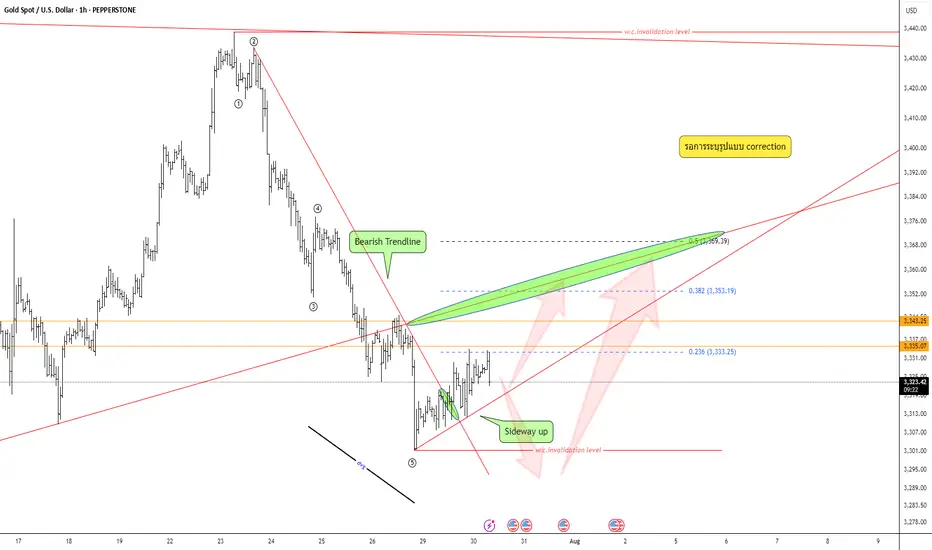
Keep an eye on the correction pattern —Quick Take:
- Strong bearish move, but wave structure still unclear — not a confirmed impulse.
- Bear trendline has broken; market now leaning toward sideways-up.
- Divergence is visible.
Plan:
Wait for correction pattern → confirm with your system → execute only with full data and strict risk management.
HIMS WEEKLY TRADE IDEA (7/29/25)*
**💊 HIMS WEEKLY TRADE IDEA (7/29/25)**
**🔥 Bullish Flow + Rising RSI + Institutional Volume**
**📈 Trade Setup**
• **Stock**: \ NYSE:HIMS
• **Direction**: CALL (LONG)
• **Strike**: \$64.00
• **Entry**: \$0.92
• **Target**: \$1.38
• **Stop**: \$0.46
• **Size**: 2 contracts
• **Expiry**: Aug 1, 2025 (3DTE)
• **Confidence**: 80%
• **Entry Timing**: Market Open
---
**🧠 Why This Trade?**
✅ **Call/Put Ratio = 1.37** → Bullish sentiment
✅ **RSI Daily: 65.2 / Weekly: 61.3** → Momentum building
✅ **1.8x Weekly Volume Surge** → Institutional accumulation
✅ **\$64C OI = 2,616** → High liquidity + interest
⚠️ **Gamma Risk + Fast Decay** → Time-sensitive play
---
**🎯 Strategy**
→ Play the momentum spike into expiry
→ Exit quickly on profit target or 50% stop
**#OptionsTrading #HIMS #SwingTrade #EarningsPlay #TradingViewSetup #FlowTrade**

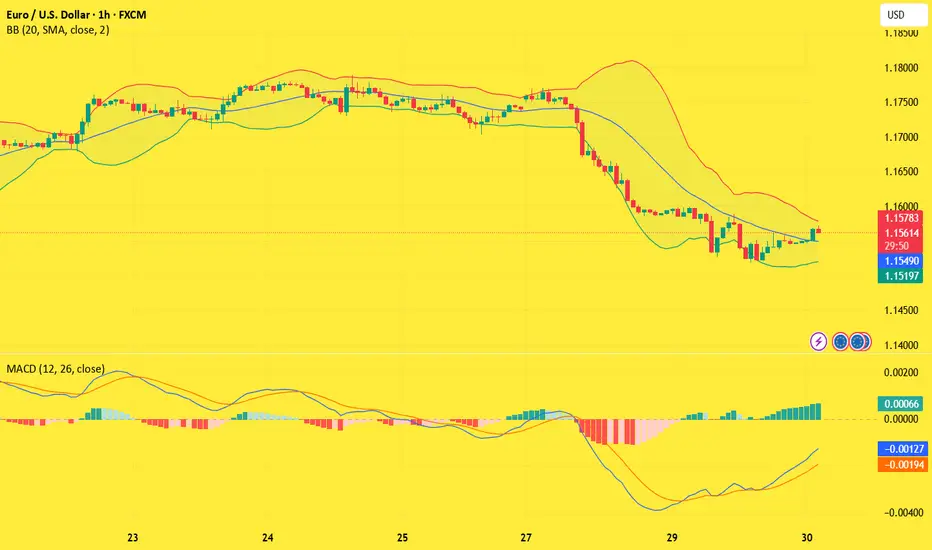
EURUSD(20250730) Today's AnalysisMarket News:
According to a Reuters/Ipsos poll, Trump's approval rating has fallen to 40%, the lowest level since his second term.
Technical Analysis:
Today's Buy/Sell Levels:
1.1554
Support and Resistance Levels:
1.1634
1.1604
1.1584
1.1523
1.1504
1.1474
Trading Strategy:
If the price breaks above 1.1584, consider entering a buy position, with the first target price at 1.1604. If the price breaks below 1.1554, consider entering a sell position, with the first target price at 1.1523.
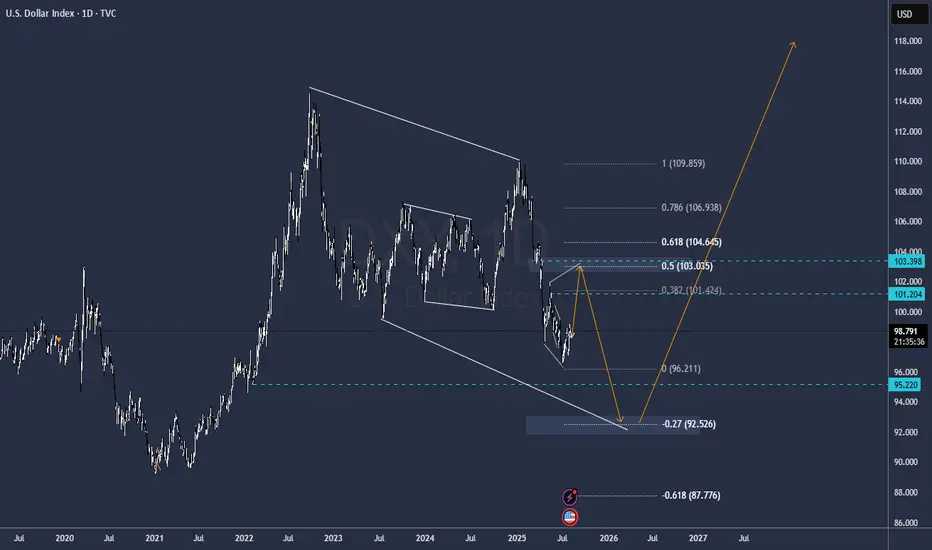
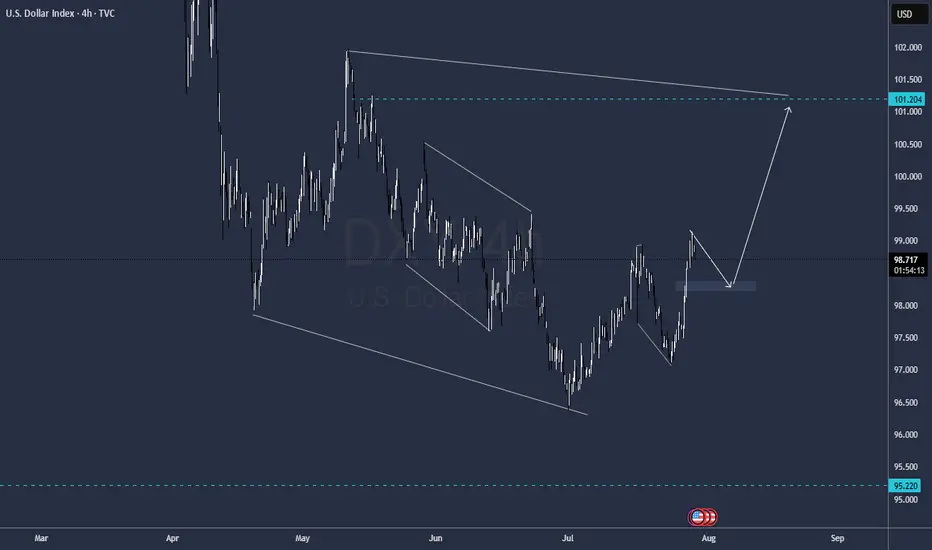
DXY dayly structureMay change indeed
but its pretty much what meassures and current development is showing
GG
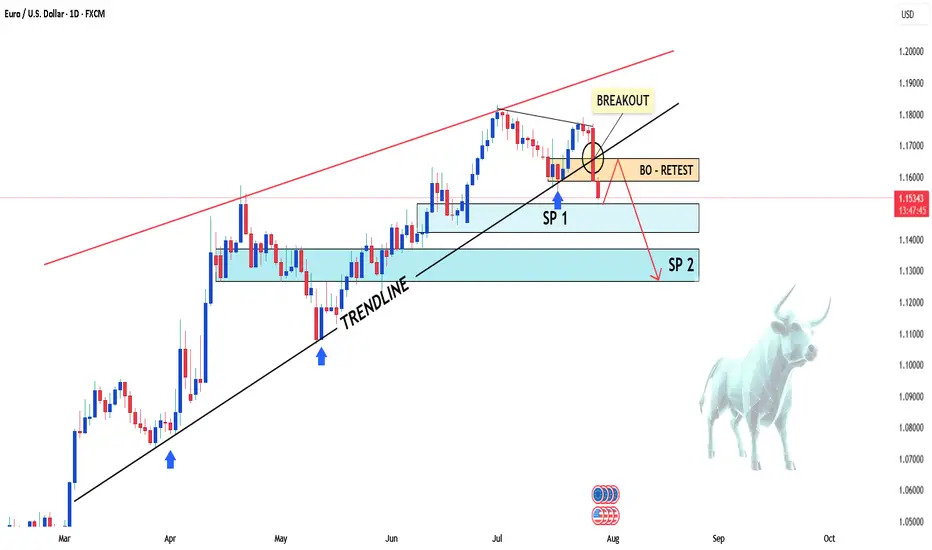
EUR/USD Slips Again – Just a Pullback or More to Come?Hey everyone! Great to have you back for another market chat today.
As of writing, EUR/USD remains under significant bearish pressure, currently trading near 1.154 — marking a rather gloomy start to the new trading week. The euro is clearly struggling to attract buying interest as traders reassess the ECB’s stance and digest the newly announced EU–US trade agreement. Meanwhile, the U.S. dollar is gaining momentum, flipping the trend unexpectedly.
From a technical perspective, EUR/USD is showing clear weakness. The pair has broken below both its rising wedge and previous uptrend line, with candles closing firmly lower — a strong sign that the bears are in control.
In my personal view, I expect EUR/USD to continue sliding toward the next two support zones, although a minor pullback could occur first as part of a typical correction.
But what do you think? Is this just a dip… or the start of something bigger for EUR/USD? Let me know your take in the comments!
Potentially a wave 2 completing of wave 1 of 3 in wave one...06 or higher is looking like a target before the explosion. If i am correct this is on to add to your list. I will not be giving any FINANCIAL ADVICE as always.
This could go wild over the next year.
Good luck :)
DXY FOMC FORECASTCristal Clear structure to me, dolar down today before FOMC and then up wild
Levels highlighted
Najors Gold and Cryptos will follow the same behavior
GG
July 30, 2025 - XAUUSD GOLD Analysis and Potential Opportunity🔍 Key Levels to Watch:
• 3384 – Resistance
• 3375 – Key resistance
• 3365 – Resistance
• 3345 – Resistance
• 3336 – Resistance
• 3325 – Key support
• 3310 – Support
• 3300 – Psychological level
• 3283 – Major support
• 3275 – Support
• 3265 – Support
📈 Intraday Strategy:
• SELL if price breaks below 3325 → target 3320, then 3315, 3310, 3300
• BUY if price holds above 3330 → target 3336, then 3345, 3350, 3356
👉 If you find this helpful or traded using this plan, a like would mean a lot and keep me motivated. Thanks for the support!
Disclaimer: This is my personal view, not financial advice. Always use proper risk control.

Nightly $SPY / $SPX Scenarios for July 30, 2025🔮 Nightly AMEX:SPY / SP:SPX Scenarios for July 30, 2025 🔮
🌍 Market‑Moving News 🌍
🧭 Fed Holds Steady Amid Uncertainty
As the FOMC enters its July 29–30 meeting, the Fed is expected to keep rates unchanged at 4.25%–4.50%, even as one or two governors may dissent in favor of rate cuts amid mixed economic data. Recent strength in consumer spending contrasts with weakness in housing and construction.
🌐 U.S.–China Trade Talks Resumed in Stockholm
Talks are under way aimed at extending the tariff truce before the August 12 deadline. Both sides described progress as constructive, though analysts remain cautious on the timeline and potential outcomes.
🛢️ Oil Up / Dollar Firmer, But Risks Remain
Brent crude hit ~$72.50/barrel (+3.5%) while WTI rose to ~$69.20 on a mix of geopolitical tension (possible new Russia tariffs) and trade optimism. The U.S. dollar edged higher following the U.S.–EU trade agreement.
📈 IMF Revises Up Global Growth—but Flags Tariff Risks
The IMF raised its 2025 growth forecast to 3.0% and maintained 3.1% for 2026, citing pre-emptive consumer demand—but warned that ongoing U.S. tariffs and policy inconsistency could dampen momentum.
📊 Key Data Releases & Events 📊
📅 Wednesday, July 30:
FOMC Rate Decision & Powell Press Conference
The Fed is expected to hold interest rates steady. Powell’s remarks will be closely watched for signals on the timing of future cuts and views on inflation and labor markets.
Advance Q2 U.S. GDP Estimate
The first look at Q2 growth is expected around +1.9% YoY, potentially validating a rebound after Q1’s contraction.
June PCE & Core PCE (Personal Consumption Expenditures Index)
The Fed's preferred inflation gauge. Markets will monitor if core inflation remains elevated, which may reinforce policy caution.
⚠️ Disclaimer:
This summary is for educational and informational purposes only—it is not financial advice. Always consult a licensed financial advisor before making investment decisions.
📌 #trading #stockmarket #economy #Fed #GDP #inflation #trade #tariffs #markets

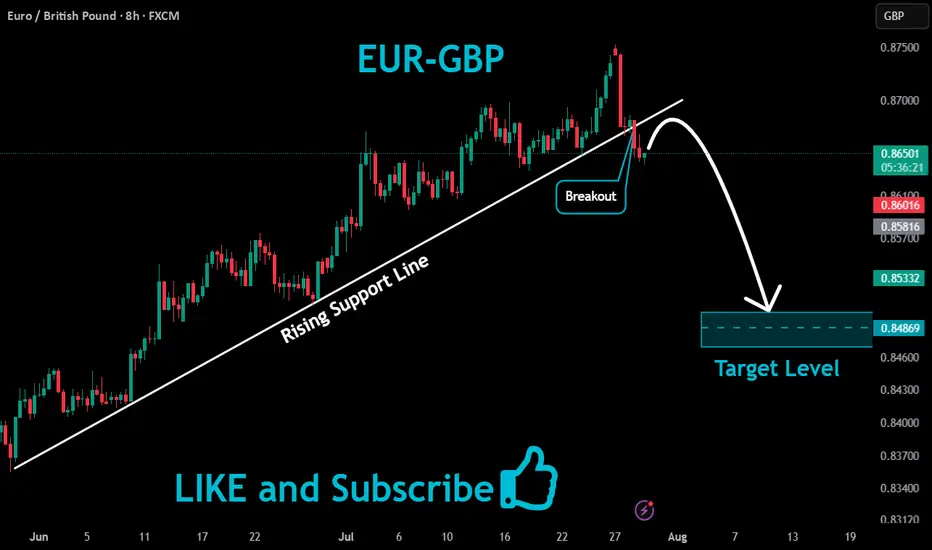
EURGBP Bearish Breakout!
HI,Traders !
#EURGBP broke the rising
Support line and the breakout
Is confirmed so we are
Bearish biased and we
Will be expecting a
Further move down !
Comment and subscribe to help us grow !
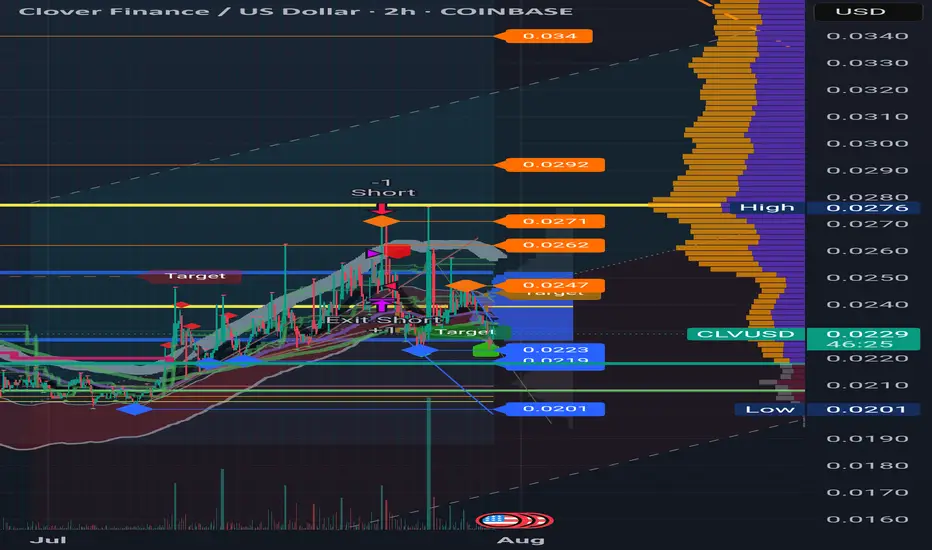
Short-term: Jump over the creek, ready for markupWhen market is in an uptrend, I look for divergence in the price as it holds 50%.
The chart as you see it pictures a perfect scenario for a trade entry, but make sure to have a stop loss set at fib retr. around 70%.
We could see the price going upwards from right here and right now.
Please note that I don't trade real money - I'm in it just for the thrills and fun.
GOLD this snicky GuyTruth be told, im not a big fan of this scenario, its going up mssy but it still looking Bulish, i I have to make a call I will be tking the sell from 3370 and yeah mayb the buy with really, really small risk, but its is up to you
Levels labeled in the chart
GG
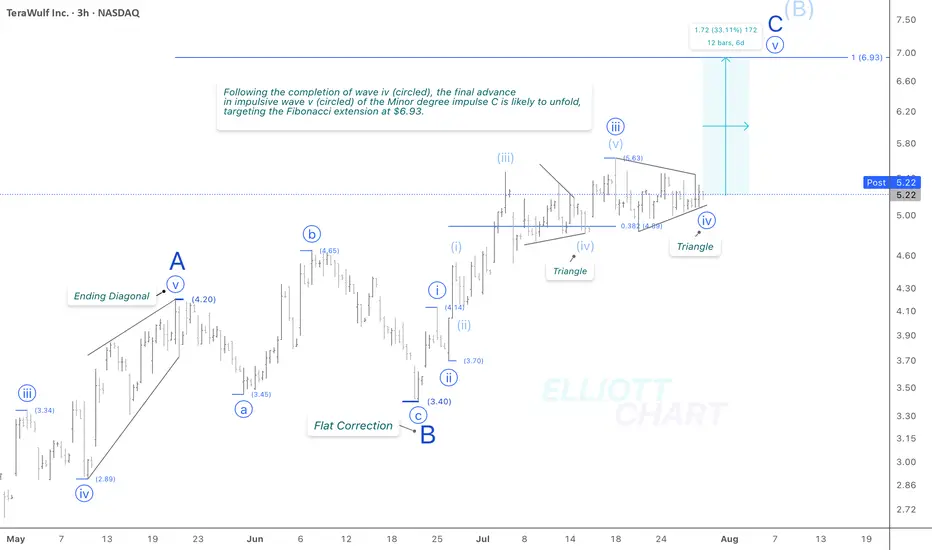
WULF / 3hNASDAQ:WULF continued to consolidate sideways today, in line with expectations, with no material change to the broader outlook. The narrowing price action supports the current wave structure—specifically, a completed triangle in wave iv (circled), likely preceding the anticipated final advance of approximately 33% in wave v (circled) of the ongoing Minor degree wave C.
The Fibonacci extension target at 6.93 remains valid.
Trend Analysis >> Upon completion of Minor degree wave C, the countertrend advance of Intermediate degree wave (B), which has been unfolding since April 9, is likely to give way to a decline in wave (C) of the same degree. This downtrend might begin in the coming days and potentially extend through the end of the year!!
NASDAQ:WULF CRYPTOCAP:BTC BITSTAMP:BTCUSD MARKETSCOM:BITCOIN
#CryptoStocks #WULF #BTCMining #Bitcoin #BTC
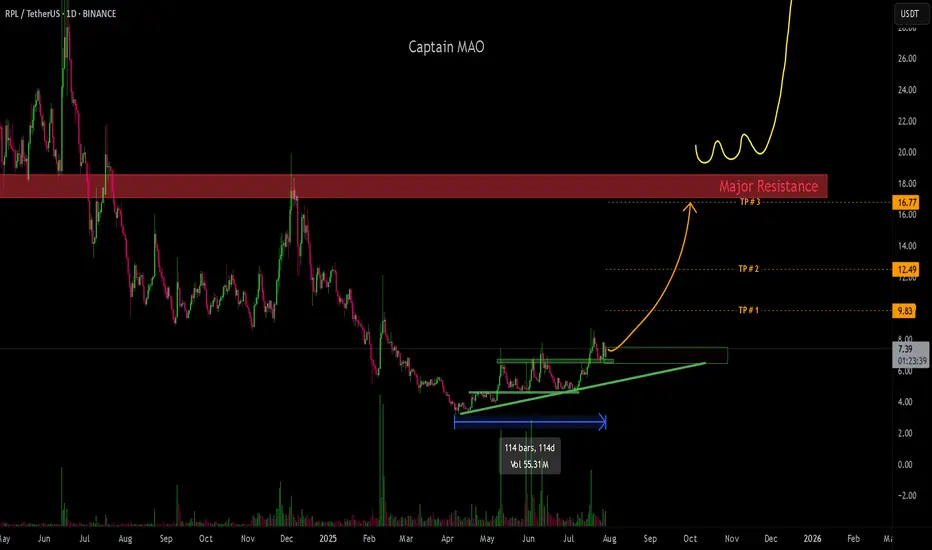
RPL/USDThas spent over 100 days in consolidation, and is now beginning to break through major resistance levels, signaling a structural shift in momentum. Price is currently forming a new base support above the breakout zone, indicating strong buyer interest and commitment to higher prices.
This behavior reflects a classic breakout-retest pattern, where bulls defend newly claimed levels, aiming to build a bullish continuation structure. With market strength aligning, RPL looks poised for a sustained upcoming rally.
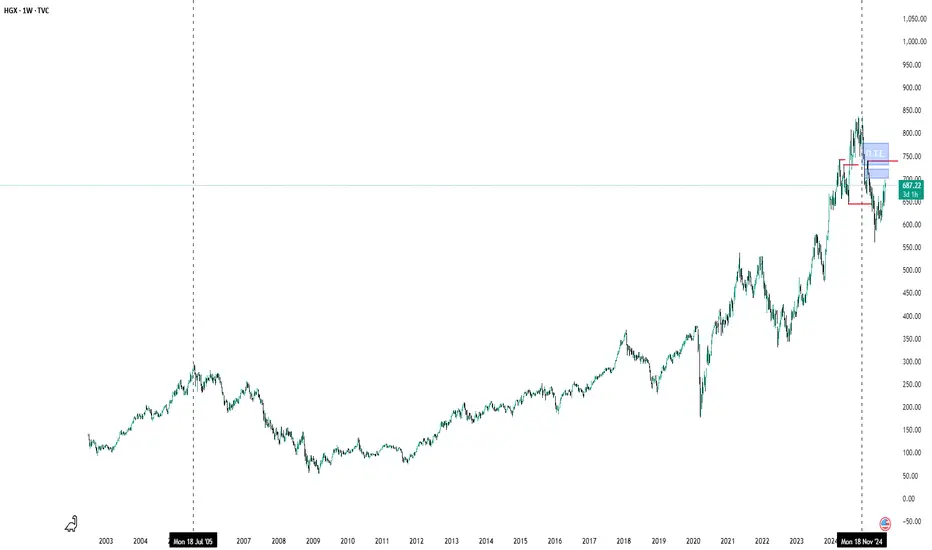
Housing Index, That There Look Identical Weak housing sector looking to return to Optimal trade Entry and then giving up the ghost.
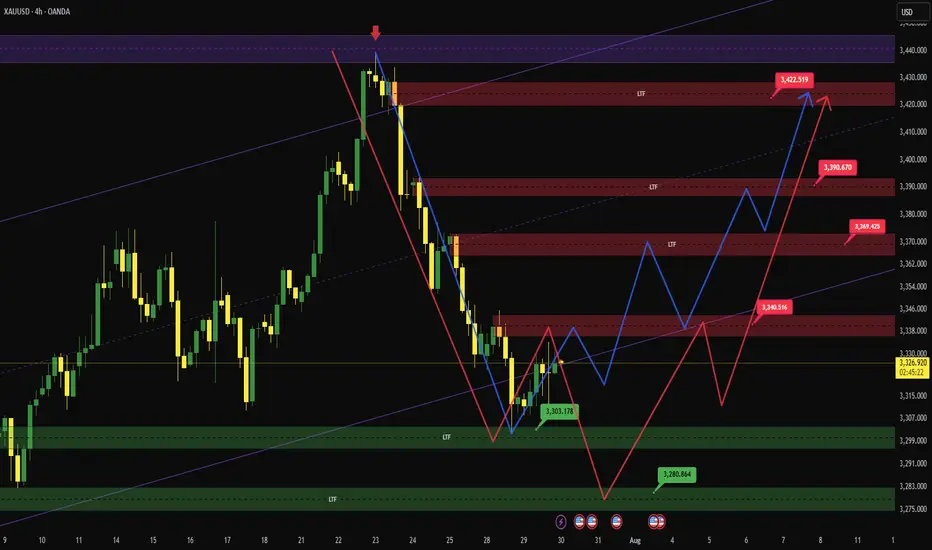
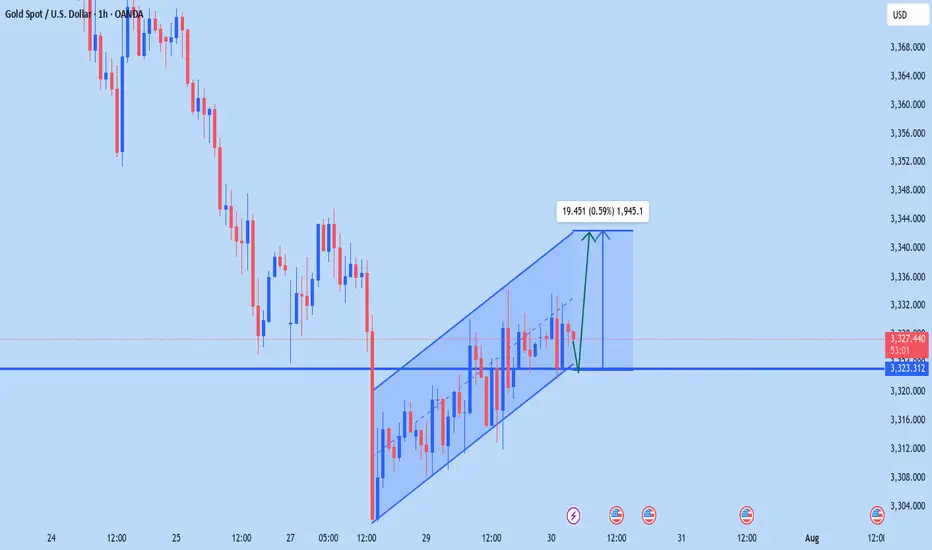
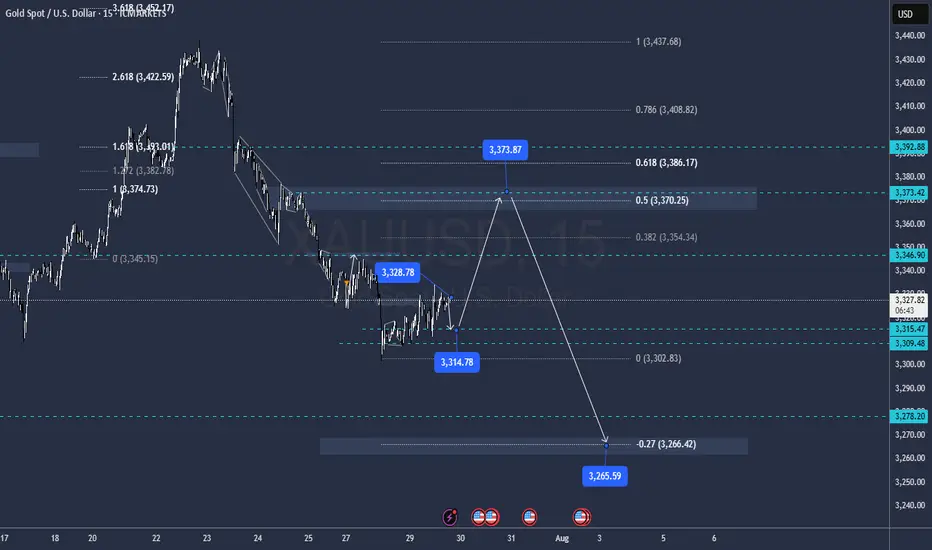
XauUsdThere are two analyses.
As you can see, the overall trend is bullish and long positions have more chances, the important market points are drawn accurately and have high validity.
The red arrow has a 60% chance of occurring and the blue arrow has a 40% chance.
Important market points:
Resistance:
3340
3369
3390
3422
Support:
3303
3280