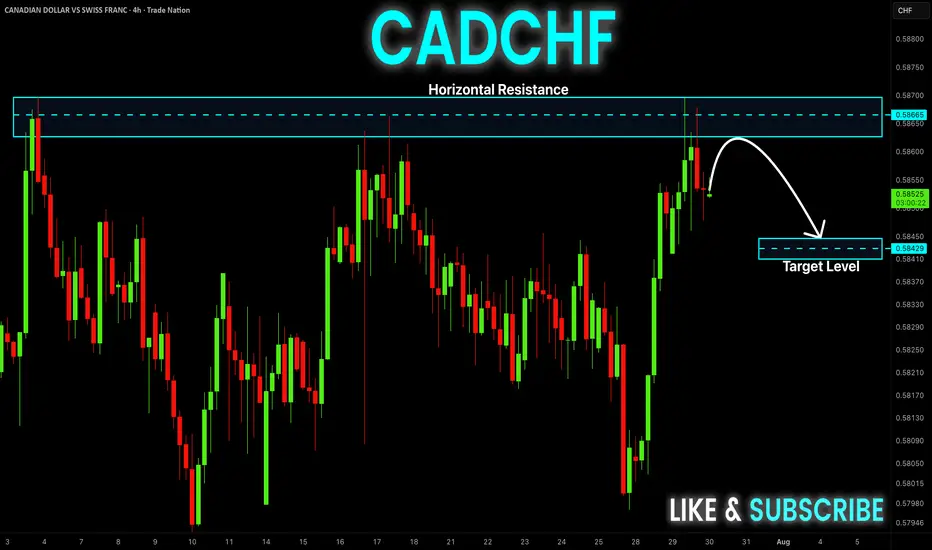
CAD-CHF Local Short! Sell!
Hello,Traders!
CAD-CHF went up and
Made a retest of the
Horizontal resistance
Around 0.5870 and we
Are already seeing a bearish
Pullback so we will be
Expecting a further
Bearish correction
Sell!
Comment and subscribe to help us grow!
Check out other forecasts below too!
Disclosure: I am part of Trade Nation's Influencer program and receive a monthly fee for using their TradingView charts in my analysis.
Wave Analysis
XTZ Motive Wave
After breaking the black descending channel price made waves 1/2 and pumped to the upside for wave 3, where it was held by the blue resistance zone.
We are now in wave 4 correction, and I am waiting for reversals in smaller timeframes for long trades.

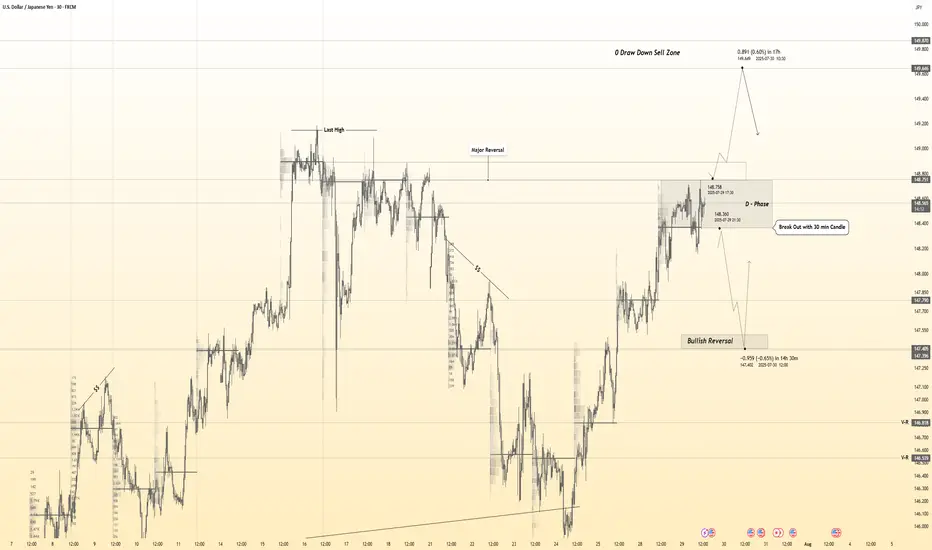
USDJPY 30Min Engaged ( BULLISH & Bearish Break Entry Detected )Time Frame: 30-Minute Warfare
Entry Protocol: Only after volume-verified breakout
🩸Bullish Break- 148.750
🩸Bearish Break- 148.370
➗ Hanzo Protocol: Volume-Tiered Entry Authority
➕ Zone Activated: Dynamic market pressure detected.
The level isn’t just price — it’s a memory of where they moved size.
Volume is rising beneath the surface — not noise, but preparation.
🔥 Tactical Note:
We wait for the energy signature — when volume betrays intention.
The trap gets set. The weak follow. We execute.
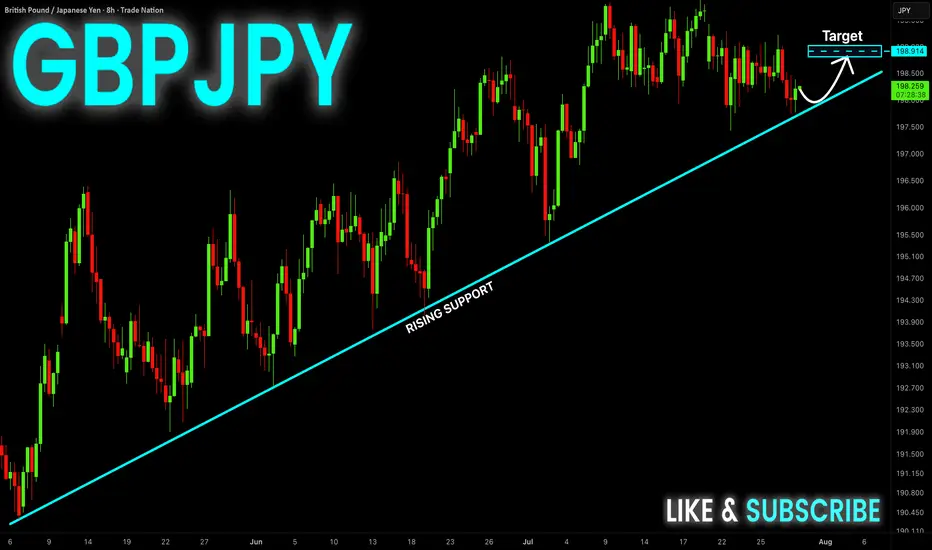
GBP-JPY Rising Support! Buy!
Hello,Traders!
GBP-JPY is trading in an
Uptrend and the pair made
A retest of the rising support
And we are seeing a local
Bullish rebound and we will
Be expecting a further
Local move up
Buy!
Comment and subscribe to help us grow!
Check out other forecasts below too!
Disclosure: I am part of Trade Nation's Influencer program and receive a monthly fee for using their TradingView charts in my analysis.
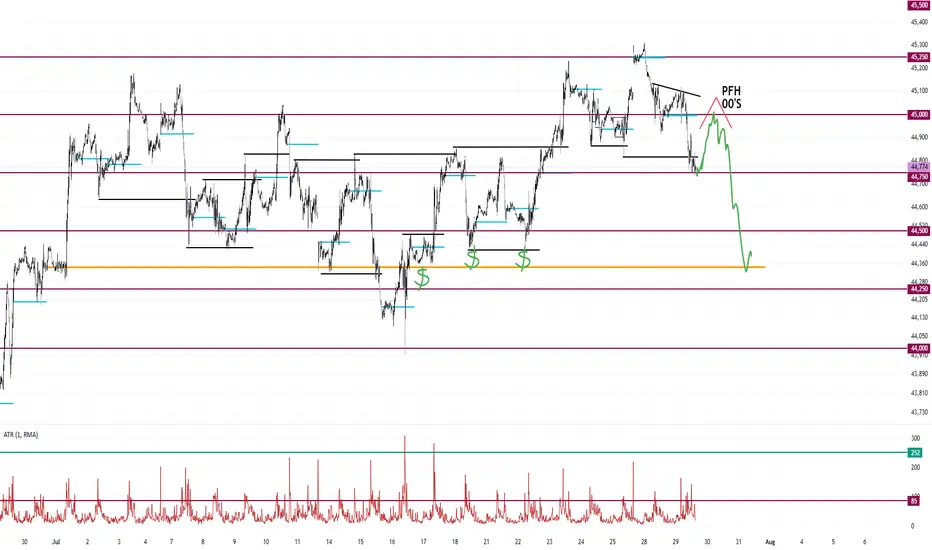
Peak Formation High Into Double Zero's Dump to Monthly OpenLooking for a peak formation high to form under the double zeros.
The market is most likely targeting the liquidity sitting around the monthly open.
I don't see any support until the market takes out some of these lows. Maybe at 44,250.
Highlighted in red brush is every peak formation high formed this month.
United Health - The perfect time to buy!⛑️United Health ( NYSE:UNH ) finished its massive drop:
🔎Analysis summary:
Over the past couple of months, United Health managed to drop an incredible -60%. This drop however was not unexpected and just the result of a retest of a massive resistance trendline. Considering the confluence of support though, a bullish reversal will emerge quite soon.
📝Levels to watch:
$250
SwingTraderPhil
SwingTrading.Simplified. | Investing.Simplified. | #LONGTERMVISION

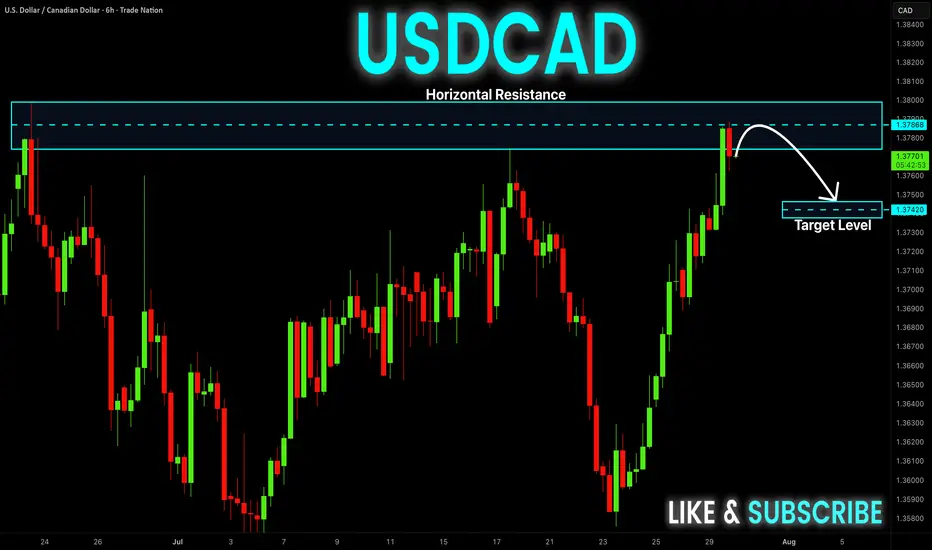
USD-CAD Short From Resistance! Sell!
Hello,Traders!
USD-CAD went up and
Retested a horizontal
Resistance of 1.3800
From where we are
Already seeing a local
Bearish pullback and
As we are locally bearish
Biased so we will be
Expecting a local move down
Sell!
Comment and subscribe to help us grow!
Check out other forecasts below too!
Disclosure: I am part of Trade Nation's Influencer program and receive a monthly fee for using their TradingView charts in my analysis.
Bitcoin - The cycle is just starting!⚔️Bitcoin ( CRYPTO:BTCUSD ) just created new highs:
🔎Analysis summary:
Bitcoin is currently - especially with the new all time high breakout - just perfectly following previous cycle behavior. Since there is no real resistance above current price, apart from psychological levels, I do expect a substantial rally back to the upper channel resistance trendline.
📝Levels to watch:
$300.000
🙏🏻#LONGTERMVISION
Philip - Swing Trader

Dogecoin - It is all totally expected!🐶Dogecoin ( CRYPTO:DOGEUSD ) will break out soon:
🔎Analysis summary:
Just this month, Dogecoin perfectly retested a significant confluence of support and is starting the expected rejection. With bullish momentum picking up, there is a very high chance that Dogecoin will break the all time high in the near future.
📝Levels to watch:
$0.5
🙏🏻#LONGTERMVISION
SwingTraderPhil

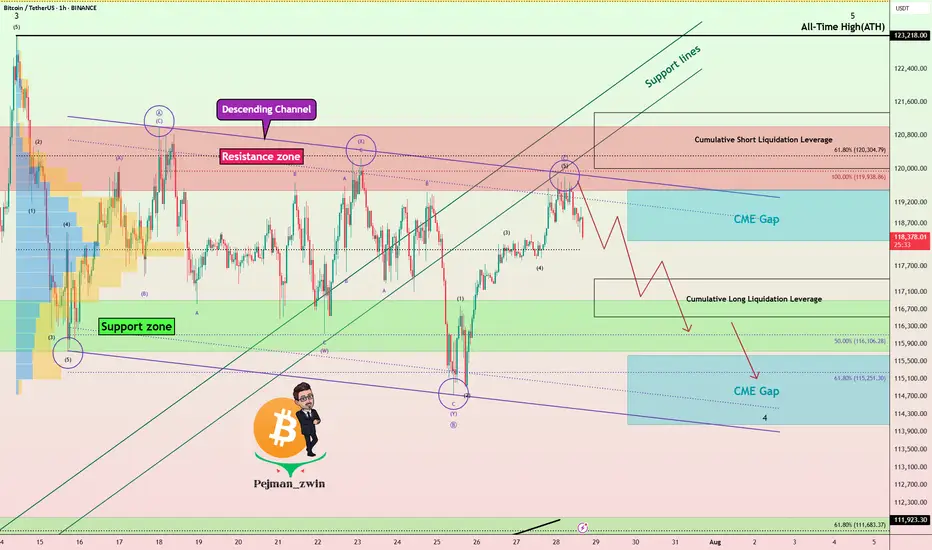
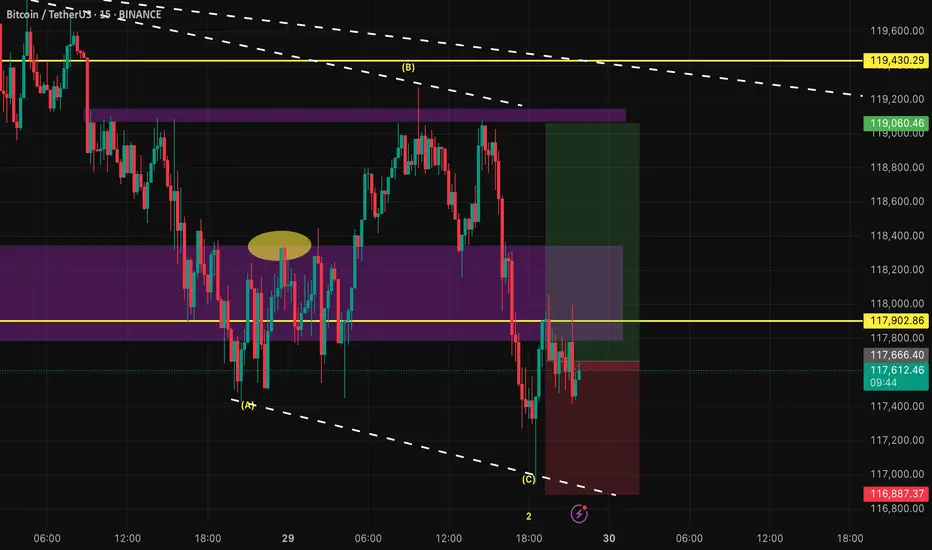
Bitcoin Rejected Near $120K – Bears Wake Up!First of all, I have to say that Bitcoin’s movements over the last 12 days have been a bit difficult to trade , generally, the hardest market to make a profit in is the range market with a swing movement .
Bitcoin( BINANCE:BTCUSDT ) is currently trading near the Resistance zone($121,000-$119,500) , Cumulative Short Liquidation Leverage($121,336-$120,000) , and the upper line of the descending channel .
Since Bitcoin has lost support lines , we can consider this increase in Bitcoin over the last two days as a pullback to the support lines(broken) . Do you agree with me!?
In terms of Elliott Wave theory , it appears that Bitcoin is still completing the main wave B. The main wave B is a Regular Flat(ABC/3-3-5) . The structure of the microwave B of the main wave B was a Double Three Correction(WXY) .
Additionally, the SPX 500 index ( SP:SPX ), which Bitcoin is correlated with , is poised for a correction in my opinion, which could also impact Bitcoin .
Also, unlike previous Mondays, MicroStrategy has NOT purchased Bitcoin , and the company currently holds 607,770 BTC .
Old Bitcoin wallets also seem to be waking up to the fact that they can create movements in the crypto market . " In recent days, 471,867.8 BTC worth $56.39 million have been transferred from old wallets from 2012 to 2017 . ".
I expect Bitcoin to decline to at least the Support zone($116,900-$115,730) and fill the CME Gaps in the coming hours .
New CME Gap: $119,500-$118,295
CME Gap: $115,060-$114,947
Cumulative Long Liquidation Leverage: $117,401-$116,615
Please respect each other's ideas and express them politely if you agree or disagree.
Bitcoin Analyze (BTCUSDT), 1-hour time frame.
Be sure to follow the updated ideas.
Do not forget to put a Stop loss for your positions (For every position you want to open).
Please follow your strategy and updates; this is just my Idea, and I will gladly see your ideas in this post.
Please do not forget the ✅' like '✅ button 🙏😊 & Share it with your friends; thanks, and Trade safe.
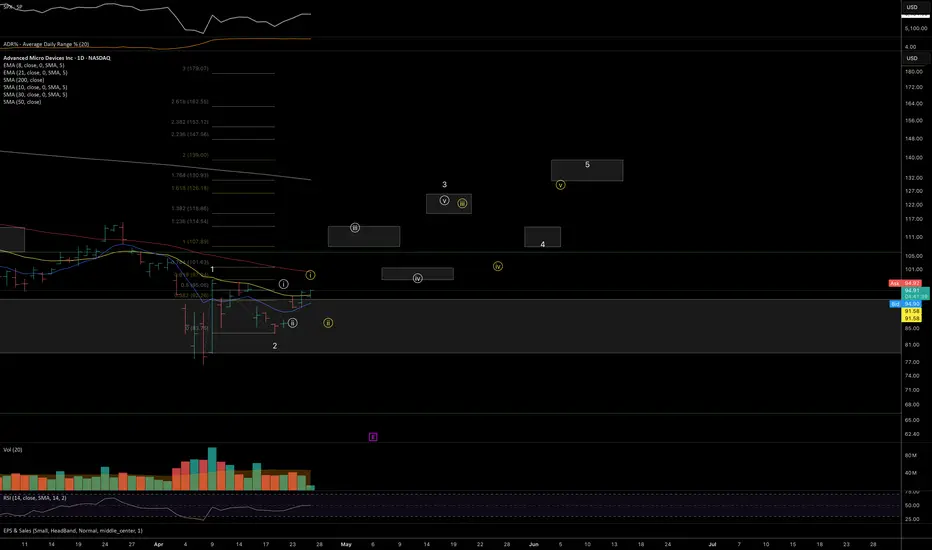
AMD: Potential Mid-Term Reversal from Macro SupportPrice has reached ideal macro support zone: 90-70 within proper proportion and structure for at least a first wave correction to be finished.
Weekly
As long as price is holding above this week lows, odds to me are moving towards continuation of the uptrend in coming weeks (and even years).
1h timeframe:
Thank you for attention and best of luck to your trading!
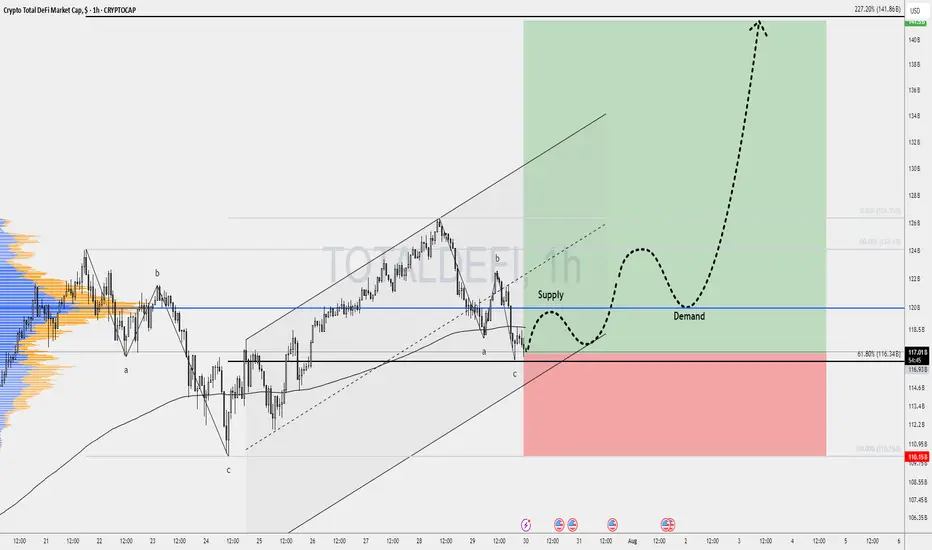
DeFi’s Make-or-Break MomentThe spotlight today is on TOTALDEFI, an index that could become one of the most exciting charts in the crypto market.
While many altcoins look heavy under selling pressure, TOTALDEFI is holding firmly at the 61.8% Fibonacci support near 116B. This zone is often a turning point where strong reversals begin. If the level continues to hold, we might see a 20% move to the upside, signaling renewed strength in the DeFi sector.
This price action could be a sign that decentralized finance projects are ready to lead the next market phase.
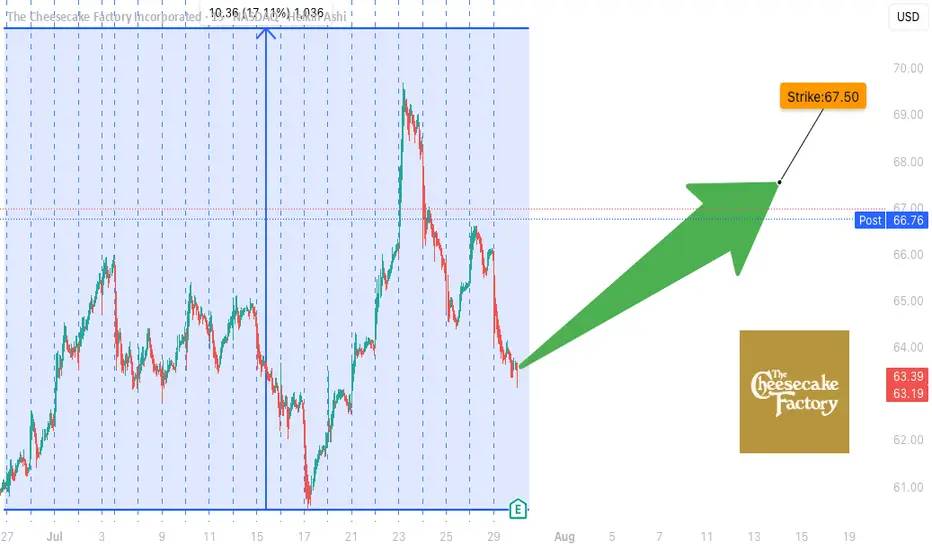
CAKE Earnings Trade Setup (2025-07-29)
**🍰 CAKE Earnings Trade Setup (2025-07-29)**
🎯 **Bullish Bias** | Confidence: **72%**
💡 **Historical Beat Rate: 88%** | Strong pre-earnings drift
**📊 TRADE DETAILS**
• **Instrument**: \ NASDAQ:CAKE
• **Strategy**: Buy CALL
• **Strike**: 67.50
• **Entry**: \$1.45
• **Target**: \$2.90+
• **Stop**: \$0.72
• **Expiry**: 2025-08-15
• **Timing**: Pre-earnings close (AMC)
**📈 Setup Rationale:**
✅ History of positive earnings surprises
✅ Stock above key MAs with room to run
⚠️ Margin pressure & mixed options flow = manage risk closely
**🔥 Risk/Reward: \~2:1+**
Cut early if earnings miss. Target 200%+ return on surprise beat.
$GBPCAD: Overall Bearish, Short Term Upside
➡️ Downside motive wave: We are finishing 5 waves at strong blue support zone. I don´t see enough momentum to break this zone at the moment.
➡️ Expect a recovery: Price will probably make a short-term recovery, with a high probability of reaching the middle of the range at 1.85-1.86.
➡️ After this recovery (wave 2 or B), expect further downside, potentially breaking blue support.

Bitcoin Dominance: 2021 vs. 2025History repeats itself... 🔄
🧘♂️ The most important thing is to stay calm and approach this with a clear head. Don’t assume that just because #altcoins did a 2x in a month, they’ll immediately do another 10x without any pause or correction.
🪜 Markets move in stages — two steps up, one step down. That’s exactly how it played out in 2021: after the first major BTC.D drop, we spent two months in a range, which turned out to be the final pause before the altseason. 🔥
I’m confident we’ll see something similar now — and don’t forget, August is traditionally the slowest month of the year. On top of that, the Dollar Index (see this morning’s update) looks ready for a rally, which could temporarily stall crypto momentum.
I’m not trying to scare anyone — just encouraging you to assess the situation rationally and avoid falling into FOMO. 🐋 Patience pays off !

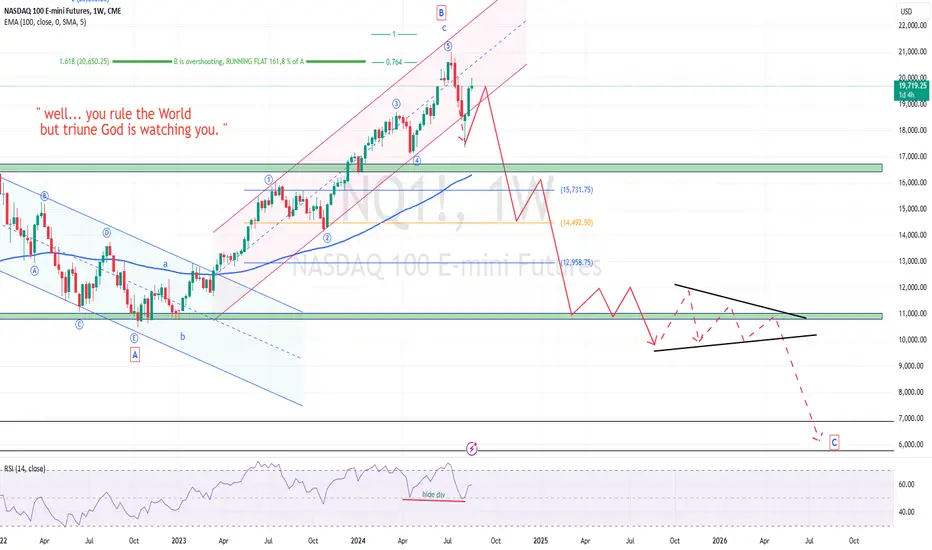
Lord Jesus Christ, Son of God, have mercy on us sinnersare you ready... ?
In the name of the Father, and of the Son, and of the Holy Spirit. Amen.
Glory to Thee, our God, glory to Thee.
O Heavenly King, O Comforter, the Spirit of Truth, who art in all places and fillest all things; Treasury of good things and Giver of life, come and dwell in us and cleanse us from every stain, and save our souls, O gracious Lord.
Holy God, Holy Mighty, Holy Immortal, have mercy on us.
Glory to the Father, and to the Son, and to the Holy Spirit: now and ever and unto ages of ages. Amen.
All-holy Trinity, have mercy on us. Lord, cleanse us from our sins. Master, pardon our iniquities. Holy God, visit and heal our infirmities for Thy name's sake.
Lord, have mercy.
Glory to the Father, and to the Son, and to the Holy Spirit: now and ever and unto ages of ages. Amen.
Our Father, who art in the heavens, hallowed be Thy name: Thy kingdom come; Thy will be done on earth, as it is in heaven. Give us this day our daily bread; and forgive us our trespasses, as we forgive those who trespass against us; and lead us not into temptation, but deliver us from the evil one.
For Thine is the kingdom, and the power, and the glory, of the Father, and of the Son, and of the Holy Spirit: now and ever and unto ages of ages. Amen.
In one, holy, catholic, and apostolic Church
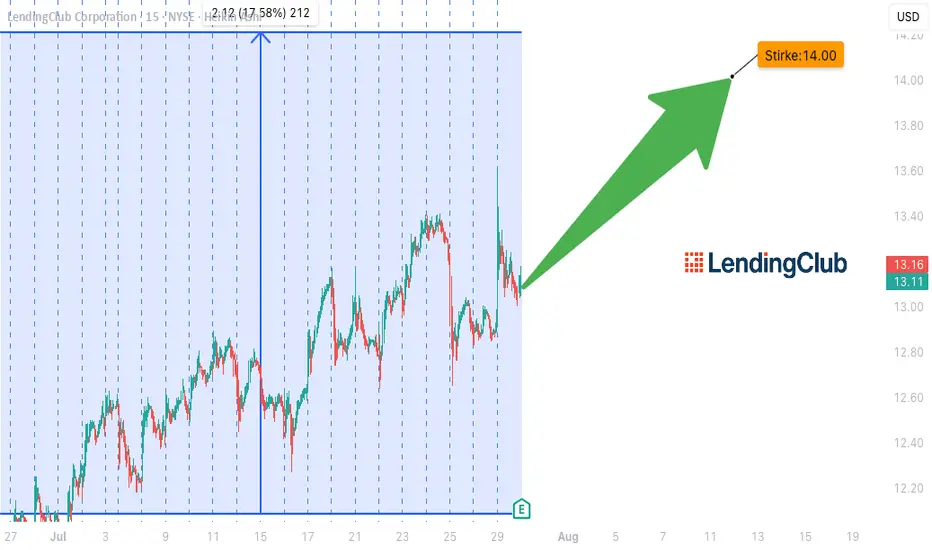
LC EARNINGS PLAY – STRIKE WHILE IT'S HOT!**
🚨 **LC EARNINGS PLAY – STRIKE WHILE IT'S HOT!** 🚨
📅 **Earnings Season Heat Check: LC | Jul 29**
💰 **Positioning for a Post-Earnings POP!**
---
🔥 **The Setup:**
LC’s earnings momentum is real –
📈 TTM Rev Growth: **+13.1%**
💹 EPS Surprise Rate: **150% avg**
📊 75% Beat Rate History
💵 Analyst Consensus: **Strong Buy (1.8/5)**
---
📉 **Technical Tailwind:**
✅ Price above 20D + 200D MA
✅ RSI: **60.07** – room to run
📈 Volume Spike: **+61% above 10-day avg**
🚀 Options flow targeting **\$14 CALLS** w/ OI: **864** / Vol: **737**
---
📌 **TRADE IDEA**
🎯 Buy: **\$14.00 Call @ \$0.70**
📆 Exp: **Aug 15, 2025**
🎯 Target: **\$2.10** (Risk/Reward = 1:3)
🛑 Stop: **\$0.35**
---
⚠️ **Earnings Risk:** IV crush real.
🎯 Exit within 2 hours **post-EPS** if no move.
Macro tailwinds + financial sector rotation = 🚀 fuel.
**Beta = 2.45** → Big move potential incoming!
---
🧠 Confidence Level: **75%**
⏰ Timing: Pre-Earnings Close
🧾 Model-Driven Strategy | No Hype, Just Edge.
---
💥 Let’s ride the LC earnings wave – \$15+ in sight! 💥
\#LendingClub #LC #EarningsPlay #OptionsTrading #TradingView #StocksToWatch #CallOption #Fintech #SwingTrade #EarningsHustle #BullishSetup #IVCrush #EarningsGamma #ShortTermTrade
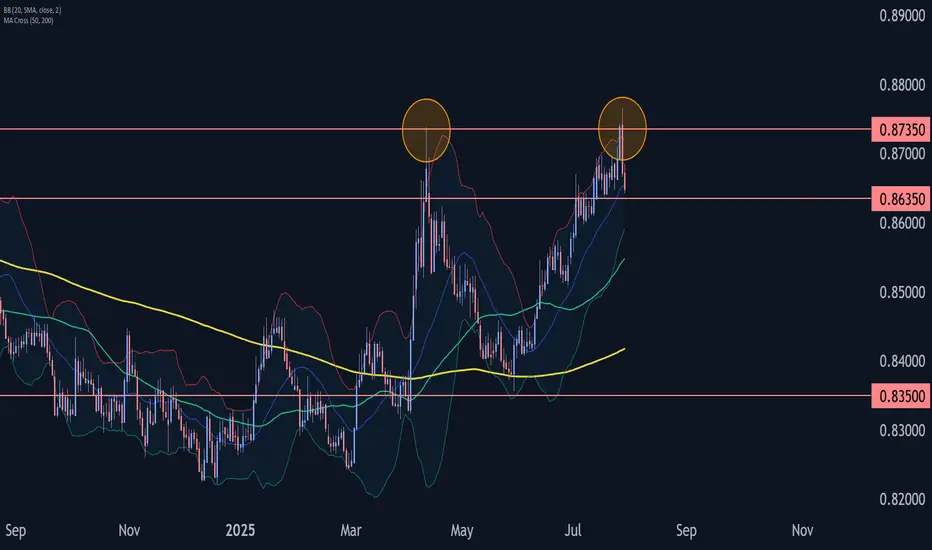
EURGBP Wave Analysis – 29 July 2025- EURGBP reversed from the resistance zone
- Likely fall to support level 0.8635
EURGBP currency pair recently reversed down from the resistance zone between the multi-month resistance level 0.8735 (which stopped sharp wave (A) in April) and the upper daily Bollinger Band.
The downward reversal from this resistance zone created the daily Japanese candlesticks reversal pattern Dark Cloud Cover.
Given the strength of the resistance level 0.8735, EURGBP currency pair can be expected to fall to the next support level 0.8635 (low of the previous minor correction ii).
Will gold continue to fall on July 29:
Comprehensive analysis of the gold market and trading strategy recommendations
News analysis
Short-term support factors
Weakened US dollar: The market is in a wait-and-see mood before the Fed's interest rate meeting, and the US dollar bulls are temporarily suspended, providing support for interest-free assets such as gold.
Safe-haven demand: Policy uncertainty (such as the Fed's interest rate decision) may trigger a short-term return of funds to gold.
Repressive factors
Trade situation easing: The US-EU tariff agreement, US-Japan and US-China trade progress boost risk appetite and weaken the safe-haven appeal of gold.
Bull-bear game: Gold is currently at a balance between "macro game" and "technical adjustment", and needs to wait for the FOMC statement and economic data (GDP, PCE) to guide the direction.
Technical analysis
Long-term trend (monthly/weekly)
Top signal appears: 3 consecutive months of long upper shadows (April-June). If the long upper shadow is closed again in July, it may confirm that the bears are dominant, and the market may drop to the 3000-2950 area in the future.
Key resistance: 3400-3500 area is a historically strong pressure. Even if the Fed cuts interest rates to stimulate the rise, it may form a "lure to buy" and then reverse.
Short-term key position (daily/4 hours)
Bull-short watershed: 3350 is the short-term strong and weak boundary. If it breaks through, it will look up to 3370-3405; if it is under pressure, it will look down to 3330-3290.
Oscillation characteristics: The recent long-short continuity is poor (such as last week's sharp rise and then a sharp drop), so be wary of repeated washes.
Today's operation strategy
Short-order opportunity
Entry area: 3330-3340 (aggressive investors can arrange in batches), stop loss above 3350.
Target position: 3290-3280, look at 3245 after breaking down.
Long-order opportunity
Pullback support: 3290-3280 light position to try long, stop loss below 3270, target 3310-3320 (short-term rebound).
Breakthrough follow-up
Break above 3350: Wait and see if it is a false breakthrough. If it stabilizes, you can buy short-term to 3370-3405 (need to cooperate with the Fed's dovish signal).
Break below 3280: Be cautious when chasing shorts, avoid low-level sweeps, and pay attention to the support of 3245.
Risk warning
Federal Reserve decision: If the interest rate is cut but the "hawkish expectations" are released (such as the subsequent suspension of interest rate cuts), gold may rise and fall.
Data impact: If GDP/PCE is stronger than expected, it may strengthen the US dollar and suppress gold prices.
Summary: At present, gold is in a volatile bearish pattern. It is recommended to sell short at the rebound high as the main trading idea, and strictly stop loss. Conservatives can wait for the trend to become clear after the Fed's decision before making a layout.

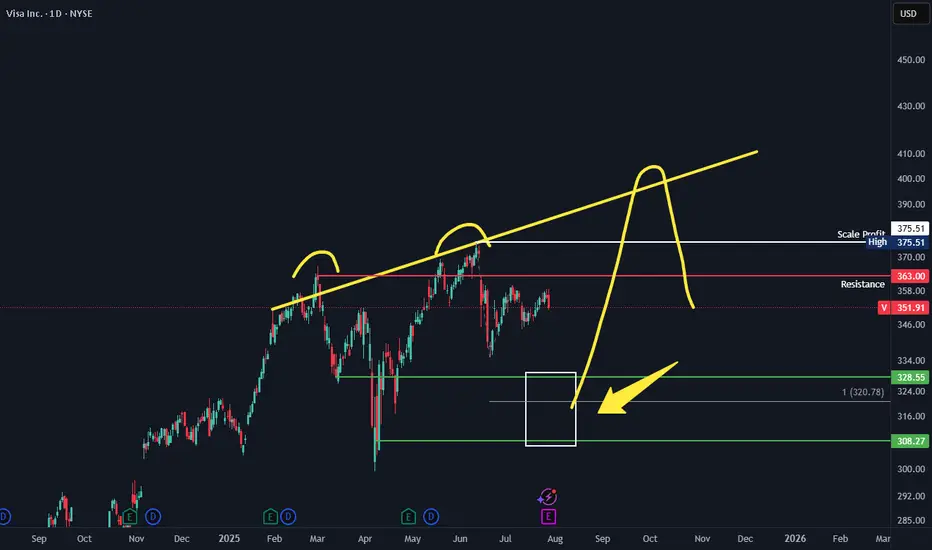
VISA 3 peaks and a dump. Should VISA pullback to the lower support zone. Look to swing long back to ATH with the big target of around 400 where 1 can look to swing short. The typical 3 peaks and a dump setup.
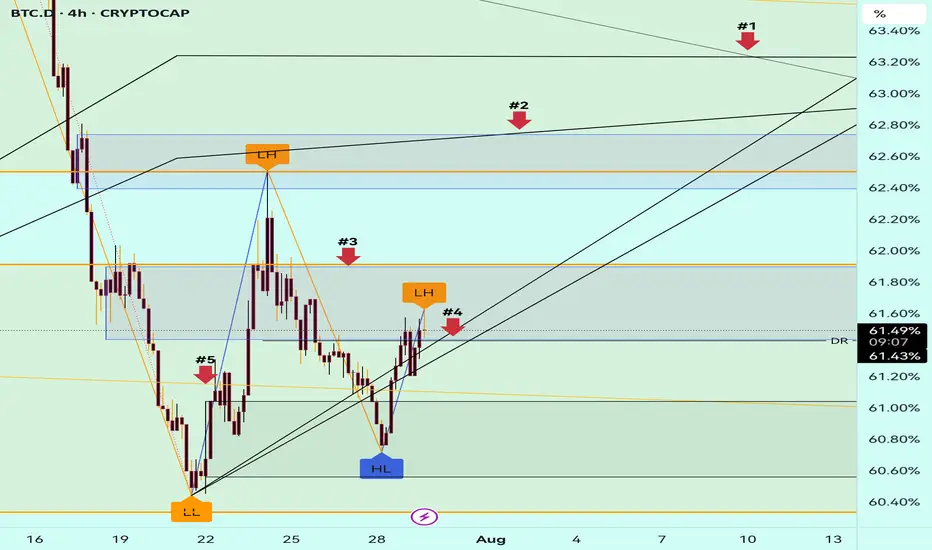
#BTC.D Update 29.07.2025BTC Dominance is trying to break above the black resistance lines, but honestly, I don't see enough strength yet to confirm a full reversal. On the daily timeframe, it’s still holding a strong downtrend structure. 🟥
🔍 If price manages to break above Arrow #4, we still have a key resistance at Arrow #3, which won’t be easy to pass.
On the lower timeframes, there are already a few bearish signs forming — but nothing solid enough yet for confirmation.
⚠️ That’s why I prefer to wait for today's daily candle to close before making any new decisions. There's also a chance BTC.D may retest Arrow #3 before reversing again.
💡 What does this mean for us?
It’s not time to jump in just yet — but the moment is getting closer, Insha Allah. If this dominance starts to turn down again, we could soon see ALTCOINS shine once more! 🌟
📈 Be ready. Stay focused. Patience pays in this game. 🚀
Altseason might just be warming up!
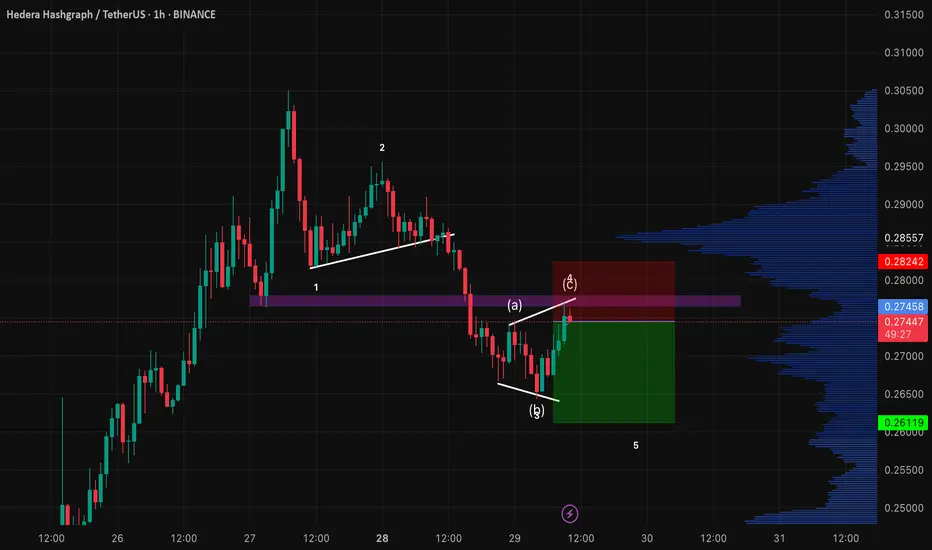
BTCUSD LongWe´re in a bigger bullish 5wave structure. Right now we´re in the 4th wave and could have completed a ABC correction. On 15min Chart we can see, that we just formed the 1st wave to start the 5th wave in the bigger structure
HBARUSWe´re in a bigger correction in HBAR and I expect a 5th wave in this correction. Right now we´re in the correction of the 4th wave and completed a ABC pattern.