A closer up view of SILJA slighty closer up view of my previously posted SILJ analysis. The yellow could could be off by one degree...in other words the yellow (3) might actually be the teal (3), but either way I see a major move up very very soon...by end of August >$20 imo.
Wave Analysis

USDCHF Signals Wave 3 With Double Bottom!OANDA:USDCHF has not only formed a Double Bottom Pattern but also may be generating a potential Elliot Impulse Wave!
Bulls are giving the April & June Lows of .8038 - .8088, another go for a second time today after surpassing the first attempted High created July 17th to break above the level.
So far Price today has broken above July 17th Highs and if Bulls are able to hold this level, this would Confirm:
1) A Breakout of the Double Bottom
2) Wave 3 continuing the Impulse Wave in the Elliot Wave Theory!
The Higher Low @ .79106 created on July 25th, broke the downtrend structure as a 78.6% retracement of the Lower Low @ .78719 created July 1st which was a new 14 Year Low, finishing Wave 2 and initiating Wave 3 of the Impulse Wave.
The Extension of Wave 3 typically will end at the 1.236% or 1.618% level which gives us 2 potential Price Targets to start:
Price Target 1) .81479 - 1.236%
Price Target 2) .82213 - 1.618%
Once Wave 3 has ended, we will look for opportunities at the Wave 4 - Wave 5 juncture!

XAUUSD idea 29/07/25We are waiting for our asset to reach our action zone, and based on the reaction, we’ll decide on our next moves.ALWAYS WAIT FOR A CONFIRMATION TO SEE IF THE PRICE VALIDATES THE ZONE.and you what is your vision of the EURUSD its interests me! i wait you in the commentary

Call me crazy....but SILJ looks explosive here...In my opinion we are seeing a series of 1,2's on SILJ which are about to result in a MAJOR move to the upside. IF I am correct then we will see $20+ in very short time...by the end of August!

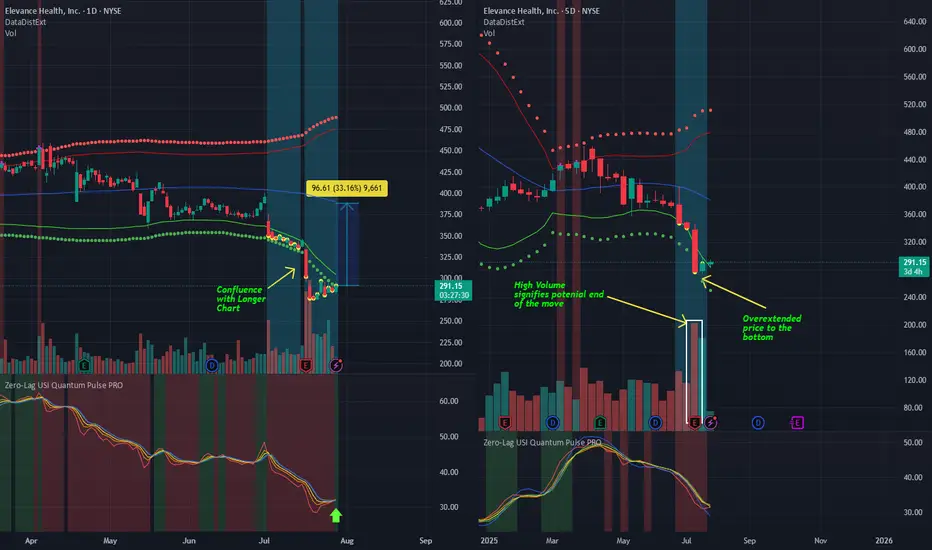
Potential 33% gain in ELVELV has a potential for a reversal for potentially 33% gain.
Using the Data Distribution with Extreme Clusters custom indicator, we can see that the stock is overextended on both the 5D chart (longer term) and 1D (shorter term) chart.
The last weekly bar ended up on a very high volume. Looking at the trends, one thing that is often noticeable, is that moves end and begin on large volume. Since it is down 40% off its highs, coupled with large volume, there is a possibility that the stock will reverse.
Zero-Lag USI on 1D chart is showing a buy signal as the background changed to green, while Zero-Lag USI on 5D chart is showing a black background, which means that there is a possibility that momentum of the stock may change.
Niagen Breaks Out: Eyes on $15–17 as Momentum TargetsNiagen Bioscience ( NASDAQ:NAGE ) is in vertical price discovery mode, pushing into new highs with strong trend momentum, but with RSI at 78.66 and a flattening MACD histogram, it’s nearing a classic short-term exhaustion zone
Technical Breakdown
1. Price Action – Parabolic Advance
Price is climbing in a near-vertical channel from the $5–6 range in March to now $12.95 — a 2x+ move in just a few months. No clear resistance above = price discovery, but these steep climbs often invite sharp mean reversion when momentum fades. No signs of topping yet, but late buyers risk being exit liquidity if volume dries up.
2. RSI – Deep Overbought
RSI is at 78.66, right near the extreme threshold (>80) where pullbacks are common. Note the last RSI spike above 80 in April led to a sharp correction. If RSI rolls while price makes new highs, that’s bearish divergence risk — an early signal of topping.
3. MACD – Still Positive, But Slowing
MACD lines are bullishly stacked, but the histogram is flattening — a signal that momentum is stalling. A bearish MACD crossover here would confirm that this rally leg is losing energy.
4. Volume – Watch Closely
Volume data is light on this chart, but recent candles don’t show a volume climax — suggesting this may not be euphoric yet, but it’s close. One high-volume reversal candle near the top could flip sentiment fast.
Fibonacci Extension Setup
We'll anchor the extension to the March 2025 low and the recent pre-breakout high, using the most relevant and aggressive up-leg:
Swing low: ~$5.00 (March 2025)
Swing high: ~$11.50 (May 2025)
Pullback low: ~$9.00 (early May dip before this new breakout)
Extension Targets
1.0x $11.50 Already cleared (prior high)
1.272 $13.25–13.50 Short-term upside target, within reach
1.618 $15.00–15.25 Primary extension / high-conviction zone
2.0 $17.00 Stretch target in euphoric continuation
These levels line up well with psychological round numbers and the measured strength of the rally.
What Would Validate These Targets?
RSI stays above 65–70 (healthy overbought, not divergent)
MACD avoids bearish crossover and histogram turns back up
Breakout continuation above $13.25 with volume
What Would Invalidate?
Sharp rejection from $13.25 or $14 with divergence
RSI dropping below 65 while price stalls
Bearish MACD crossover + red candle volume spike

Soluna Holdings Inc.Stock nearly completed wave b of Expanding Flat correction.
Side C will start up soon 🔊
Target price above 9 $ .
Highly recommended for Buying 👌 and wait .

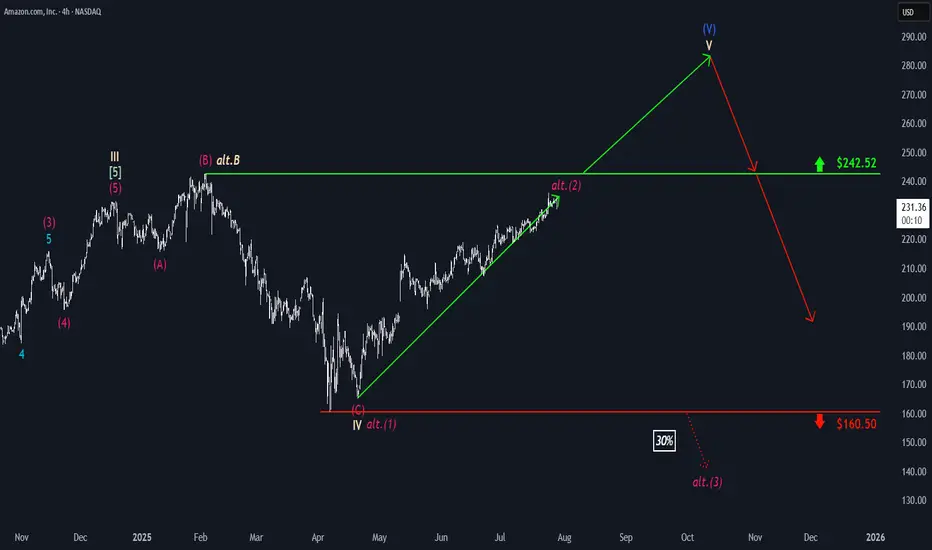
Amazon: Extending the Rally...Amazon maintaines its strong upward momentum. As this trend continues, the large blue wave (V) is expected to complete well above the resistance level at $242.52. However, an alternative scenario with a 30% probability remains on the table: in this case, the magenta corrective wave alt.(2) would peak below the $242.52 resistance, and a significant pullback below support at $160.50 would be anticipated afterward. In this scenario, the high of beige wave alt.B would have been set at $242.52, after which the stock would enter the broader downward movement of wave alt.C .
📈 Over 190 precise analyses, clear entry points, and defined Target Zones - that's what we do (for more: look to the right).
EURUSD D1 & H4 (Wave Analysis) - 29/7/2025EURUSD D1 & H4 (Wave Analysis) - 29/7/2025
please see the chart
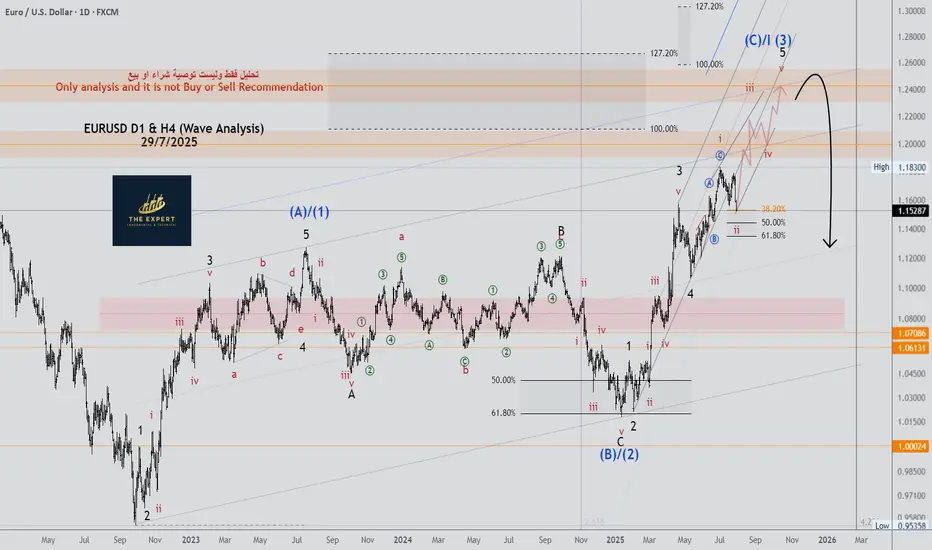
H4 Analysis. It's sell or buy let's see?
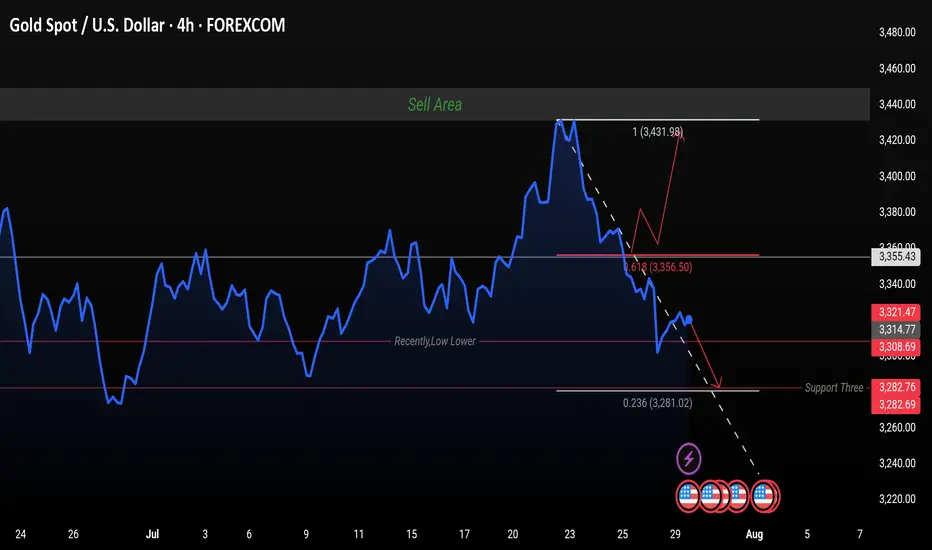
Gold is currently trading near 3323 after a recent sharp drop from the 3431 high. The price is respecting the downtrend line and has tested the 0.236 Fibonacci retracement at 3281 as support.
📉 Bearish Outlook:
If the price fails to break above 3314–3325, we could see a continuation toward the 3282 and possibly 3281 support zone.
📈 Bullish Scenario:
A break and close above 3355 (Fib 0.618) could push the market toward the 3431 resistance zone (Sell Area).
Key Levels to Watch:
Resistance: 3355 / 3431
Support: 3314 / 3308 / 3282
XAUUSD SELL Don’t Miss This MoveAnalyzing market structure and liquidity using Price Action and Smart Money Concepts. Focuse
d on key supply/demand zones and institutional order flow

PENGU Bearish DivergenceBINANCE:PENGUUSDT
Support Levels: 0.027229 (recent low, first target for a drop).
0.007599 (deeper support, longer-term target).
Resistance: 0.046859 (recent high, potential stop loss level).
Trade Setup:
Target 1: 0.027229 (short-term, ~25% drop).
Target 2: 0.022597 (mid-term, ~50% drop if bearish trend strengthens).
Target 3: 0.016001 (long-term, ~25% drop).
Stop Loss: 0.007599 (above recent high, ~25% above current price).
RSI Analysis: The RSI shows a bullish divergence (price making lower lows while RSI makes higher lows), suggesting potential upward momentum. Current RSI is around 70.30, nearing overbought territory (>70), so caution is advised.

GOLD - One n Single Area, what's next??#GOLD... market just reached at his ultimate area as we discussed in our last week analysis and in Friday analysis as well.
The area is 3309-10
Keep close and don't be lazy here.
NOTE: we will go for cut n reverse below 3309 in confirmation.
Good luck
Trade wisley

Please check how to trade later.Since the release of the trading strategy, I have been able to accurately predict market trends. I am also grateful to so many brothers for following me. My premium privileges are about to expire. I will put the subsequent trading content in the group. If any brothers are interested, they can find me through 🌐. As for how to deal with the future market, I have stated the extraordinary situation and will patiently wait for the rebound of gold. At the same time, I will pay attention to the impact of the Sino-US trade talks.

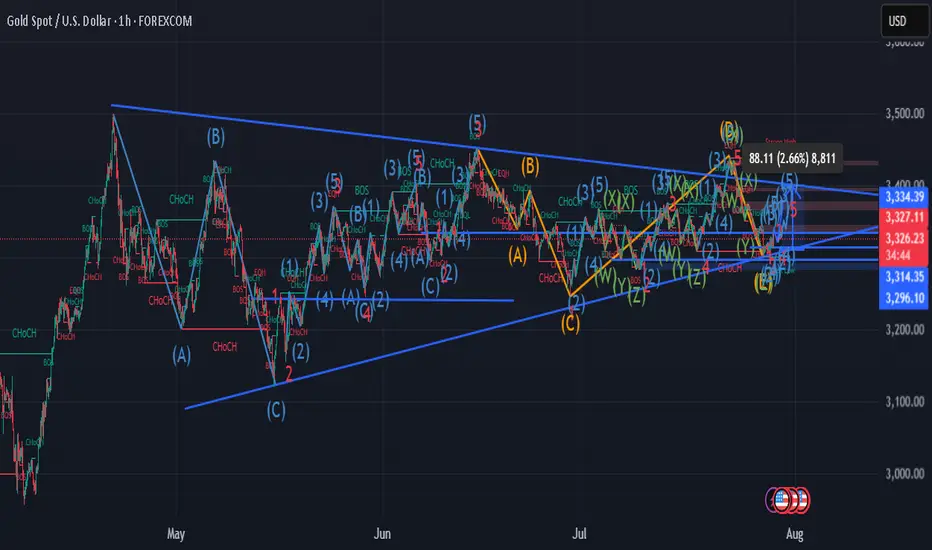
technical analysis- (xau-usd) (H1)This chart highlights a large symmetrical triangle formation, with an internal WXYXZ corrective structure blended with impulsive Elliott Waves (1)-(5). The price action is marked by key structural shifts: CHoCH, BOS, and EOH, signaling trend reversals and liquidity grabs.
📌 Price recently bounced off the ascending trendline, forming a potential wave (2) low, suggesting a bullish move into a wave (3) impulse.
🔼 Short-term target points to a revisit of the strong resistance zone around 3,400–3,410.
📊 Key Setup:
• Pattern: Symmetrical Triangle
• Wave Count: Corrective WXYXZ + impulsive structure in progress
• Signals: Bullish CHoCH + BOS confirmation
🎯 Trade Idea:
• ✅ Direction: BUY
• 🎯 Take Profit (TP): 3,400 – 3,410
• 🔻 Stop Loss (SL): 3,296
🔁 Sideways range compression sets up ideal conditions for short-term swing or breakout scalps.
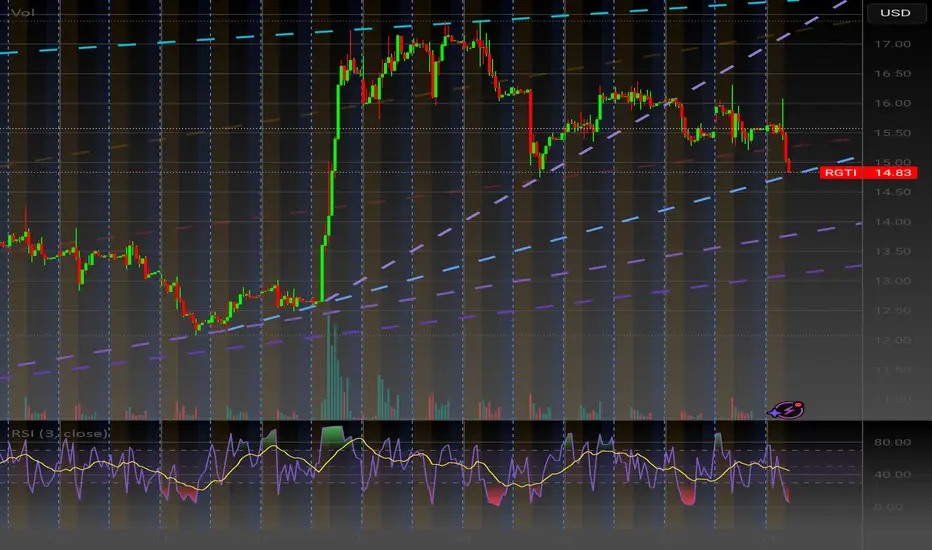
Chapter 3: The Big Gap Fill (RGTI) Chapter 3: The Big Gap Fill
After the luminous victory of the Alienoid Bulls in Chapter 1, the quantum lattice began to warp. Unbeknownst to them, the Mech Bears had not been defeated—only waiting, recalibrating, and evolving.
Hidden in the deep recesses of the 7D stackspace, a new war protocol had been activated: Project GAP-FILL.
Forged from the remnants of collapsed timelines and corrupted trading algorithms, the Mech Bears returned with upgraded plasma scythes, vortex cannons, and distortion shields—engineered specifically to slice through fractal bullish momentum.
Their mission: rupture the vertical trajectory of the Bulls by targeting the exposed gap at $14.87 .
And they struck with precision.
The plasma walls cracked. Alienoid defenders were torn apart, pixel by pixel. Charts trembled. RSI indicators bled below the midline. Volume spikes echoed like sirens through algorithmic space.
The Bulls fought valiantly, but their entangled rally code had become predictable. Their once-pristine yellow pathways had begun to fade under the purple-fanged teeth of the Bears' synthetic sell walls.
$14.87 was now no longer just a price—it was a battlefield scar.
It pulsed in red, flickering like a dying star, as algorithms calculated:
→ Bounce? An emergency quantum surge from sector Theta-12 might catch the fall.
→ Or further dip? Toward the gravitational pull at $13.80... or even deeper, toward the haunted zone beneath $12.60.
Whispers from the quantum feed rippled across timelines:
“If the Bulls can't re-stabilize above $14.87, the mech horde will breach the next support sector.”
The volume candles crackled, RSI skidded down through 30, and the future became uncertain.
The Alienoid Bulls retreated to regroup, wounded but not broken, preparing for what many called…
The Great Reversal War. NASDAQ:RGTI
BTCUSD Lower Time Frame WavesBase on Wave Analysis BTC is going up to hit 122-124 K area before and then start to fall to 110-112 K area to finish the correction phase

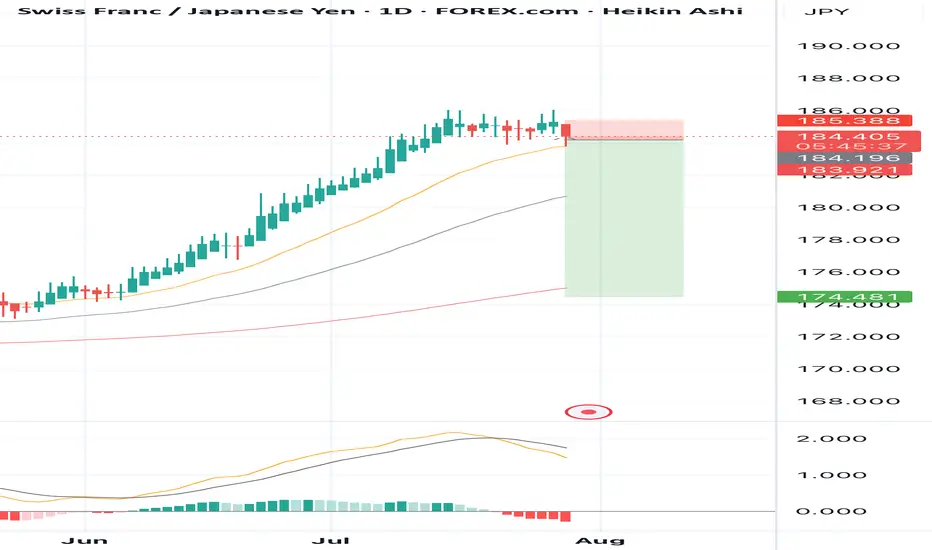
SELL CHFJPY for bullish trend reversal SELL CHFJPY for bullish trend reversal
STOP LOSS : 185.38
Trade trade is based on false breakout and divergence.....
First what is false breakout, A false breakout in Forex occurs when the price breaks through a key level (like support or resistance) but quickly reverses and returns to its original range, often trapping traders who were expecting a continuation of the breakout. It's essentially a false signal, indicating a potential trend reversal or continuation, but the price doesn't follow through....
Secondly what is divergence ,In forex trading, divergence occurs when the price of a currency pair moves in one direction, while a technical indicator (like an oscillator) moves in the opposite direction. This mismatch can signal a potential trend reversal or weakening trend. There are two main types: bullish and bearish divergence.
On this trade we are taking it because we saw regular bearish divergence
Regular Bearish Divergence
In case of Regular Bearish Divergence:
* The Indicator shows Lower Highs
* Actual Market Price shows Higher Highs
We can see a strong divergence on the RSI already and There is a strong trend reversal on the daily time frame chart.....
The daily time frame is showing strength of trend reversal from this level resistance so we are looking for the trend reversal and correction push from here .....
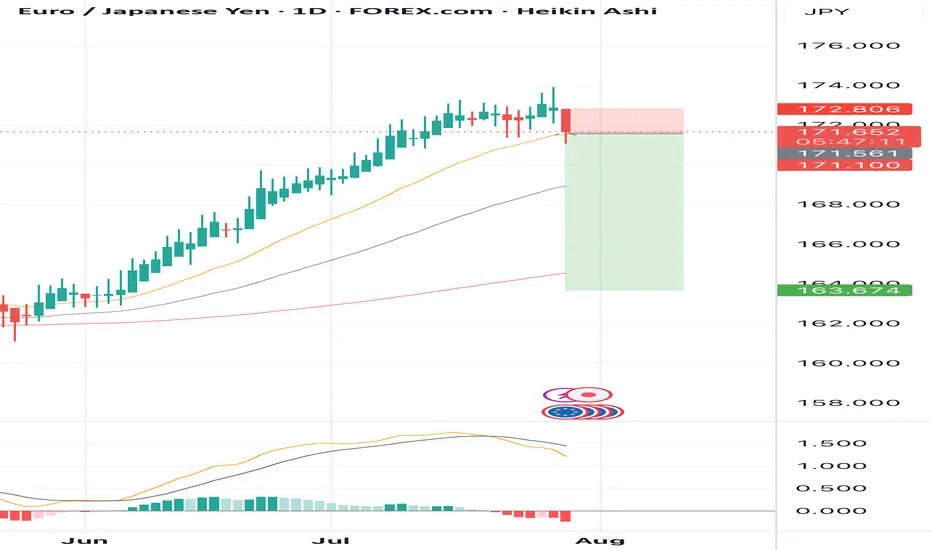
SELL EURJPY for bullish trend reversal SELL EURJPY for bullish trend reversal
STOP LOSS : 172.80
Trade trade is based on false breakout and divergence.....
First what is false breakout, A false breakout in Forex occurs when the price breaks through a key level (like support or resistance) but quickly reverses and returns to its original range, often trapping traders who were expecting a continuation of the breakout. It's essentially a false signal, indicating a potential trend reversal or continuation, but the price doesn't follow through....
Secondly what is divergence ,In forex trading, divergence occurs when the price of a currency pair moves in one direction, while a technical indicator (like an oscillator) moves in the opposite direction. This mismatch can signal a potential trend reversal or weakening trend. There are two main types: bullish and bearish divergence.
On this trade we are taking it because we saw regular bearish divergence
Regular Bearish Divergence
In case of Regular Bearish Divergence:
* The Indicator shows Lower Highs
* Actual Market Price shows Higher Highs
We can see a strong divergence on the RSI already and There is a strong trend reversal on the daily time frame chart.....
The daily time frame is showing strength of trend reversal from this level resistance so we are looking for the trend reversal and correction push from here .....
Weekly trading plan for SolanaLast week BINANCE:SOLUSDT played out perfectly according to our orange scenario. Currently, we're in a correction phase, trading below the key weekly reversal level at $190
Key Observations:
Bullish divergence forming on the hourly chart
But 4-hour chart shows further downside potential
Critical Levels:
Break above weekly pivot + trendline → Targets $220
Failure to reclaim above hourly MAs → Opens path to $160
Trade carefully - this could go either way

SQD/USDT Analysis — False Breakout
This token attempted to break out of a global sideways range, but failed to hold above the key level. A large amount of position closing was observed at that moment.
We are considering a short from the $0.205–$0.227 zone, provided it is retested with a clear reaction.
This publication is not financial advice.

BTC/USDT Analysis — Potential Sideways Range
Hello everyone! This is the daily analysis from the CryptoRobotics trading analyst.
Yesterday, Bitcoin experienced a local reversal. At this point, two zones previously marked by us have been worked out:
Buy zone — $118,300–$117,300
Sell zone — $119,500–$119,000
We now expect continued rotation within the $117,400–$119,800 range, with potential expansion in both directions. The overall context remains positive, so a full breakout to the upside could occur in the near future.
Buy zones:
$116,200–$115,000 (volume anomalies)
$110,000–$107,000 (accumulated volume)
This publication is not financial advice.

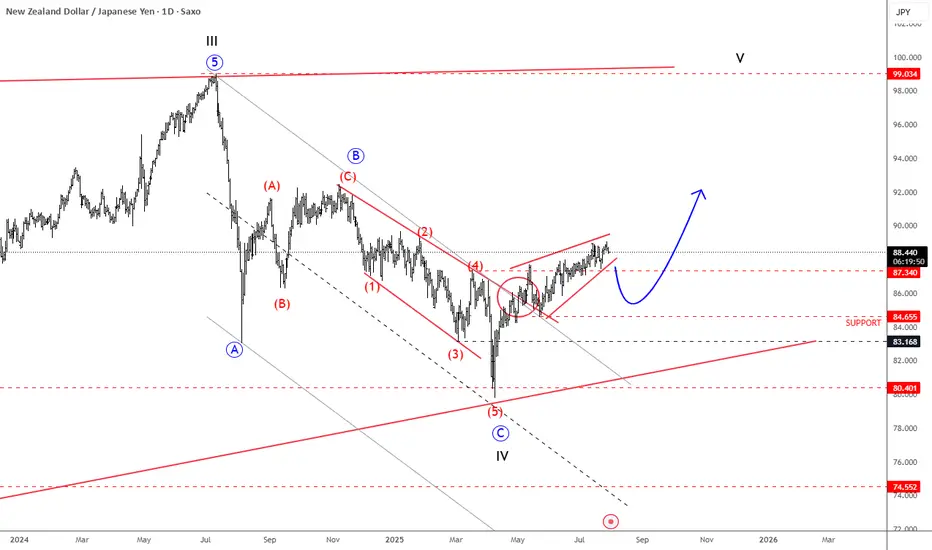
NZDJPY Is Back To Bullish ModeNZDJPY Is Back To Bullish Mode from technical and Elliott wave perspective, as we see it breaking back above trendline after a corrective decline.
NZDJPY is nicely recovering over the last few weeks after a strong rebound from 80.40 support, a key level going back to March 2023. Notice that it’s recovering after a three-wave ABC corrective decline that belongs to a higher degree wave IV correction. Current recovery looks to be in five waves, as a leading diagonal; so its a motive wave structure that already pushed above the 87.34 resistance, which is a strong bullish signal, suggesting more upside ahead. Of course, short-term pullbacks are always possible and welcome, and in that case, the 86 – 84 area could act as a nice support. But overall, we think that sooner or later the pair will target the 90 or even 92 levels, which are still possible this year. Wave V is eyeing even 100 area.