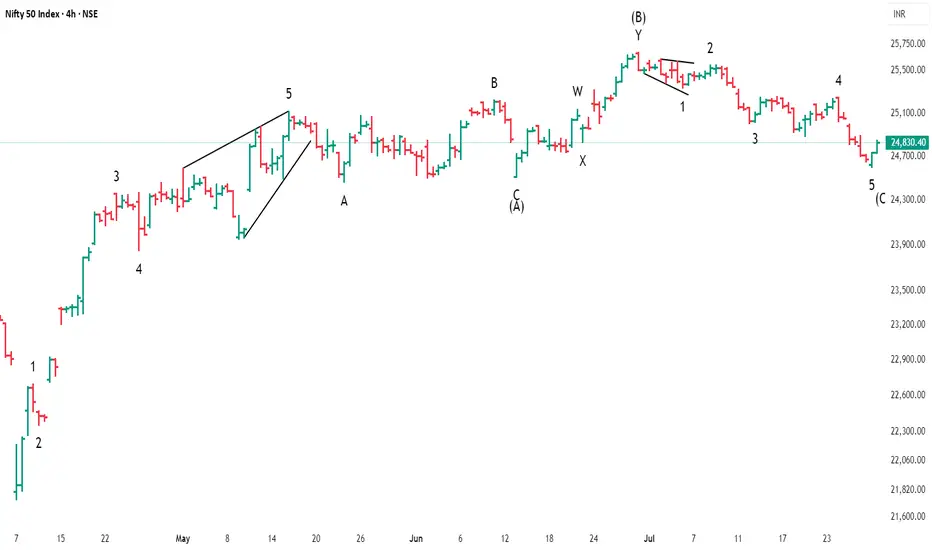
nifty 50 longrecently nifty had completed corrective wave pattern extended flat in near term price may move in impulsive move or complex correction
as on near term price could move in upwards
Wave Analysis
EURUSD BUYEUR/USD retreats below 1.1550 ahead of US data
EUR/USD finds it difficult to stage a rebound following Monday's sharp decline and trades in negative territory below 1.1550 on Tuesday. The US Dollar (USD) preserves its strength ahead of consumer sentiment and employment-related data releases, weighing on the pair.
From a technical point of view, the EUR/USD pair is poised to extend its slump. It keeps falling below a mildly bearish 20 Simple Moving Average (SMA), which provides dynamic resistance at around 1.1690. The 100 SMA, in the meantime, maintains its bullish slope, albeit partially losing its upward strength at around 1.1340. Finally, technical indicators keep heading south well below their midlines, and at multi-week lows, in line with a bearish extension ahead.
The near-term picture shows EUR/USD is oversold and may bounce or consolidate before the next directional move. In the 4-hour chart, technical indicators turned flat at extreme levels, yet it keeps developing below all its moving averages, which skews the risk to the downside. A firmly bearish 20 SMA is crossing below the 100 SMA and aims to extend its slide below a directionless 200 SMA, usually a sign of prevalent selling interest.
SUPPORT 1.15566
SUPPORT 1.15819
SUPPORT 1.15566
RESISTANCE 1.15114

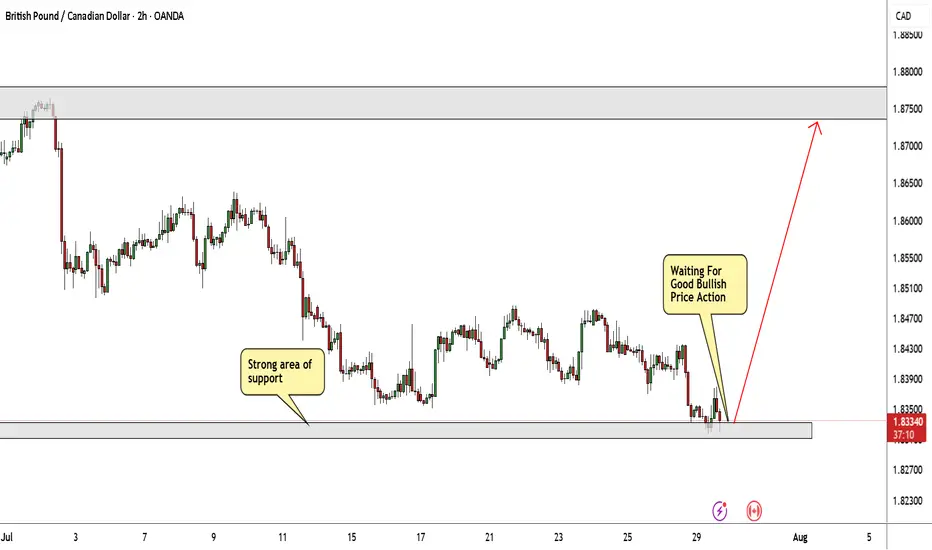
GBP/CAD Possible Buy Trade With Great Pips!The price is standing at a strong area of support that is a historical area of support and pushed the price multiple. I think it can be a great area to enter a buy trade but I have 2 conditions to enter this trade:
1- great bullish price action above an area of support.
2- if we have a daily closure below this area of support this trade will be canceled.
I will commit to these conditions and see what will happen.
Analysis on the 10 Elite PairsYou can follow us for more Analysis(Images and Videos) with Precise definition of the Financial Market.ENJOY!!!

#MYRO/USDT myro road map ( 1 H )#MYRO
The price is moving within an ascending channel on the 1-hour frame, adhering well to it, and is poised to break it strongly upwards and retest it.
We have support from the lower boundary of the ascending channel, at 0.02040.
We have a downtrend on the RSI indicator that is about to break and retest, supporting the upward move.
There is a key support area in green at 0.02020, which represents a strong basis for the upward move.
Don't forget one simple thing: ease and capital.
When you reach the first target, save some money and then change your stop-loss order to an entry order.
For inquiries, please leave a comment.
We have a trend of stability above the Moving Average 100.
Entry price: 0.02040
First target: 0.02140
Second target: 0.02200
Third target: 0.002276
Don't forget one simple thing: ease and capital.
When you reach the first target, save some money and then change your stop-loss order to an entry order.
For inquiries, please leave a comment.
Thank you.

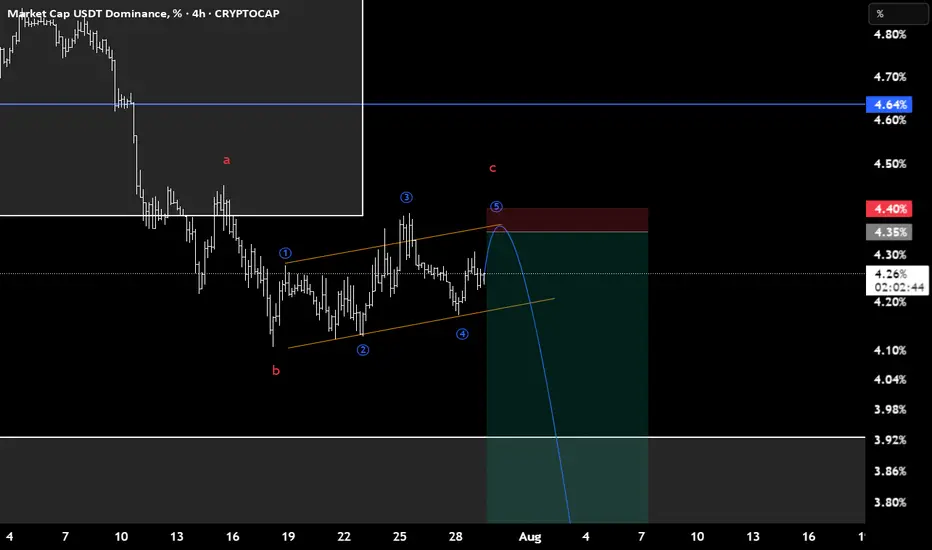
USDT.D(based on NEo wave)I consider this branch as a flat and c wave is the terminal with 3rd extended.
stop loss is 4.4.
Weekly trading plan for EthereumLast week's BINANCE:ETHUSDT price action performed perfectly according to our scenarios - hitting our first target and establishing a new local high. Currently, price remains above the weekly reversal level at $3,751, maintaining potential for an advance toward Resistance #2.
Key Considerations:
While above $3,751 → Resistance #2 remains in play
Break below reversal level + trendline → Likely retest of last week's low
Such breakdown would likely breach both primary support levels
Trade Plan:
Bulls: Watch for continuation above $3,751
Bears: Require confirmed break of trendline + reversal level
As always, confirmation is key - trade the breaks, not the anticipations

BMNR - Gaps to fill before lift offAMEX:BMNR is in competition to become the single largest ETH treasury globally with a slightly different twist - staking for a 2-5% annual return + performance.
Just like NASDAQ:SBET , AMEX:BMNR are diluting their stock to raise capital to additional purchases. This was announced a couple of weeks ago and has not yet concluded.
I expect the gaps to be filled before it really takes off.
Ideally the first gap completes at $7.92 which would be a perfect 61.8 fib retracement (EWT Target), however, if we go this low, I naturally would expect the lower gap to be taken out or at least entered.
Lower gap: $5.10 to $6.13
Higher gap: $7.92 to $12.30
If this plays out, it will be a generational buying opportunity. Like buying NASDAQ:MSTR at $11.
Cathie Wood ( CBOE:ARKK ) also made large purchases of this stock via several of her ETF's. If we follow her trend of poor buying decisions from a technical perspective, then we can certainly expect a large discount on this stock. History has a tenancy of repeating itself.
Not financial advice.

ETHUSDT short positionhi traders
🔻 Short Position Setup – Overextended at Resistance
ETH/USDT is currently trading near a major resistance zone (~$4,080–$4,330), which historically marks the top of the trading range. This level has acted as strong resistance multiple times in the past, and price is now showing signs of overextension after a sharp upward move.
📊 Technical Indicators
RSI (14): Currently overbought at 77.44, with the moving average at 81.65 — levels that have previously led to pullbacks.
Volume: Elevated during the move up, but may begin to taper as momentum slows into resistance.
🧭 Trade Strategy: Short From the Top
Entry Zone: Around current levels near $4,080–$4,330
Rationale: Shorting the top of the range with overbought RSI, expecting a retracement or range rejection
🎯 Target Zones (Take-Profit Levels)
We are monitoring multiple support levels for potential profit-taking:
TP1: $3,494
TP2: $3,133
TP3: $2,827
TP4 (max target): $2,354–$2,363
⚠️ Important Note: Although we’ve identified several potential targets, we expect to close the short position earlier — depending on how the price behaves during the retracement. We'll monitor market structure, volume, and lower timeframe signals on the way down.
🛡️ Risk Management
Stop-loss: Above the previous highs (~$4,330), to limit downside risk if the breakout is sustained
Regular monitoring is essential, as macro conditions and ETH sentiment can shift rapidly.
✅ Conclusion:
We're recommending a short trade at the top of a well-defined range, with confirmation from overbought RSI and historical rejection zones. The trade includes multiple targets, but it’s likely to be managed actively and closed partially or fully before reaching the final levels.

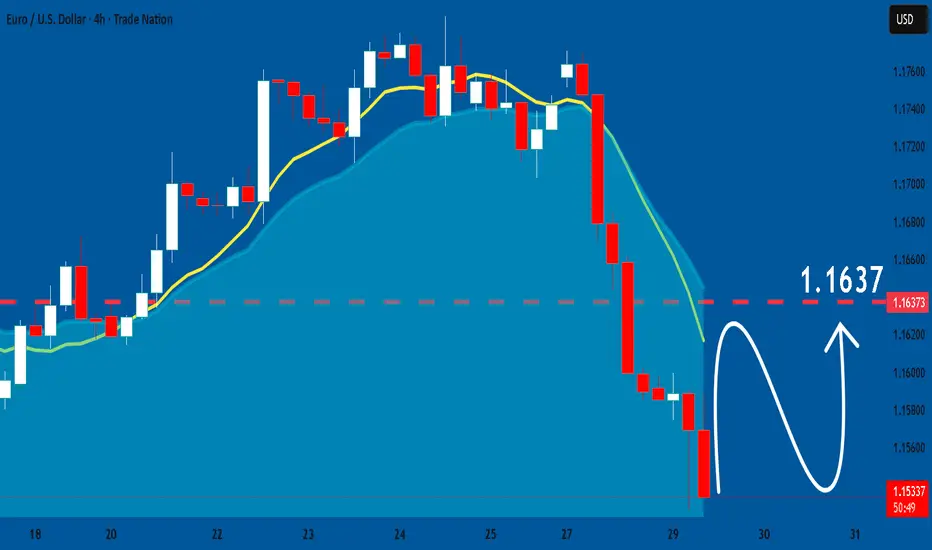
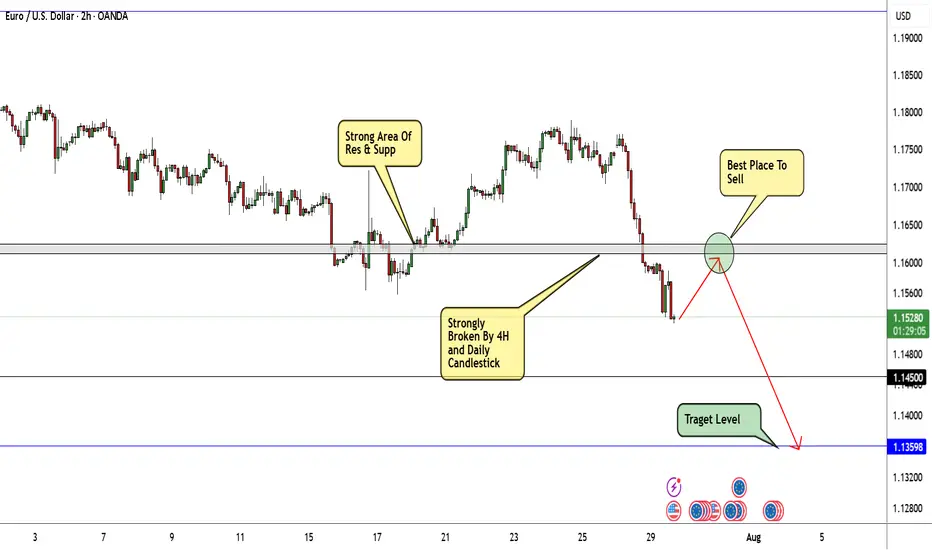
EUR/USD Will Continue Melting Be Sure To Be Part Of That!Here is my thought of EURUSD chart today. I think that this pair can go down further more specially after breaking this strong area of support and old resistance. as shown on the chart we can wait for the price to come back again and retest this area once and then this will be the best place to enter a sell trade. I am targeting around 250n pips in this trade. as I said I will wait for a retest and a good bearish price action and from there I will enter a sell trade.
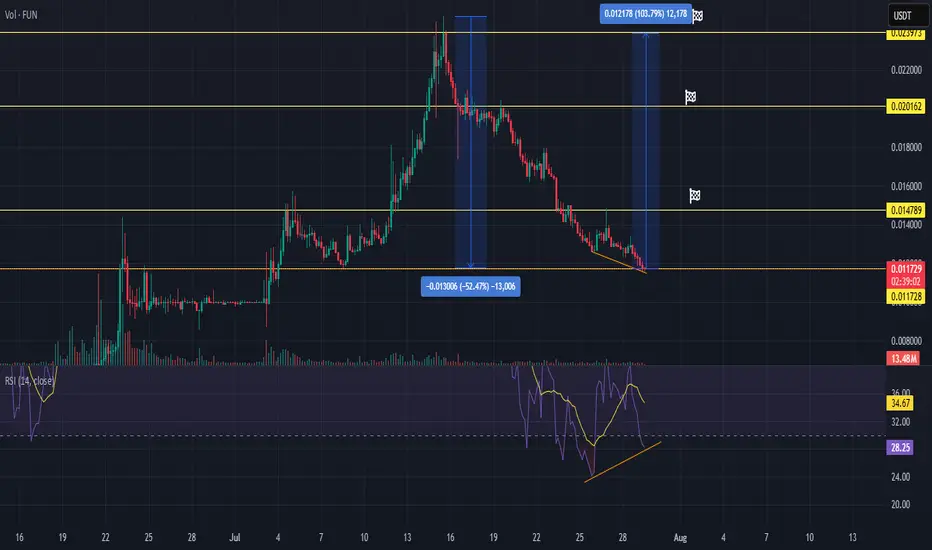
FUNUSDT reversal set-uphi Traders,
We can see Bullish Signals Developing
Bullish Divergence (RSI):
A clear bullish divergence is visible between the RSI and price action. While the price made lower lows, the RSI formed higher lows (28.35 vs. previous 24 region), indicating a potential loss of bearish momentum and the emergence of buying pressure at lower levels.
Oversold RSI:
The RSI is recovering from oversold conditions and is currently around 34.68, showing that the asset may be primed for a short-term rebound.
🟡 Key Support Zone: Previous Resistance Flip
The current price action is retesting a previous top (~0.01172 USDT) from mid-July, which now acts as support.
This level previously acted as a breakout zone during the upward rally and is a logical area where buyers may step in again.
If this support holds, it increases the probability of a reversal or consolidation phase.
📊 Potential Reversal Targets
First Target: 0.01478 USDT (mid-range resistance)
Second Target: 0.01600 USDT
Third Target: 0.02016 USDT (strong resistance from recent top consolidation)
📉 Risk Management
A daily close below 0.01170 would invalidate the bullish setup, indicating possible continuation of the downtrend.
Volume remains moderate (13.43M), so confirmation via bullish candle and volume pickup is ideal.
✅ Conclusion:
FUN/USDT is showing early signs of a potential bullish reversal, backed by RSI divergence and a retest of prior resistance now acting as support. Traders may consider this a watchlist candidate for a bounce setup, with well-defined invalidation and targets.
Is Gold having Correction before dumping?It's a pretty hot topic at the moment where the Gold is moving toward and what it will eventually become... Side way wedge like this. what do you think?

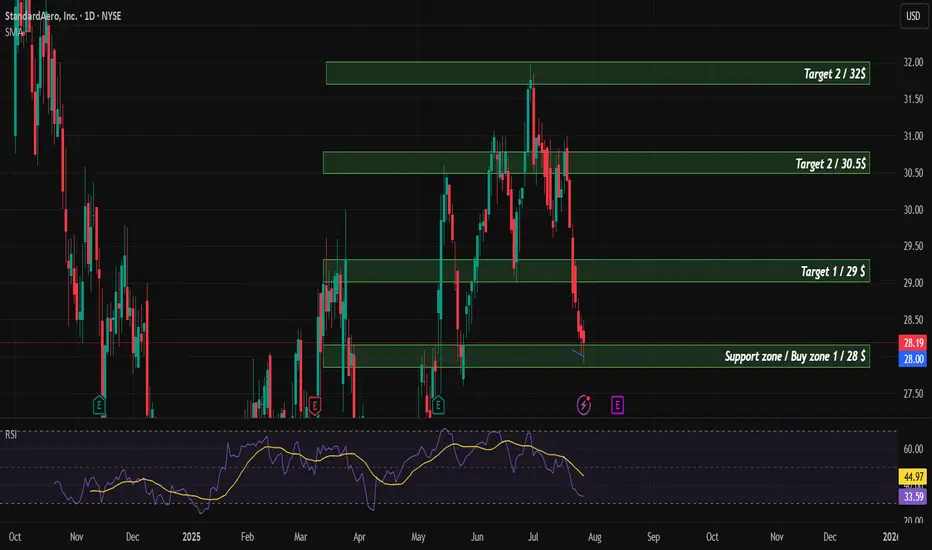
SARO Buy/LongTechnical analysis of the company. According to financial indicators, the company is currently undervalued and is supported by SMA200. The target price for the company is $35.
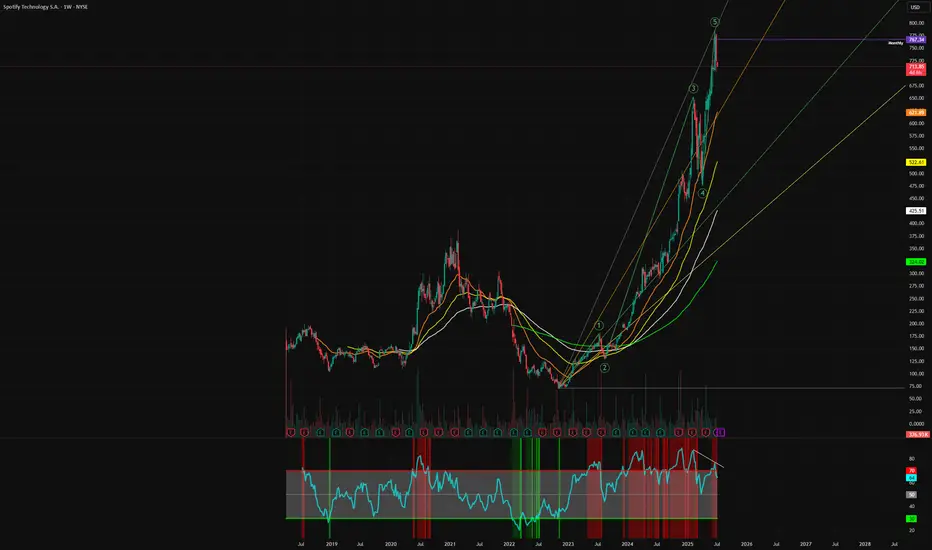
ShortifyI don't post all my trade ideas ahead of time but I will share another short position that I executed before posting, this time in Spotify.
Short entered at $770, stop lost at $790.
Added to my position when we lost the monthly level of support.
The end of the 5 Wave Supercycle.
Trailing stop loss, I don't like shorting solid companies but this one got overextended.
I am short several positions, including Palantir, DuoLingo and commodities like cocoa.
Not financial advice, do what's best for you
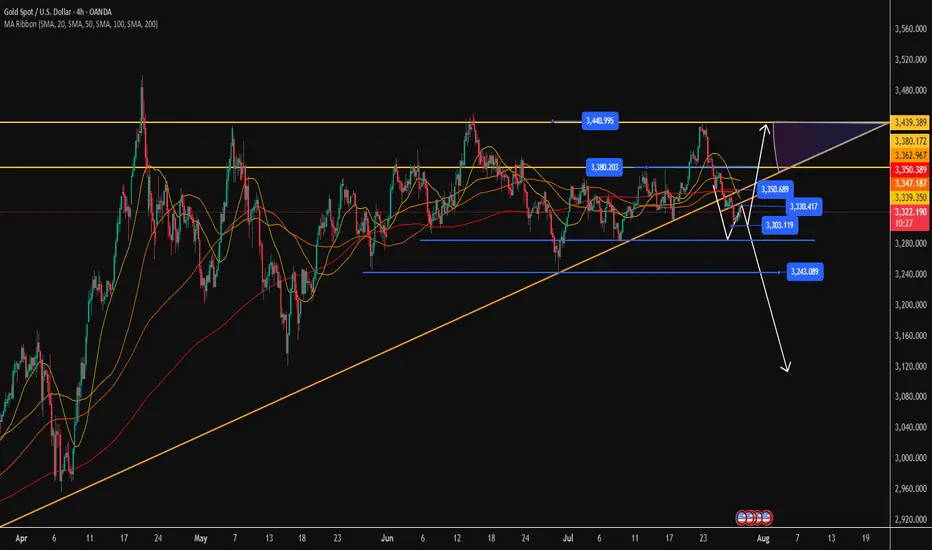
Today's Gold Price: Short at HighsToday's Gold Price: Short at Highs
As shown in the chart:
Rebound Short Strategy
Resistance: 3330-3350
Support: 3310
Technical Analysis:
1: As long as the gold price is below 3330, the market is bearish.
2: As long as the gold price is below 3350, the market is short.
3: As long as the gold price is above 3300, the long position is to buy on dips.
Specific Strategy:
Aggressive Strategy:
Sell: 3325-3330
Stop Loss: 3335
Target Price: 3310
Conservative Strategy:
Sell: 3340-3350
Stop Loss: 3355
Target Price: 3330-3310
Bottom Picking Strategy:
Buy: 3300-3310
Stop Loss: 3290
Target Price: 3350+/3400+
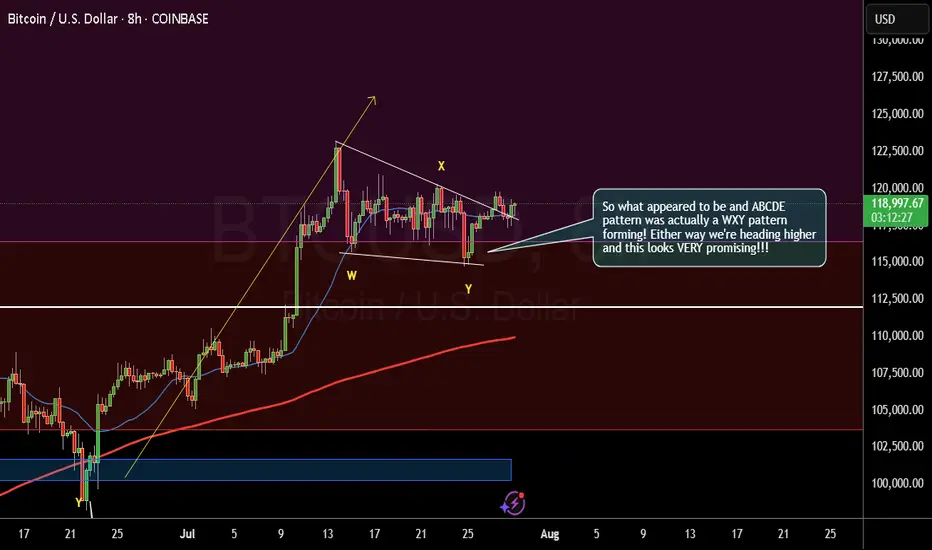
Different Pattern, Same result - Exploding higher!So what appeared to be and ABCDE
pattern a few days ago was actually a WXY pattern
forming! Either way we're heading higher
and this looks VERY promising!!!
Doge(based on NEo wave)confirmation of finishing the E wave of triangle is here now.
it takes about 400 days for all targets to pass.
see the related last chart of doge.

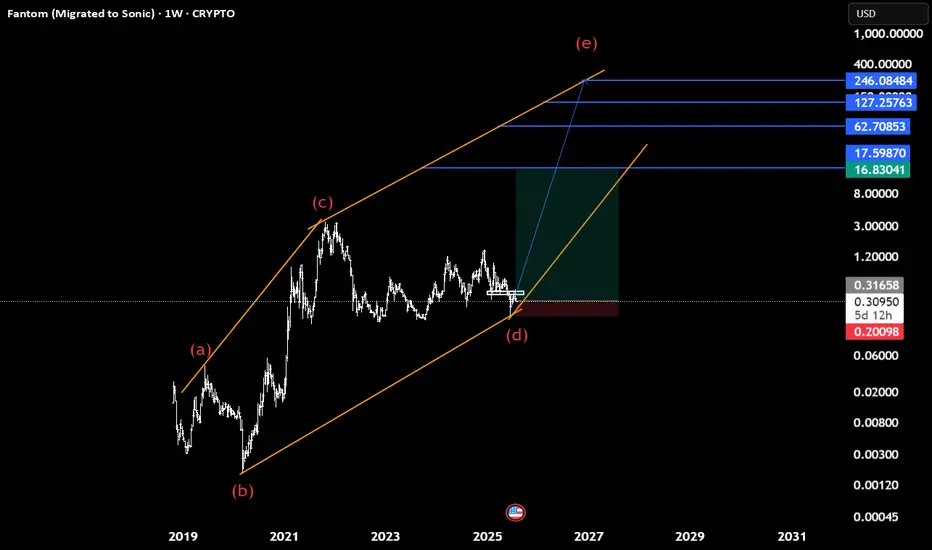
Sonic(based on NEo wave)Soon Sonic will start heavy bullish waves to the targets which shown with blue lines.
95% it is a diamnod diametric and we cant consider this as descending triangle because there is no overlap between wave d and a.
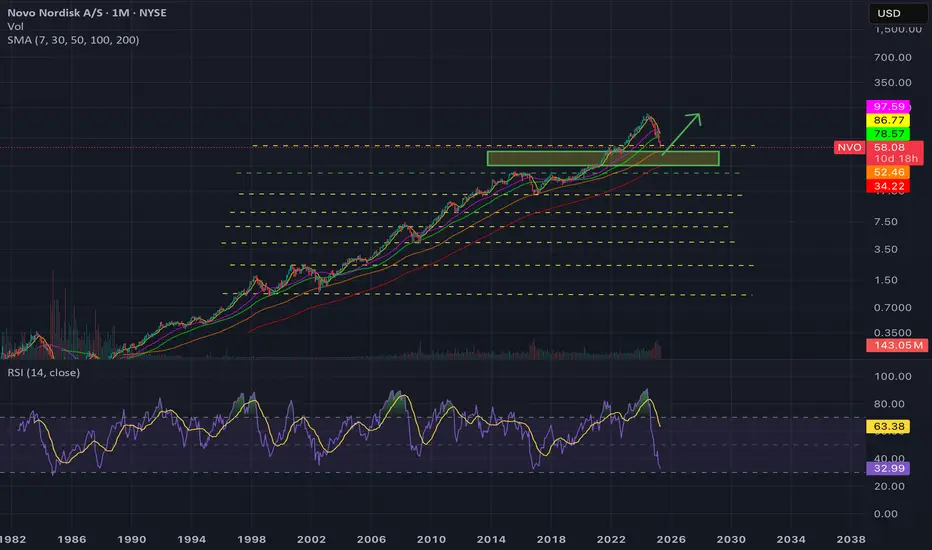
$NVO offers solid risk to reward for long term buyers! - I had previously called out that NYSE:NVO would have more pain to come when it was in $85-90s I have attached the link with this post for my reader's reference.
- Now, I am turning bullish on this name given these prices and compressed multiples for the growth prospects it offers.
Fundamentally,
Year | 2025 | 2026 | 2027 | 2028
EPS | 3.93 | 4.78 | 5.41 | 5.97
EPS growth% | 25.41% | 21.60% | 13.19% | 10.24%
For a quality name growing EPS > 20% deserves a fair forward multiple of 25.
| Year | Bear (fp/e = 15) | Cons. Base (f. p/e = 20) | Base (fpe = 25) | Bull Case (fpe=30)
| 2025 | $58.95 | $78 |. $98.25. |. $117.9
| 2026 | $71.7 | $95 |. $119. |. $143.4
| 2027 | $81.15 | $108 |. $135 | $162.3
| 2028 | $90 | $119 |. $149.25 | $179.1
As you can see, If you buy NYSE:NVO under $60 then you will be making money even if multiple remains compressed i.e bear case. Only thing you have to do is hold and returns would amplify once there is optimism back in the market which will lead to multiple expansion.
My fair value for NYSE:NVO for this year is $78 based on the conservative base case.
SSTEEL EXCHANGE INDIA Steel Exchange India Ltd. is a mid-sized integrated steel manufacturer, producing billets, TMT bars, and structural steel. The company operates across Andhra Pradesh with backward integration through captive power and sponge iron capacity. It serves construction, infrastructure, and industrial clients through its Vizag Steel vertical. The stock is currently trading at ₹10.89.
Steel Exchange India Ltd. – FY22–FY25 Snapshot
Sales – ₹814 Cr → ₹860 Cr → ₹918 Cr → ₹982 Cr – Gradual expansion driven by volume growth and demand
Net Profit – ₹39.6 Cr → ₹45.3 Cr → ₹50.6 Cr → ₹56.4 Cr – Steady earnings growth through efficiency and pricing Company Order Book – Moderate → Strong → Strong → Strong – Consistent inflow from infra-linked segments Dividend Yield (%) – 0.00% → 0.00% → 0.00% → 0.00% – No payouts, reinvestment-focused strategy
Operating Performance – Moderate → Strong → Strong → Strong – Margin stability supported by captive power Equity Capital – ₹53.68 Cr (constant) – No dilution, lean capital base
Total Debt – ₹190 Cr → ₹180 Cr → ₹168 Cr → ₹155 Cr – Controlled deleveraging from operational cash flows
Total Liabilities – ₹310 Cr → ₹325 Cr → ₹340 Cr → ₹356 Cr – Scaling modestly with demand
Fixed Assets – ₹145 Cr → ₹153 Cr → ₹160 Cr → ₹168 Cr – Capex directed toward plant modernization and efficiency upgrades
Latest Highlights FY25 net profit rose 11.5% YoY to ₹56.4 Cr; revenue increased 7.0% to ₹982 Cr EPS: ₹1.05 | EBITDA Margin: 14.9% | Net Margin: 5.74% Return on Equity: 12.34% | Return on Assets: 9.81% Promoter holding: 59.44% | Dividend Yield: 0.00% Operational efficiency gains from captive power and logistics optimization Rural infra and housing demand driving uptick in TMT segment volumes
Institutional Interest & Ownership Trends Promoter holding remains stable at 59.44% with no pledging or dilution. FII interest is minimal given the mid-cap profile, while HNI accumulation is visible across recent delivery spikes. Institutional exposure remains niche, centered around infra-allocation and value opportunities in commodity-linked verticals.
Business Growth Verdict Yes, Steel Exchange India is growing steadily across core product lines Margins supported by integration and volume expansion Debt is declining steadily with earnings momentum Capex remains efficient and supports operational improvement
Company Guidance Management projects single-digit revenue growth in FY26 driven by product mix enhancement and improved capacity utilization. Margin profile expected to remain consistent due to backward integration and demand visibility from infrastructure.
Final Investment Verdict Steel Exchange India Ltd. presents a modest yet efficient growth story in India’s steel sector. Its improving margin profile, steady earnings, and conservative capital structure make it suitable for gradual accumulation. The company’s core focus on integrated operations and infra-led volumes provides a base for value creation, appealing to investors seeking mid-cap manufacturing exposure in commodity-driven sectors.

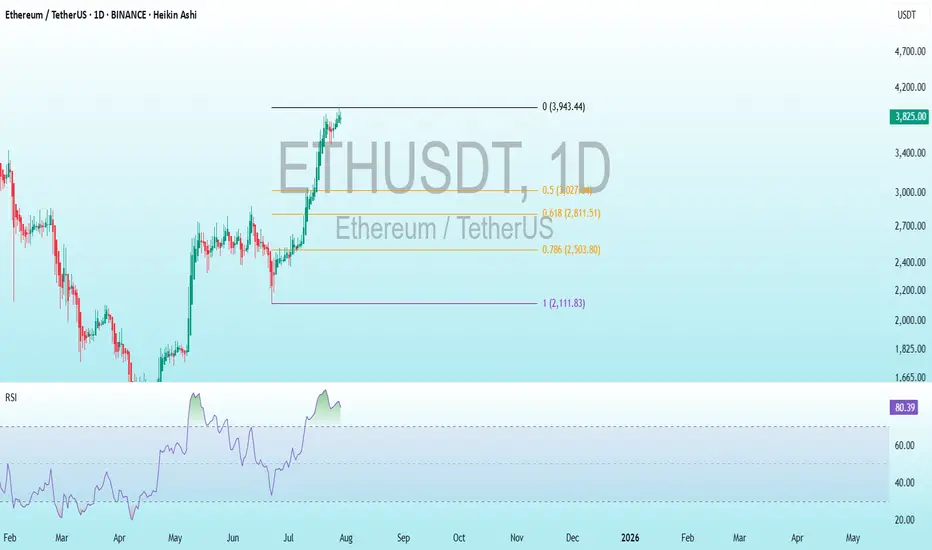
ETH Bearish DivergenceBINANCE:ETHUSDT
Rezistance Levels: 3,943.44.
Support: 2,111.83
Trade Setup:
Target 1: 3,027.64 (0.50 Fibonnaci Golden Zone).
Target 2: 2,811.51 (0.618 Fibonnaci Golden Zone).
Target 3: 2,503.80 (0.786 Fibonnaci Golden Zone).
Target 4: 2,111.83 (1 Fibonnaci).
Stop Loss: 3,943.44 (above recent high, ~25% above current price).
RSI Analysis: The RSI shows a bullish divergence (price making lower lows while RSI makes higher lows), suggesting potential upward momentum. Current RSI is around 80.39, nearing overbought territory (>70), so caution is advised.
EURUSD: Bullish Continuation is Expected! Here is Why:
Remember that we can not, and should not impose our will on the market but rather listen to its whims and make profit by following it. And thus shall be done today on the EURUSD pair which is likely to be pushed up by the bulls so we will buy!
Disclosure: I am part of Trade Nation's Influencer program and receive a monthly fee for using their TradingView charts in my analysis.
❤️ Please, support our work with like & comment! ❤️