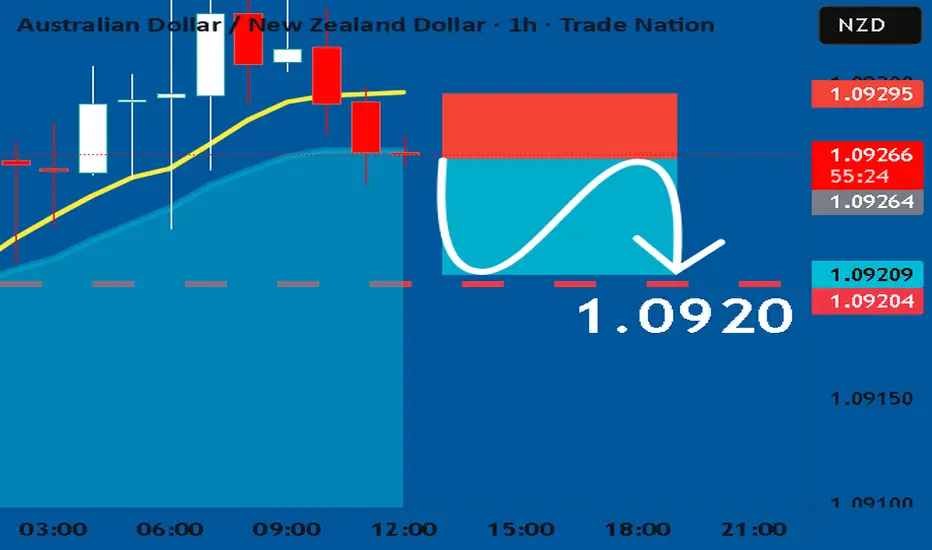
AUDNZD: Short Signal Explained
AUDNZD
- Classic bearish formation
- Our team expects fall
SUGGESTED TRADE:
Swing Trade
Sell AUDNZD
Entry Level - 1.0926
Sl - 1.0929
Tp - 1.0920
Our Risk - 1%
Start protection of your profits from lower levels
Disclosure: I am part of Trade Nation's Influencer program and receive a monthly fee for using their TradingView charts in my analysis.
❤️ Please, support our work with like & comment! ❤️
Wave Analysis
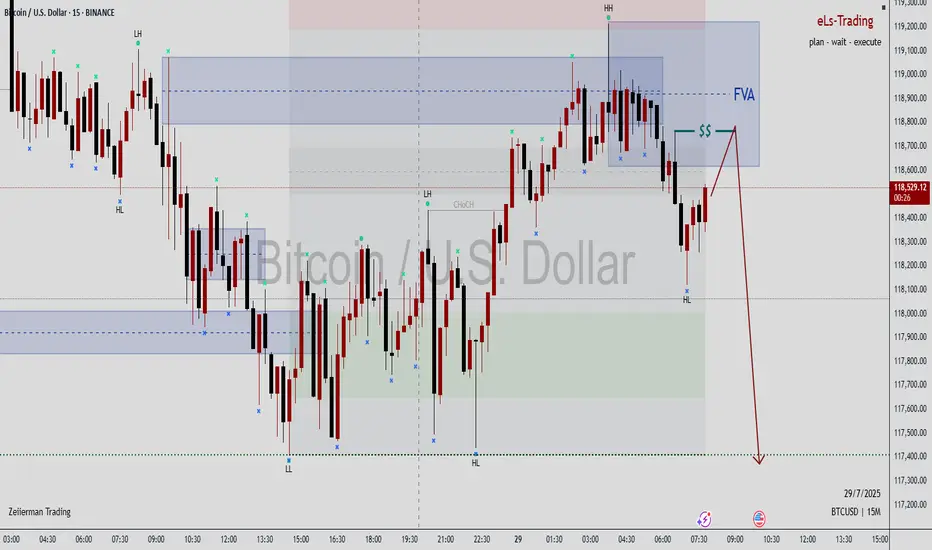
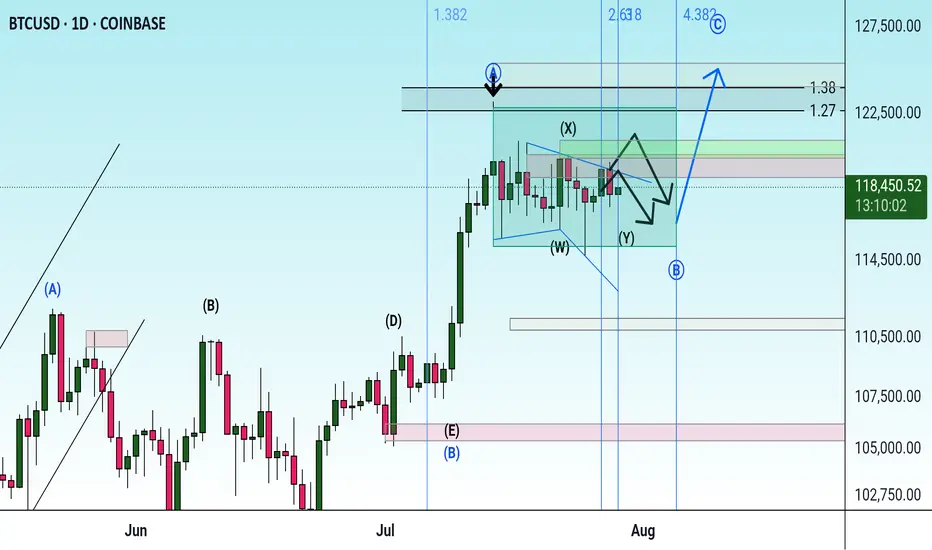
BTCUSD IdeaWe are waiting for our asset to reach our action zone, and based on the reaction, we’ll decide on our next moves.ALWAYS WAIT FOR A CONFIRMATION TO SEE IF THE PRICE VALIDATES THE ZONE.and you what is your vision of the EURUSD its interests me! i wait you in the commentary
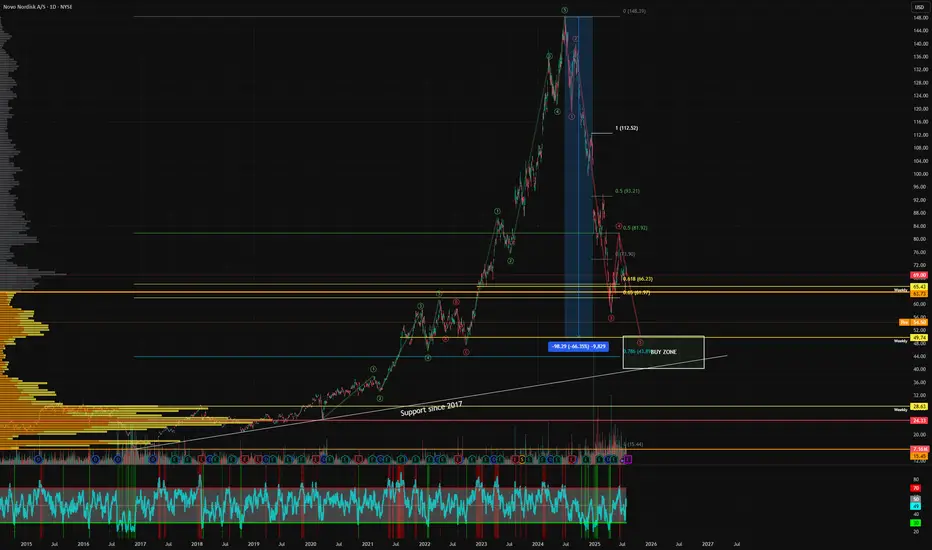
Final Drop?This looks like the final puke of wave 5. It could end up anywhere between $40-50. I have taken a position at $50 and I intend to load up more if we retest the historical support trendline.
Not financial advice, do what's best for you
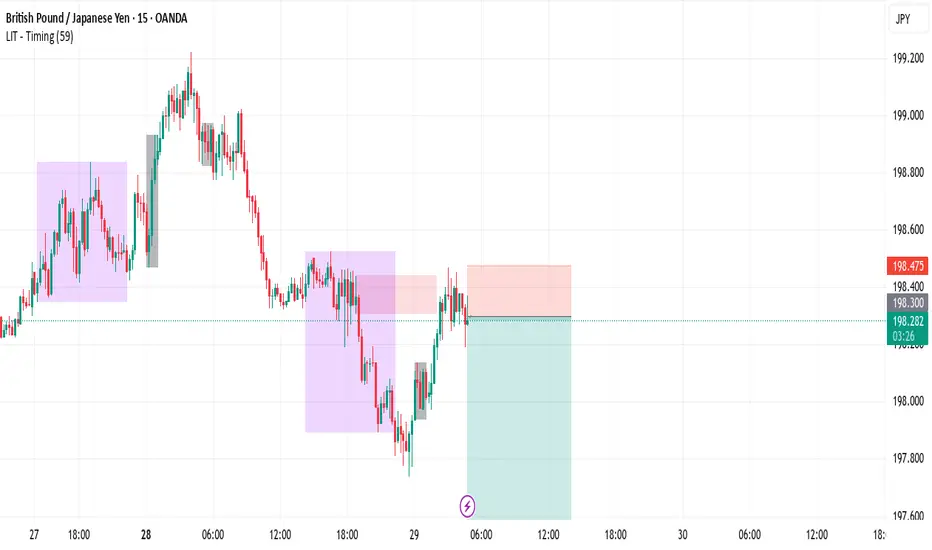
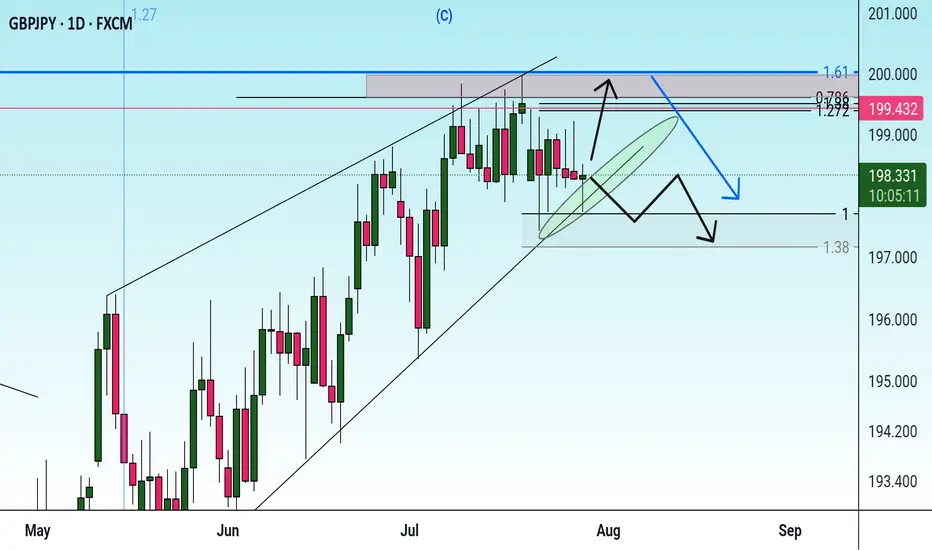
GBPJPY SellLIT cycle combined with Daily cycle. Price is overall bearish as it took liquidity on higher time-frames and we should be trading away from the inducement.
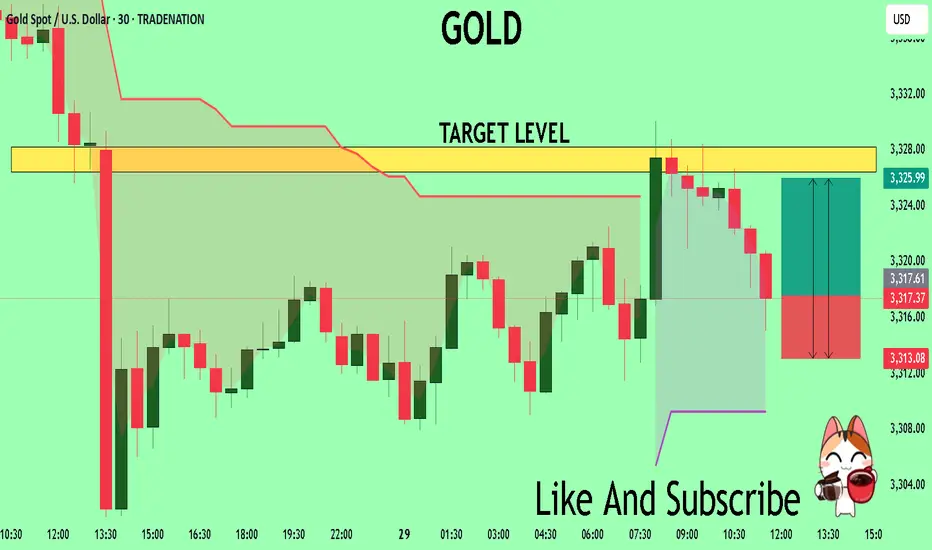
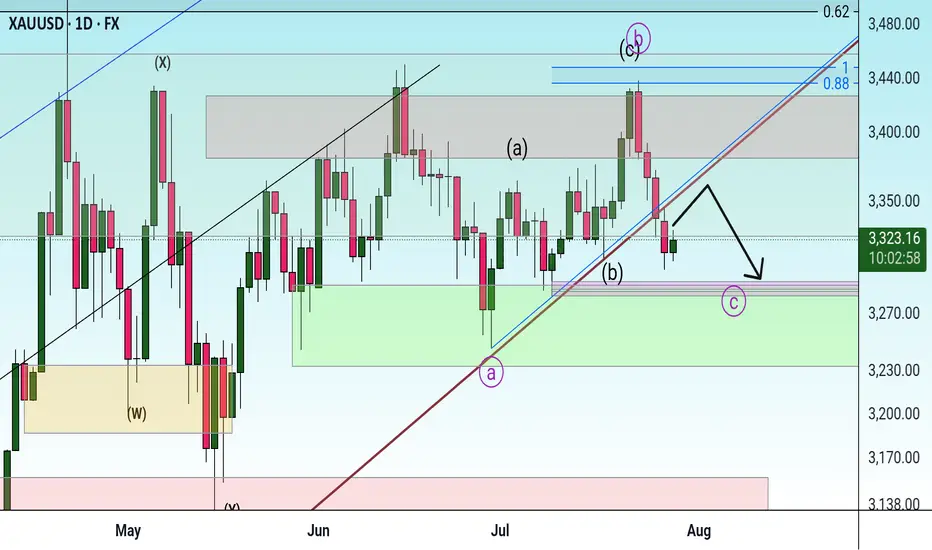
GOLD The Target Is UP! BUY!
My dear subscribers,
This is my opinion on the GOLD next move:
The instrument tests an important psychological level 3317.7
Bias - Bullish
Technical Indicators: Supper Trend gives a precise Bullish signal, while Pivot Point HL predicts price changes and potential reversals in the market.
Target - 3326.4
My Stop Loss - 3313.0
About Used Indicators:
On the subsequent day, trading above the pivot point is thought to indicate ongoing bullish sentiment, while trading below the pivot point indicates bearish sentiment.
Disclosure: I am part of Trade Nation's Influencer program and receive a monthly fee for using their TradingView charts in my analysis.
———————————
WISH YOU ALL LUCK
BITCOIN PREDICTION - MASSIVE CANDLE INCOMING!!! (WARNING) Watch this Bitcoin Prediction video now, you will love it!
Yello, Paradisers! Big warning sign: #Bitcoin is about to liquidate more traders soon if we get these confirmations that I'm sharing with you in this video. Loads of people will get wrecked again. Be careful not to get trapped into fakeouts.
In this video, I'm describing exactly what I'm seeing on Bitcoin, what patterns I'm waiting to form, and what confirmations I want to see before being able to say with 100% accuracy guaranteed that MARKETSCOM:BITCOIN is moving in that direction.
I'm sharing with you all the important targets and also how professional trading works: how risk-reward proper ratio trading works, and how high-probability trading depends a lot on how you choose to create your trades.
Watch this Bitcoin prediction to understand what I'm seeing right now on the chart and how I'm acting and making my decisions.


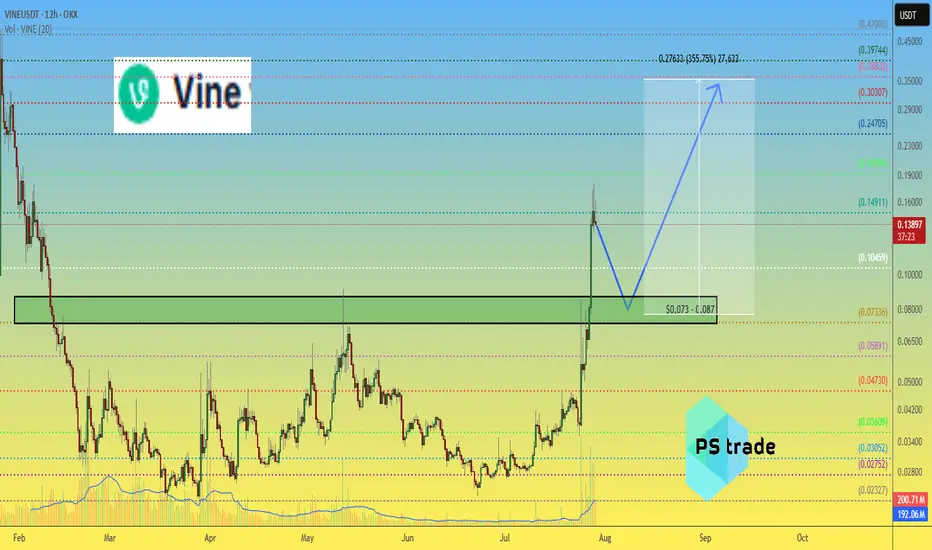
VINEUSDT – Possible "Double Bottom" in PlayPerhaps the OKX:VINEUSDT chart is continuing to working out the “double bottom” pattern.
🎯 The maximum target for this pattern is $0.35, but so far the price is half that.
💥 Trading #VINE is a complete gamble, as it is a meme coin from the PumpFun platform mentioned by Musk, a manipulative combo with no fundamentals.
🎲 But if the price of #Vine stays above $0.073-0.087, and you like gambling, then maybe this trade, with a potential +350%, is just for you)
________________
📚 Follow us ❤️ for daily crypto insights & updates!
🚀 Don’t miss out on important market moves!
Multi-timeframe analysis, strong momentum, FOMC risk/reward plan__________________________________________________________________________________
Technical Overview – Summary Points
__________________________________________________________________________________
Strong momentum and bullish consensus confirmed across all timeframes.
Key support/resistance : 114k–116k (critical support), 123k (major pivot).
Healthy organic volume , no extreme peaks except isolated moments (30min/15min).
Risk On / Risk Off Indicator : Dominant bullish signal, neutral only on 15min.
Multi-timeframe structure : Perfect alignment daily/4H/2H/1H, caution on 15/30min (slight inflection but no abnormal divergence).
__________________________________________________________________________________
Strategic Summary
__________________________________________________________________________________
Global bias : Structural bull market, intact dynamic.
Opportunities : Tactical buys on pullbacks (114–116k), swing on breakout 123k.
Risk areas : Below 114k = risk of invalidation, targets 111k–105k.
Macro catalysts : FOMC imminent (high volatility expected), watch geopolitical tensions.
Action plan : Favor swing/cautious trading ahead of FOMC, dynamic stops, act on first post-Powell trigger.
__________________________________________________________________________________
Multi-Timeframe Analysis
__________________________________________________________________________________
1D : Active range 114k–123k; strong supports, momentum maintained; Risk On / Risk Off Indicator strongly bullish.
12H/6H/4H : Clean bullish structure, no excesses or divergence; price sits within major horizontal clusters.
2H/1H : Healthy impulse/correction phases; key intermediate supports 114.6k, 117.5k to watch.
30min/15min : Slightly weaker momentum but constructive microstructure, no immediate sell threat; localized volume spikes on support reactions.
ISPD DIV : No behavioral stress observed throughout.
Cross-timeframe summary : Bullish confluence dominant; caution on short-term reversals tied to FOMC and on-chain volatility spikes.
__________________________________________________________________________________
Multi-timeframe Cross Analysis & Decisional Rationale
__________________________________________________________________________________
As long as BTC > 114k = bullish bias, buying pullbacks, swing target 123k.
Active management post-FOMC strongly advised (enter/reduce after first H4 close).
Increased volatility risk in case of Fed/geopolitical shock; mandatory stops.
Sector momentum (Risk On / Risk Off Indicator) and volume underpin the bullish case unless exogenous alert.
Invalidation below 114k = prudent, neutral, or tactical shorts towards 111k–105k.
__________________________________________________________________________________
Macro, On-chain & Economic Calendar
__________________________________________________________________________________
FOMC July 29th : pivotal event, any surprise = strong intraday move (BTC sensitive to Powell speech).
US Macro: strong fundamentals but caution on trade war, inflation "contained."
On-chain : realized cap BTC >$1T, high open interest in derivatives = leveraged risk, beware speculative altcoin excess.
Global risk : market remains buyer until bearish Fed/geopolitical shock; swing trading favored, tight stops recommended.
__________________________________________________________________________________
Action plan
__________________________________________________________________________________
Favor buying/reloading on pullbacks to 114.6k–116k (stop <114k).
Break above 123k = bull confirmation, further extension likely to 126–128k depending on FOMC outcome.
Prioritize strict risk management; monitor liquidity/supports on macro/on-chain volatility peaks.
__________________________________________________________________________________

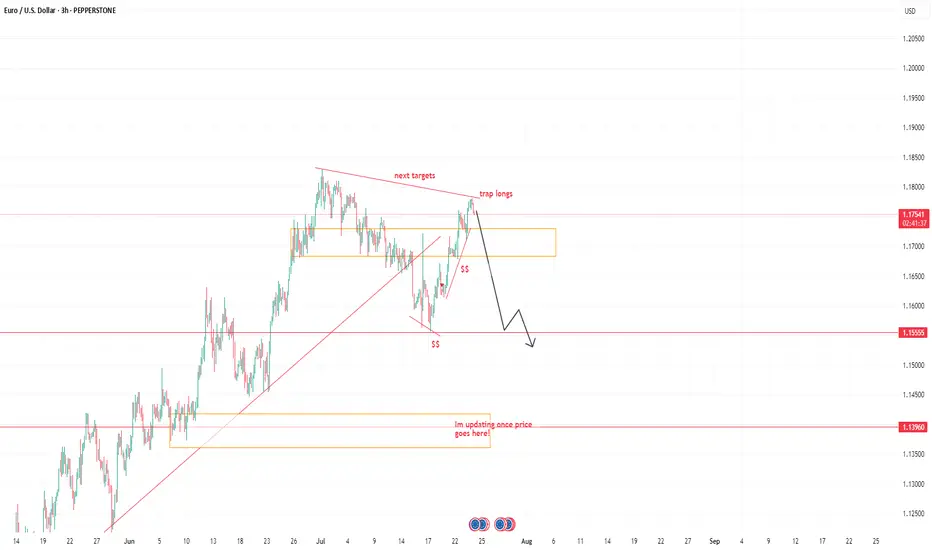
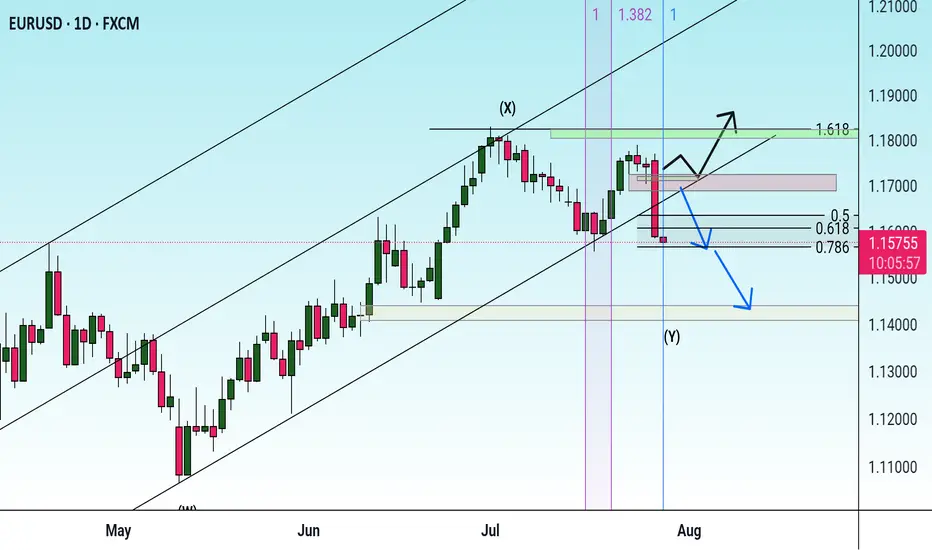
EURUSD NEW IDEASee the chart above, were on decling its momentum, I believe more trap longs this move.
SEE it in 2 days how things works. targets see charts.
I don't really explain to gain more tractions on how trading works.
I am here to understand the movement. Don't complicate too much, If you're a swing trader, take it a leap and have patience. stick to your own proper stoploss.
Trade it or leave it.
Goodluck folks.

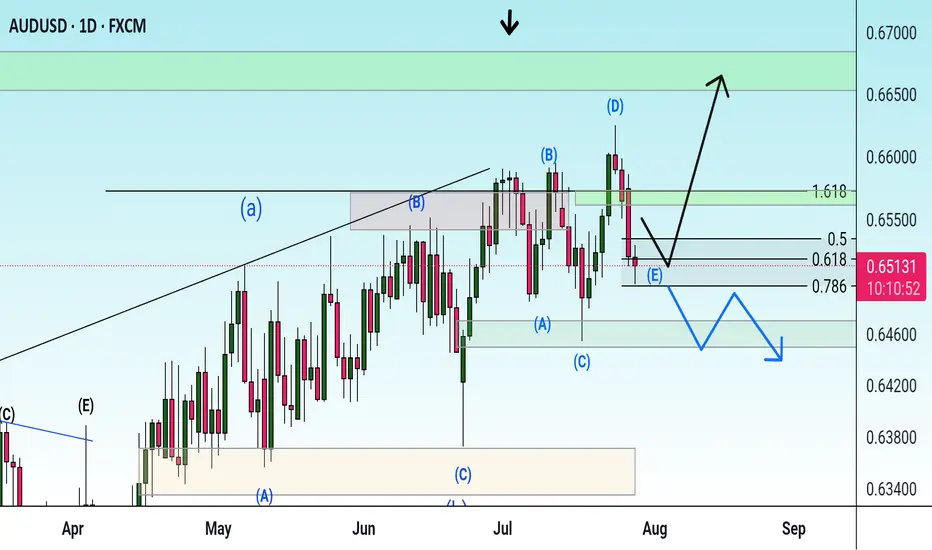
Possibility of uptrend As long as the indicator is above the green resistance zone and the resistance trend line is not consolidated, the continuation of the downtrend is likely. If the strong indicator breaks through the mentioned resistance zone, a long-term uptrend will be formed.
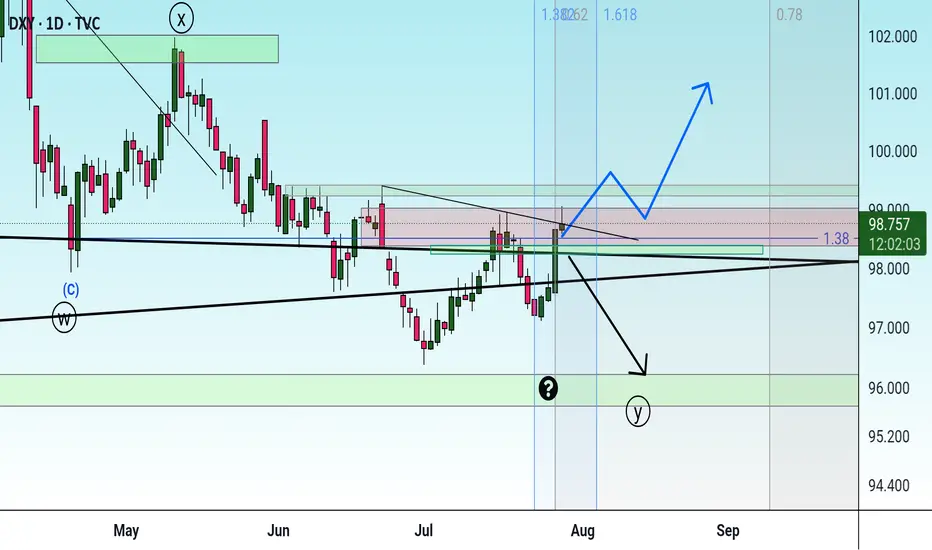
Correction It is expected that the price will consolidate below the trend line and continue the downtrend to the specified support levels. In this case, a three-wave pattern will form.
Check the trend Given that there is a possibility of a triangle pattern forming, it is expected that the price will change direction at the current resistance level and a downtrend will begin. If the price consolidates above the green resistance level, the uptrend will likely continue.
Correction It is expected that the downtrend will continue to form until the specified support levels. Then there is a possibility of a trend change and the start of an uptrend. If the price breaks through the support area, the downtrend will continue to the next support area.
Possibility of correction As long as the price fluctuates above the support trend line, the continuation of the uptrend is likely. If the price crosses the support trend line, it will be a confirmation of the downtrend and the start of a downtrend or correction is likely.
Downtrend If the price can break through the support trend line, a continuation of the downtrend to the support levels is likely. Otherwise, an uptrend is possible with consolidation above the support level.
Check the trend Given the price behavior within the current resistance range, possible scenarios have been identified. It is expected that after some volatility and correction, we will see a continuation of the upward trend.
Possibility of uptrend The uptrend is expected to move in the specified direction and advance to the specified targets. If the indicator does not consolidate above the current resistance level, there is a possibility of a double-digit combination pattern. Then a correction is likely.
correction The corrective pattern is expected to move along the specified path and, after reaching the time frame, a trend change is expected to occur.
Check the trend A triangle pattern is expected to form within the current support range. Then the start of an uptrend is likely. If the price breaks through the 78.6% level, a continuation of the correction and downtrend is possible.
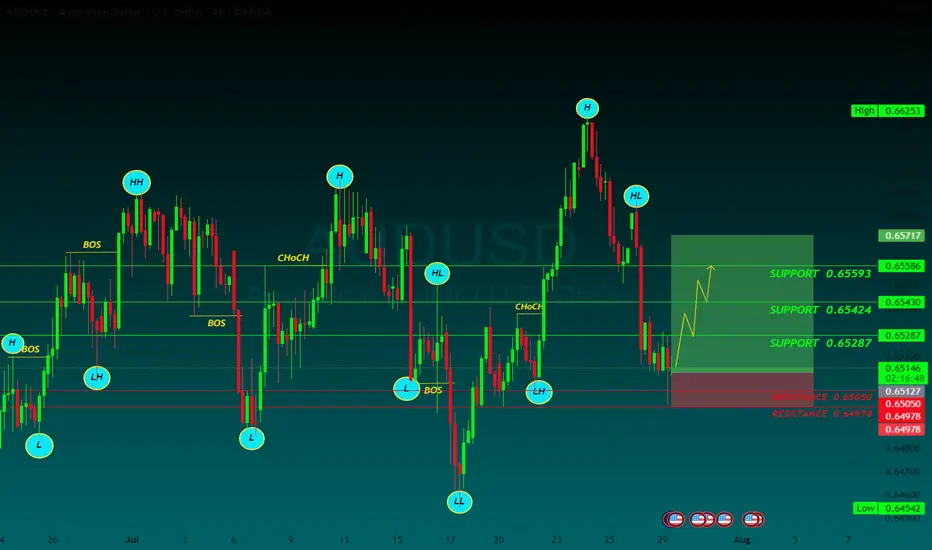
AUDUSD BUYThe AUD/USD pair is trading around 0.6520 on Tuesday. The daily chart’s technical analysis indicates a prevailing bullish bias as the pair remains within the ascending channel pattern. However, the 14-day Relative Strength Index (RSI) has moved below the 50 mark, indicating that a bearish bias is active. Additionally, the pair is positioned below the nine-day Exponential Moving Average (EMA), indicating that short-term price momentum is weaker.
The US and EU reached a framework trade agreement on Sunday that sets 15% tariffs on most European goods, taking effect on August 1. This deal has ended a months-long stand-off, per Bloomberg.
Traders keep their eyes on further developments in the US-China trade talks. The discussions are set to resume on Tuesday after top economic officials from both nations held over five hours of negotiations in Stockholm on Monday. The purpose of this meeting is to resolve ongoing disputes and extend their trade truce by another three months.
US Treasury Chief Scott Bessent met with China’s Vice Premier He Lifeng at Sweden’s Rosenbad government offices. The meeting comes ahead of an August 12 deadline to finalize a long-term tariff agreement with the Trump administration, building on preliminary deals reached in May and June that had helped ease tensions.
The US Federal Reserve (Fed) is widely expected to keep the benchmark interest rate steady between 4.25% and 4.50% at its July meeting. The FOMC press conference will be observed for any signs that rate cuts may start in September.
The Reserve Bank of Australia (RBA) is expected to closely watch the June labor force data and second-quarter inflation figures before deciding on a potential rate cut. Both the monthly and quarterly CPI reports are scheduled for release later this week.
SUPPORT 0.65593
SUPPORT 0.65424
SUPPORT 0.65593
RESISTSNCE 0.65050
RESISTANCE 0.64973
GBPCAD waiting to shortbased on daily candle closed yesterday, i'm expecting another bearish move today.
i'm marked the possible resistant area and waiting lower timeframe to do reversal pattern.
calculate your own risk & reward.
Good luck
