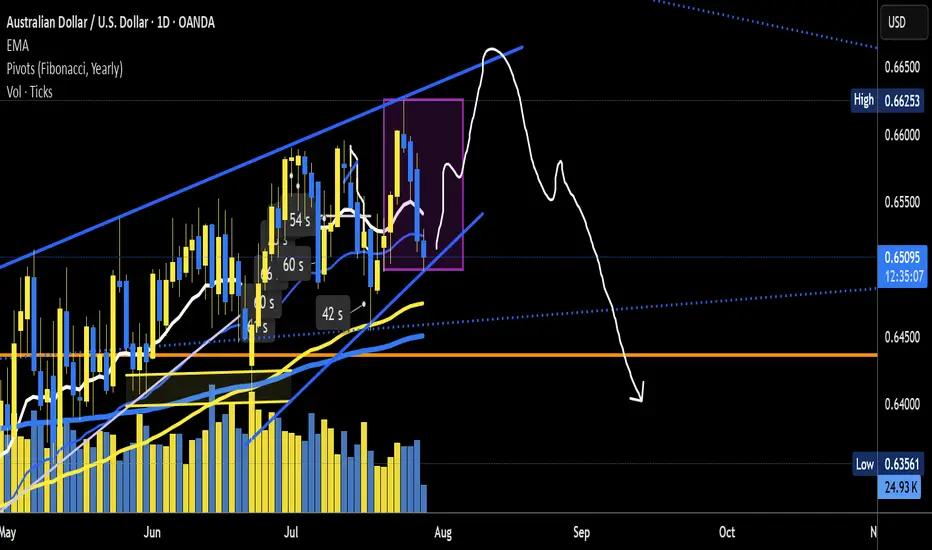
AUD/USD another leg up before down anticipatedroad map plotted. just entered bullish trade for a small leg up. SL to be moved to breakeven. anticipating a generous leg ABC leg down anytime as approaching upper blue trendline forming a ascending triangle. keep an eye out for refersal signals
Wave Analysis
BTC OUTLOOK Bitcoin returns to $119,000 after a CME gap fill as new Galaxy Digital exchange transactions fail to sway the market mood.
Nerves over “OG” BTC sales seem to have passed after last week’s 80,000 BTC transaction.
Trading circles still see the potential for another BTC price dip.
ETH at final leg of 5th WaveAre you Ready to Touch 4000$ and start BIG Drop?
ETH is in final reound of 5th wave of 5th, 5 of 5. After that I expect a BIG drop

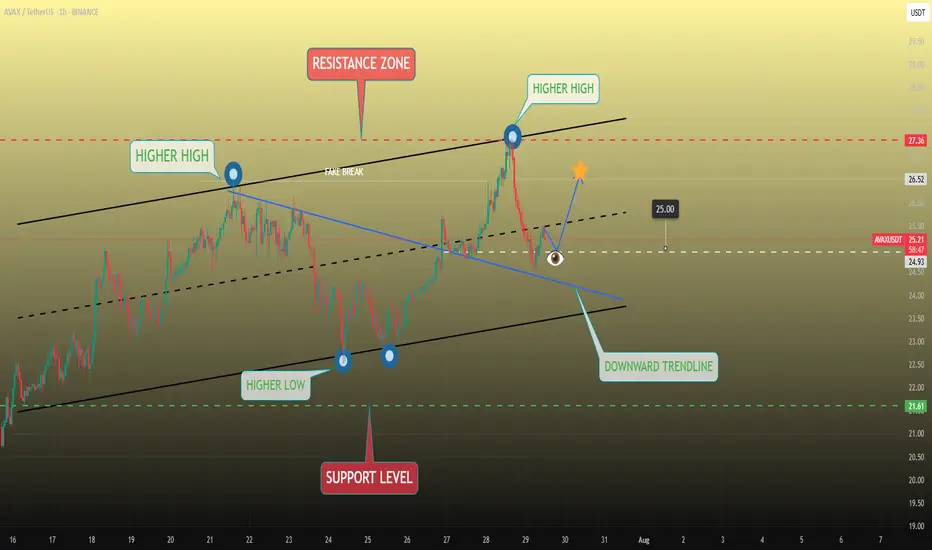
AVAXUSDT Corrective Move In The MarketAVAXUSDT
retraced sharply from the 27.34 resistance zone after making a higher high but found support above the descending trendline. The recent corrective move has paused at a key structure level near 24.96, hinting at potential bullish continuation. A breakout above this local resistance could trigger a rally toward the 26.50–27.34 target zone. Momentum builds as long as price remains above the trendline and higher low structure.
📈 Key Levels
Buy zone: 24.80 – 25.30
Buy trigger: Break and hold above 25.30
Target: 26.50
Invalidation: Close below 24.00
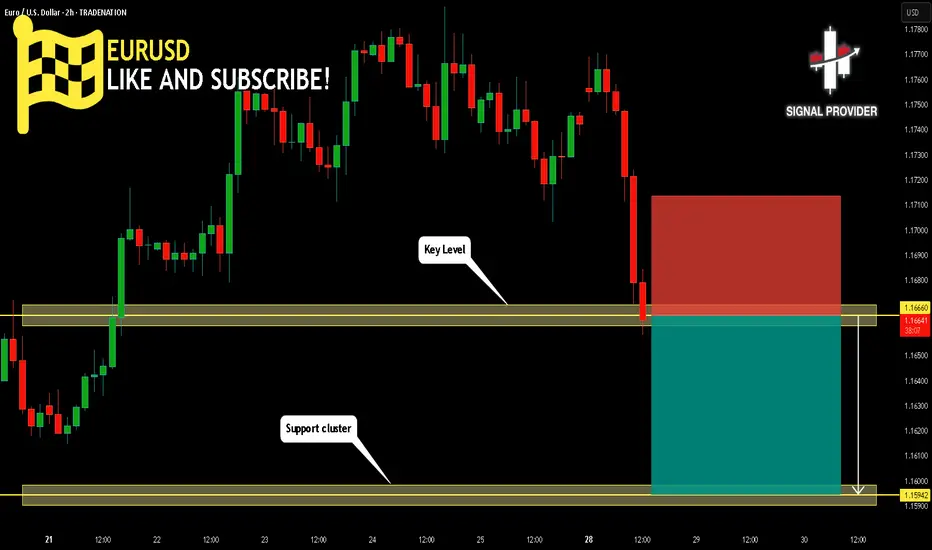
EURUSD Is Bearish! Short!
Take a look at our analysis for EURUSD.
Time Frame: 2h
Current Trend: Bearish
Sentiment: Overbought (based on 7-period RSI)
Forecast: Bearish
The market is approaching a key horizontal level 1.166.
Considering the today's price action, probabilities will be high to see a movement to 1.159.
P.S
We determine oversold/overbought condition with RSI indicator.
When it drops below 30 - the market is considered to be oversold.
When it bounces above 70 - the market is considered to be overbought.
Disclosure: I am part of Trade Nation's Influencer program and receive a monthly fee for using their TradingView charts in my analysis.
Like and subscribe and comment my ideas if you enjoy them!
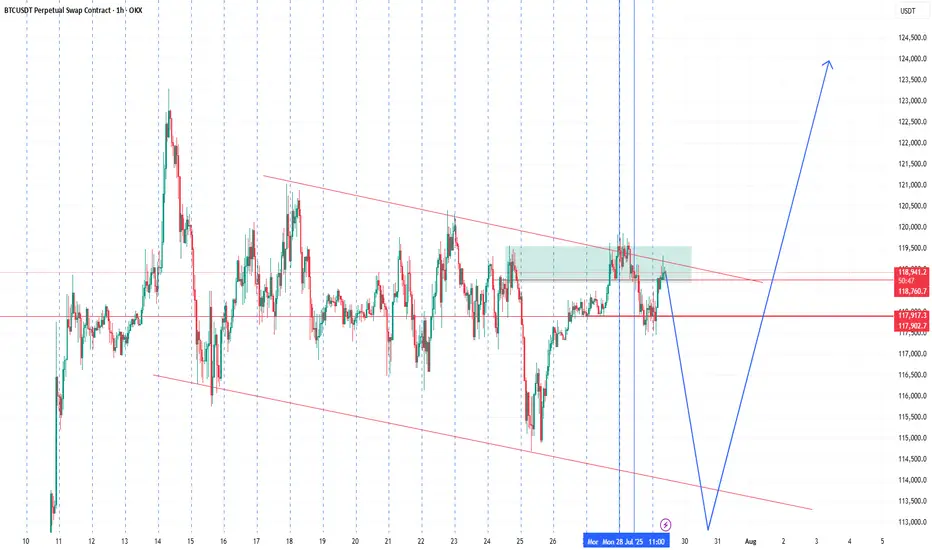
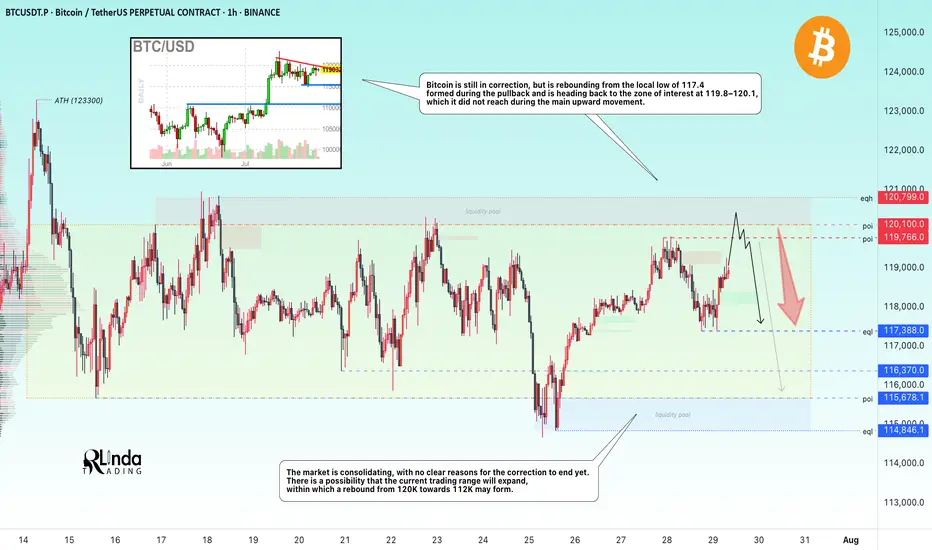
BITCOIN → Hunting for liquidity. Retest resistance before a fallBINANCE:BTCUSDT.P continues to consolidate after a strong rally. There is no strong driver yet, and Bitcoin is reacting weakly to economic data. There is a possibility of a continued correction...
Bitcoin is still in correction, but is rebounding from the local low of 117.4, formed during the pullback, and is heading back up towards the zone of interest at 119.8-120.1, which it did not reach during the main upward movement. I see no fundamental or technical reasons for the correction to end and for growth beyond 121K. I expect a rebound from the resistance zone towards 115-114K. However, in the medium term, I expect the market to attempt to close half or all of the gap between 112K and 114.8K, thereby expanding the key trading range.
Resistance levels: 119.77, 120.1K, 120.8K
Support levels: 117.4, 116.37, 115.68
Technically, a false breakout (liquidity capture) of key resistance and price consolidation in the selling zone could trigger bearish pressure on the market, which in turn would lead to a correction.
Best regards, R. Linda!
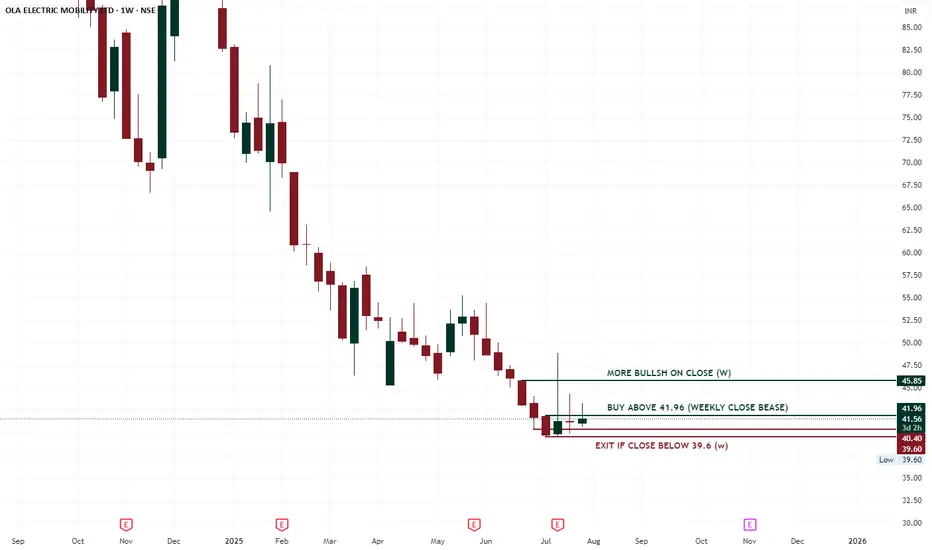
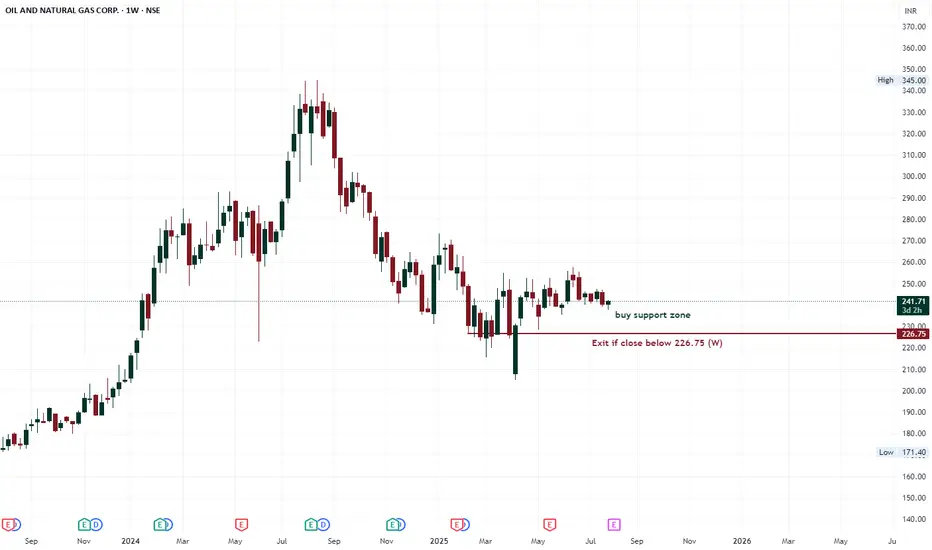
OLA ELECTRIC Some buy pattern show in Ola Electric in weekly pattern.
So can be buy after close above 41.96 (W).
Try to exit, if close continues below 40.4 or 39.6 (W).
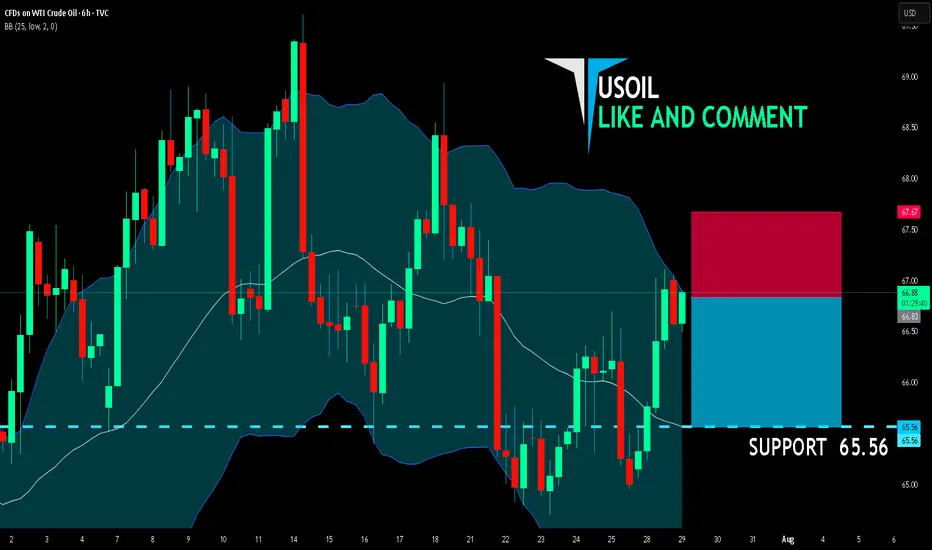
USOIL BEST PLACE TO SELL FROM|SHORT
USOIL SIGNAL
Trade Direction: short
Entry Level: 66.83
Target Level: 65.56
Stop Loss: 67.67
RISK PROFILE
Risk level: medium
Suggested risk: 1%
Timeframe: 6h
Disclosure: I am part of Trade Nation's Influencer program and receive a monthly fee for using their TradingView charts in my analysis.
✅LIKE AND COMMENT MY IDEAS✅
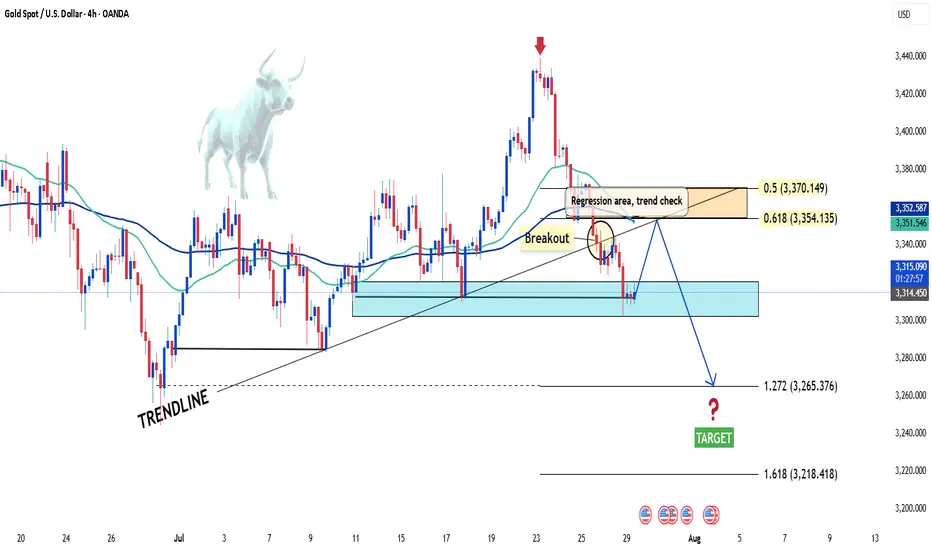
XAUUSD under pressure – Is the downtrend just beginning?Hello everyone! What do you think about XAUUSD right now?
Yesterday, XAUUSD extended its decline and is currently trading around 3,315 USD.
The recent drop in gold prices was mainly triggered by a stronger US dollar, following a trade agreement between the US and the European Union (EU).
From a technical perspective, the short-term outlook shows the beginning of a new downtrend. Notably, we see a bearish crossover in the EMA 34 and 89, along with a break of the previous upward trendline—both reinforcing the current bearish momentum.
If there’s a pullback before the next leg down, the 0.5–0.618 Fibonacci retracement zone (which also aligns with resistance and the EMAs) will be a key area to watch. This could be an ideal level for potential trade setups.
Looking ahead, the next support target is around 3,300 USD. If that level breaks, gold might aim for the 32XX region.
Do you think XAUUSD will continue to fall? Drop your thoughts in the comments!
Wishing you successful and profitable trades!
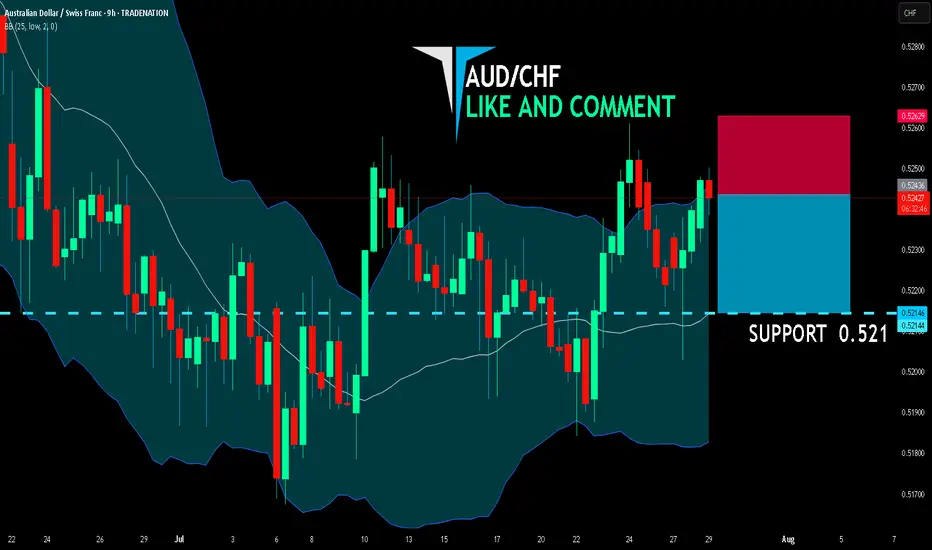
AUD/CHF BEARS ARE STRONG HERE|SHORT
AUD/CHF SIGNAL
Trade Direction: short
Entry Level: 0.524
Target Level: 0.521
Stop Loss: 0.526
RISK PROFILE
Risk level: medium
Suggested risk: 1%
Timeframe: 9h
Disclosure: I am part of Trade Nation's Influencer program and receive a monthly fee for using their TradingView charts in my analysis.
✅LIKE AND COMMENT MY IDEAS✅
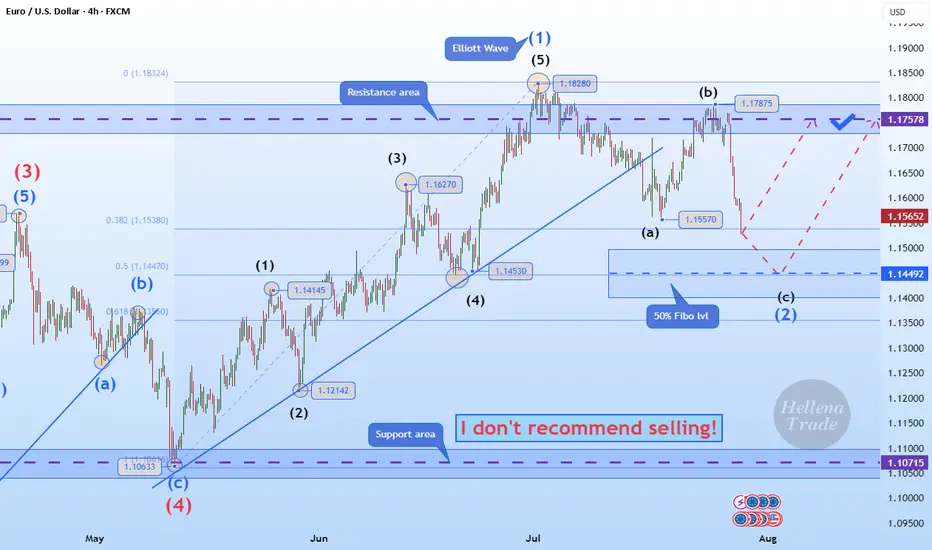
Hellena | EUR/USD (4H): LONG to the resistance area 1.17578.Colleagues, the price has made a strong downward movement, which can only mean one thing: the correction is not complete.
This means that the latest upward movement is wave “1” of medium order.
Therefore, I now expect the correction to end in wave “2” at the 50% Fibonacci level and thean upward movement to continue to at least the resistance level of 1.17578.
It is quite possible that after updating the level of 1.15570, the price will immediately begin an upward movement — this is a more risky option for entering a position.
Manage your capital correctly and competently! Only enter trades based on reliable patterns!
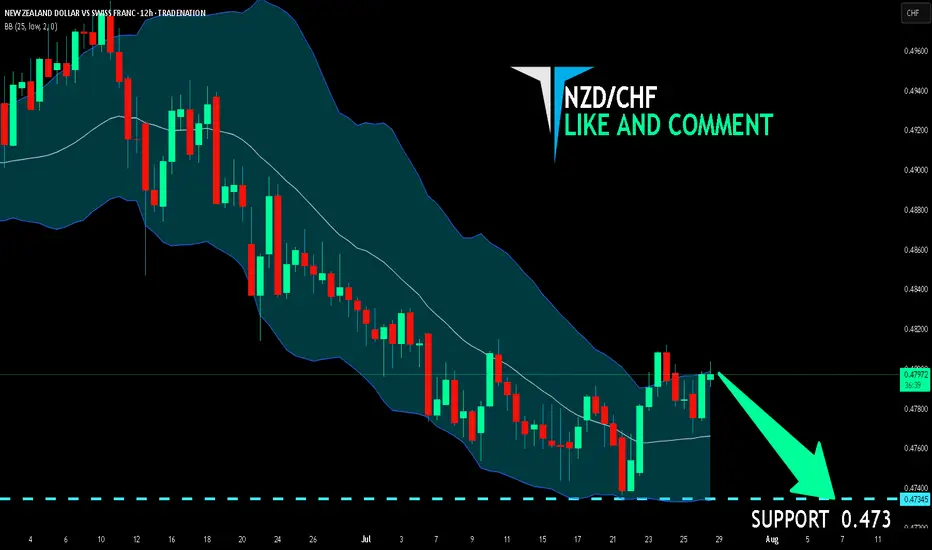
NZD/CHF SHORT FROM RESISTANCE
Hello, Friends!
NZD/CHF pair is trading in a local uptrend which we know by looking at the previous 1W candle which is green. On the 12H timeframe the pair is going up too. The pair is overbought because the price is close to the upper band of the BB indicator. So we are looking to sell the pair with the upper BB line acting as resistance. The next target is 0.473 area.
Disclosure: I am part of Trade Nation's Influencer program and receive a monthly fee for using their TradingView charts in my analysis.
✅LIKE AND COMMENT MY IDEAS✅
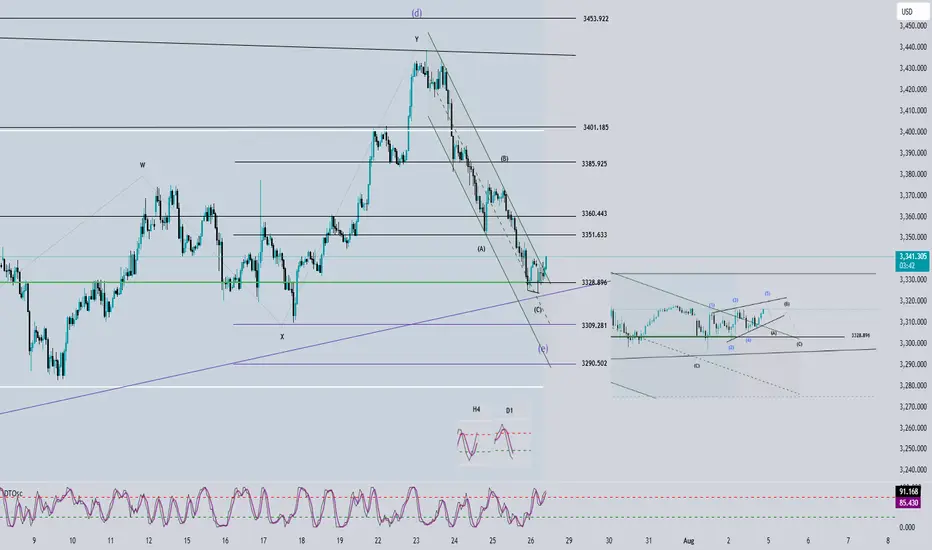
Elliott Wave Analysis – XAUUSD – July 28, 2025📊
________________________________________
🔍 Momentum Analysis:
• D1 Timeframe: Momentum has entered the oversold zone. This strongly suggests a potential bullish reversal today, which could lead to a rally or sideways movement lasting around 4–5 days.
• H4 Timeframe: Momentum is reversing upward. This indicates a likely bullish or sideways move in the short term, at least until momentum reaches the overbought zone (estimated within the next 2 H4 candles).
• H1 Timeframe: Momentum is currently overbought, so we may first see a pullback or sideways movement until a clearer reversal signal appears.
________________________________________
🌀 Wave Structure Analysis:
• On the H4 chart, as noted in previous plans, the assumption that price is forming a contracting triangle (abcde) is still valid. Price is currently in the final leg (wave e) of this triangle.
• On the H1 chart, we can observe a channel structure, within which an abc corrective pattern is unfolding.
• The lower boundary of the triangle (marked by the green trendline) combined with support zones will be critical areas to monitor for the end of wave e.
🔺 Note: Wave e does not necessarily end precisely at the triangle boundary – it can slightly overshoot. Hence, we’ll rely on smaller wave structures to identify potential reversal zones.
________________________________________
🎯 Key Price Zones to Watch:
• Target 1: 3329
• Target 2: 3309
• Target 3: 3290
________________________________________
🔎 Lower Timeframe Structure (M10):
From the current price action (as shown in the chart), we can see a leading diagonal triangle structure forming. This is a pattern commonly seen in wave 1. If this pattern is confirmed, a sharp and steep decline toward the 3329 zone is likely.
________________________________________
⚖️ Combining Momentum & Wave Structure:
• D1: Signals a potential reversal → favors Buy setups.
• H4: Momentum is rising, but price hasn’t confirmed a new bullish trend → need to stay alert and tighten Stop Loss.
• H1: Overbought + possible leading diagonal → Expecting a pullback for wave 2 toward 3329 → this would be the optimal Buy zone.
________________________________________
🧭 Trade Plan:
• For experienced traders:
→ Wait for price to reach key levels and watch for reversal signals before entering.
• For beginners:
→ Use the following Limit Buy setup:
✅ Setup 1:
• Buy zone: 3330 – 3328
• Stop Loss: 3320
• TP1: 3351
• TP2: 3370
• TP3: 3385
✅ Setup 2:
• Buy zone: 3310 – 3308
• Stop Loss: 3300
• TP1: 3328
• TP2: 3351
• TP3: 3370
Ethereum Long: Using Log Chart to Analyze, Target $6600In this video, I go through the analysis using the log chart for Ethereum and shows the potential of this cryptocurrency where I expect the price to reach new high in the coming days with a longer-term target of $6600.
For shorter-term trading, I recommend placing the stop a distance below recent support on the daily chart, around $3372.
Good luck!

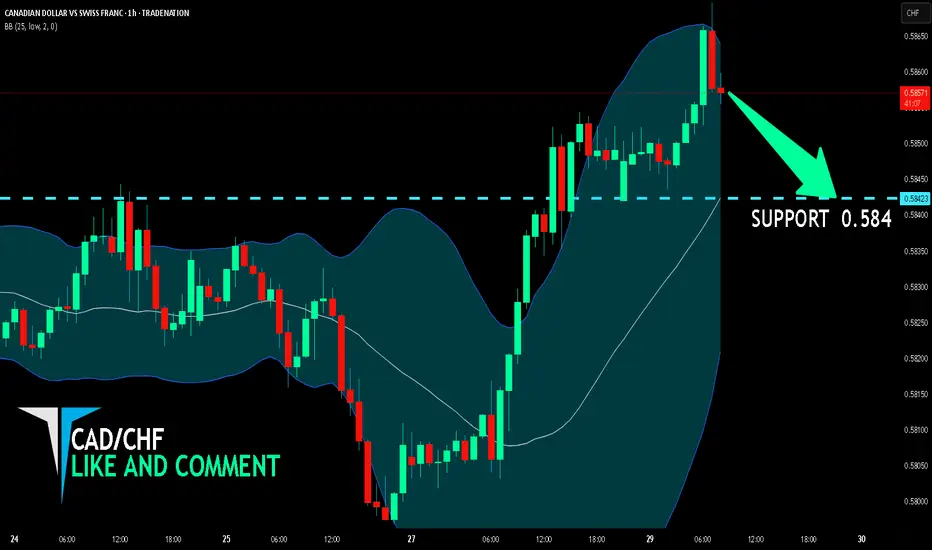
CAD/CHF BEARS WILL DOMINATE THE MARKET|SHORT
Hello, Friends!
We are targeting the 0.584 level area with our short trade on CAD/CHF which is based on the fact that the pair is overbought on the BB band scale and is also approaching a resistance line above thus going us a good entry option.
Disclosure: I am part of Trade Nation's Influencer program and receive a monthly fee for using their TradingView charts in my analysis.
✅LIKE AND COMMENT MY IDEAS✅
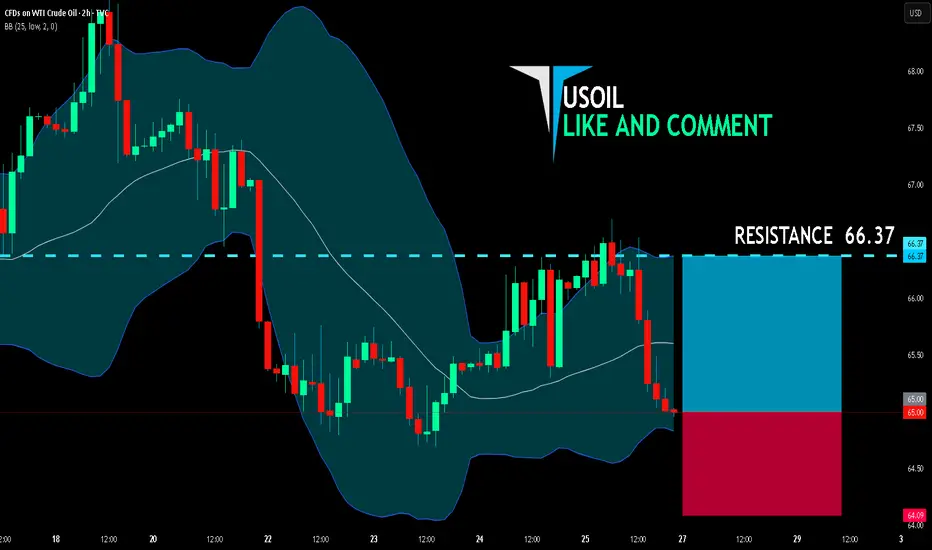
USOIL LONG FROM SUPPORT
USOIL SIGNAL
Trade Direction: long
Entry Level: 65.00
Target Level: 66.37
Stop Loss: 64.09
RISK PROFILE
Risk level: medium
Suggested risk: 1%
Timeframe: 2h
Disclosure: I am part of Trade Nation's Influencer program and receive a monthly fee for using their TradingView charts in my analysis.
✅LIKE AND COMMENT MY IDEAS✅
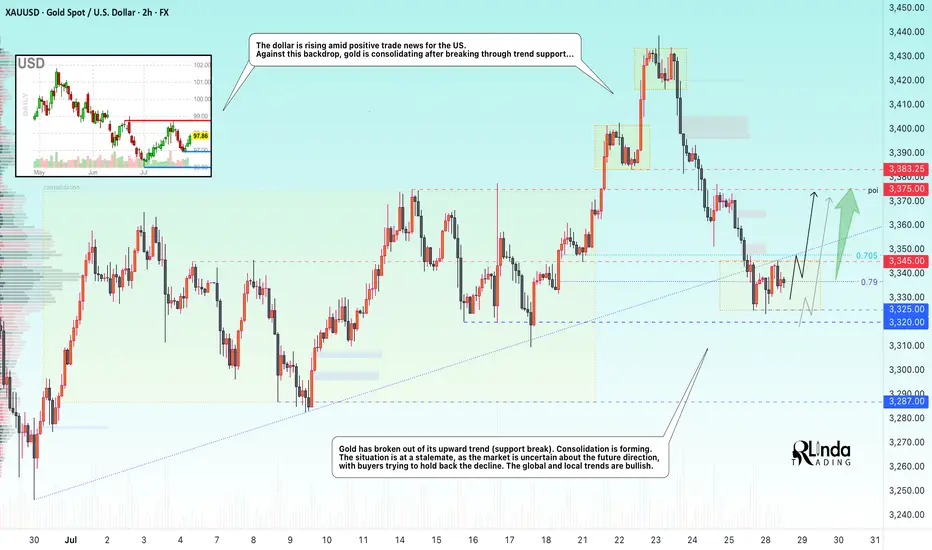
GOLD → Retest of trend support. Consolidation...GOLD is consolidating below the previously broken trend support. On Sunday, Trump announced a trade deal with the EU, which is putting pressure on the market along with the rising dollar...
Gold rebounded from support at $3310 after a week-long low, interrupting a three-day decline amid profit-taking. However, the overall downtrend remains intact as markets brace for a busy week with the release of US GDP data and the Fed's decision. Optimism surrounding US-China trade talks and the US-EU framework agreement is reducing demand for safe-haven assets. Additional pressure on gold is coming from easing geopolitical tensions: Thailand and Cambodia have agreed to ceasefire talks. The metal's recovery may be short-lived.
Technically, we have global and local bullish trends, against which gold is testing support, but as we can see, buyers are trying to hold back the decline due to uncertainty over interest rates. There is a chance that we will see active action by the Fed, behind which lies a rate cut, this week...
Resistance levels: 3345, 3375
Support levels: 3320, 3287
At the moment, I do not see a proper reaction to the support breakout. The price is consolidating after confirming the key trigger at 3345. Thus, if the price starts to return to 3345, test and consolidate above the level, we will have a chance for growth. I do not rule out a liquidity grab from 3325 (false breakout) before the rise.
BUT! The structure will be broken if the price breaks 3325 - 3320 and begins to consolidate below this zone. In this case, gold may fall to 3287
Best regards, R. Linda!
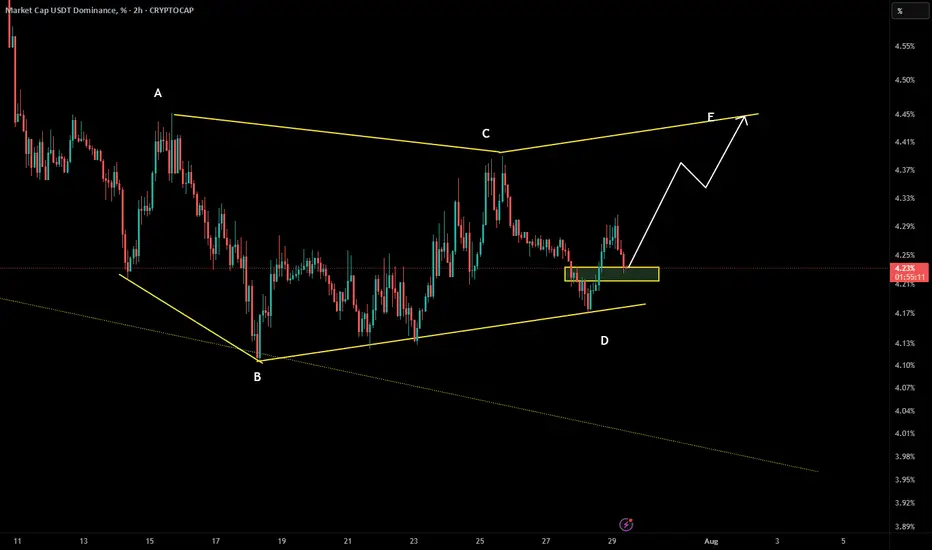
USDT Dominance – Updated Elliott Wave & ICT AnalysisYesterday, we anticipated a bullish reaction from the 4.20%–4.22% support zone, and the market followed through perfectly. The current structure is forming a contracting triangle (ABCDE), and we are now likely heading into wave E.
🔹 Wave Structure (NeoWave View):
Wave D has reacted sharply from the expected support.
Wave E is now in progress, targeting the 4.42%–4.44% resistance zone.
This could complete the triangle structure and signal a potential trend reversal.
🔸 From ICT/Smart Money Perspective:
The market tapped into a clean bullish Order Block.
Below the support zone, there was clear liquidity sweep followed by a strong BOS (Break of Structure) upward.
All signs point to short-term strength in USDT.D.
📌 Scenarios:
Bullish case (primary): Wave E completes around 4.43%–4.44%, followed by possible reversal.
Invalidation: A break below 4.20% with no bullish defense would invalidate this triangle and require reassessment.
🧠 Takeaway:
This structure could mark a temporary market top for altcoins as USDT.D pushes higher. Keep an eye on the 4.43% level.
📡 Analysis by CryptoPilot – navigating the market with precision.
#CryptoPilot #USDT.D #Elliot #NeoWave #MarketStructure #TrendChannel #BOS #Altcoins #CryptoTrading
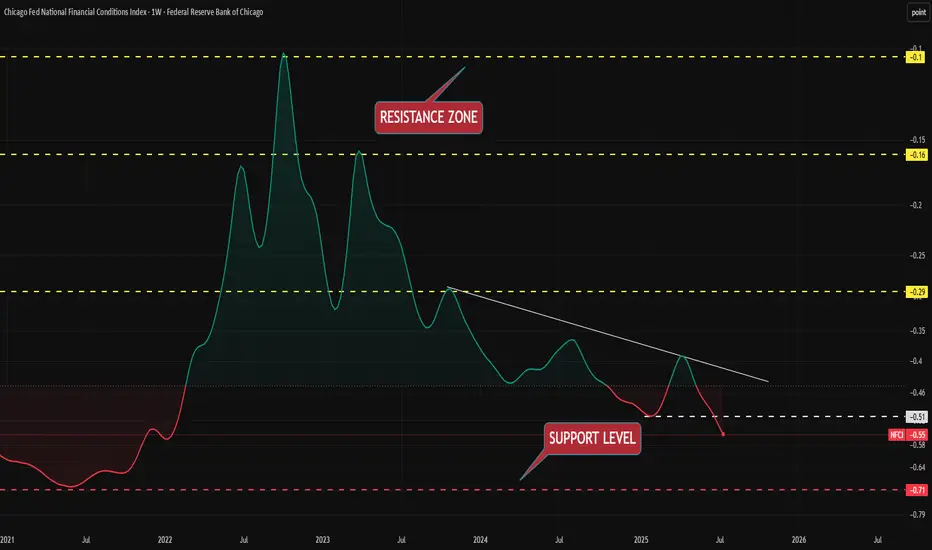
NFCI index for detecting ALT seasonThe NFCI index for identifying ALT season is one of several indDEX derived from, among others, the Federal Reserve interest rate.
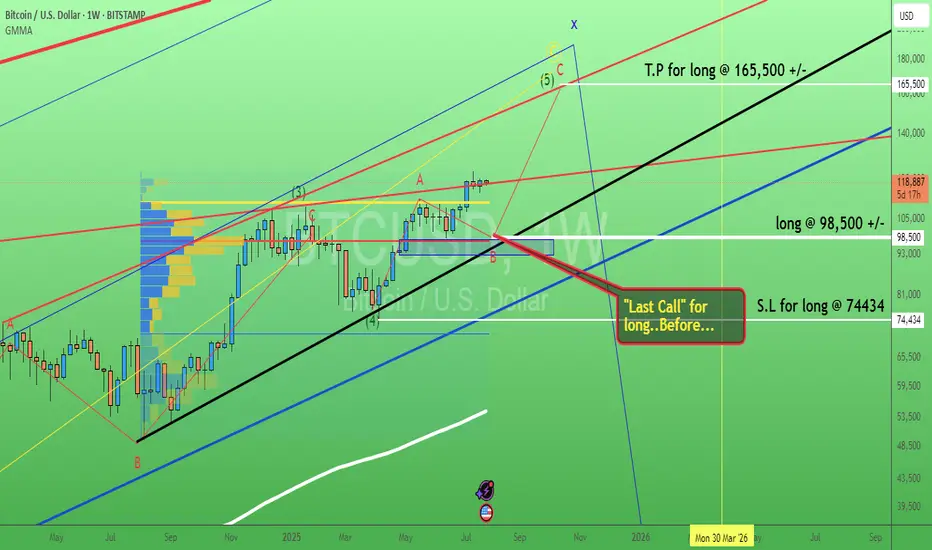
Bitcoin. Last call buy level? 29/July/25BTCUSD probably will have pullback toward confluence zone of 1) Trendline Support 2) Order Block 3) POC of volume before hitting ATH again
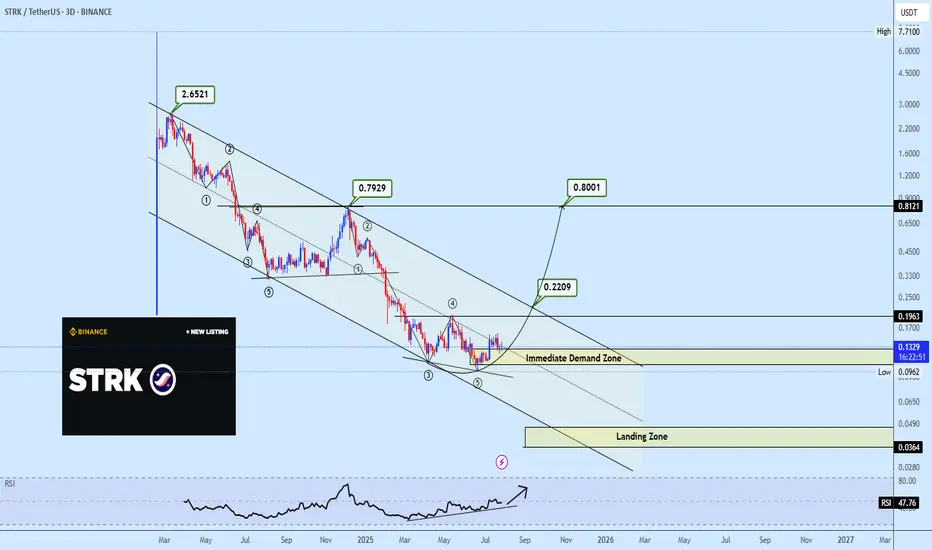
Descending Channel in Play STRK’s Next Move Could Be ExplosiveSTRKUSDT continues its decline within a well-defined descending channel, with the most recent bounce coming directly off the bottom boundary of the channel. This rebound aligns with a confirmed bullish divergence on the RSI, suggesting the current move may mark a key inflection point.
As price climbs, attention now shifts to the upper boundary of the channel, which serves as a key structural resistance. A break above this upper trendline would signify a reversal from the prevailing downtrend, validating the first higher high in the micro to mid-term, with upside potential toward $0.2422 and $0.7856, as shown on the chart.
However, failure to clear the upper boundary could trigger a sharp rejection and initiate another round of sell-off, potentially dragging price into a deeper landing zone below the demand level.
daily outlook 7-29-25daily outlook 7-29-25 = in this outlook i show my friends what i am gonna trade for today.
