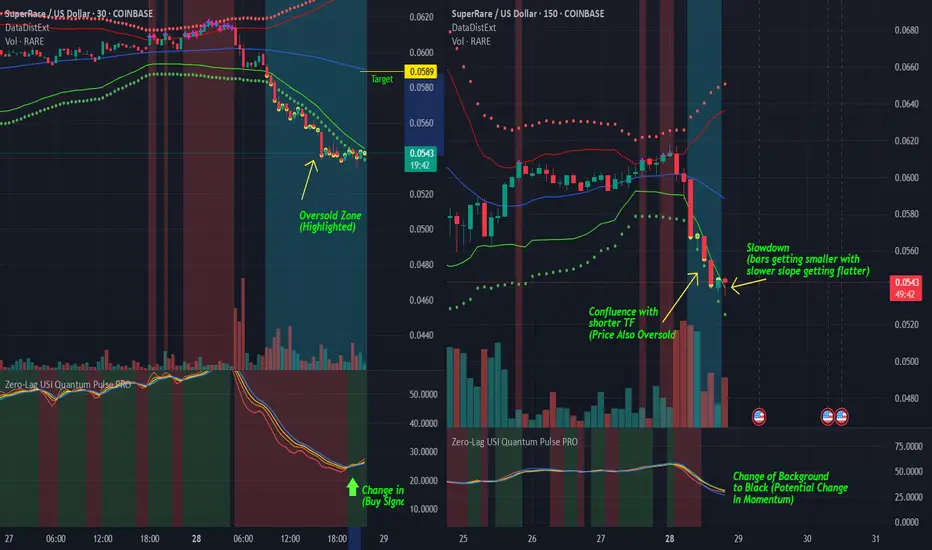
Potential 8.6% gain in RAREUSDPotential 8.6% gain in RAREUSD pair for the following reasons:
Longer-term Chart (150min)
-As seen in the longer time frame (150min), we can see that the price of RARE is overextended to the downside (Using custom Data Distribution with Extreme Clusters indicator showing yellow dots and highlighted background)
-Custom indicator below (Zero-Lag USI) has changed background from red to black, meaning that there is a potential reversal in momentum coming.
-Technically, we can see that there is a slowdown in slope of the move, and the bars here are getting smaller with the tails at the bottom, showing strength to the upside.
Shorter-term Chart (30min)
-Custom Data Distribution with Extreme Clusters script is also showing oversold levels in agreement with the 150min chart, showing confluence.
-Custom Zero-Lag USI script is showing a green background (shown here by the green arrow), which means that the strength is already potentially shifting here. We hope that this potential change in momentum will eventually shift/spill over to a larger time frame. Thus, the USI on longer time frame should eventually also change from the black background to the green background, showing a gain in strength and potential reversal to the upside on the 150min chart.
Wave Analysis
Bullish Sentiment Returns to Gold?Hello everyone, what are your thoughts on XAUUSD?
From a technical perspective, XAUUSD has just retested its long-term ascending trendline and formed a bullish reaction candle, suggesting that buying pressure may be returning.
Recently, a survey of 206 investors revealed that market sentiment remains optimistic, with 66% expecting gold prices to continue rising, 19% predicting a decline, and 15% anticipating a sideways market.
What do you think? Share your opinion in the comments!

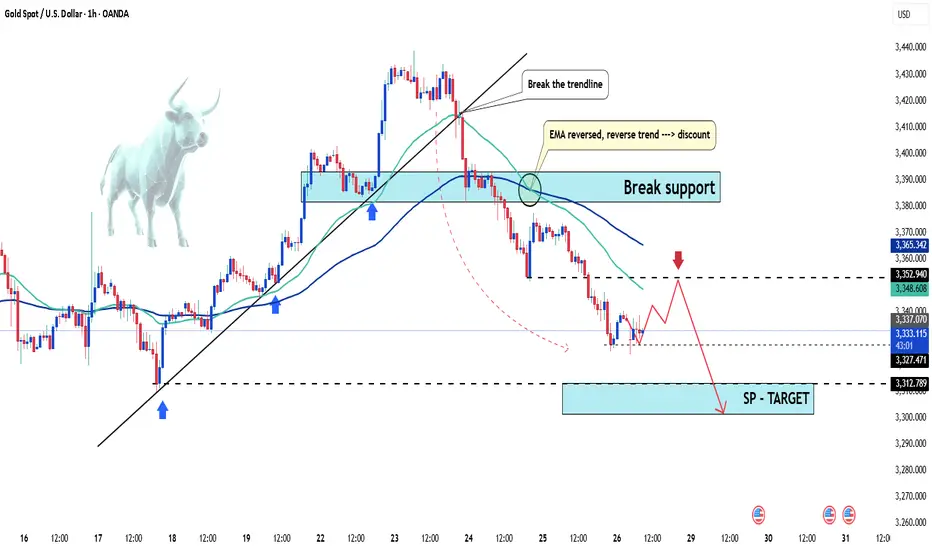
Gold Under Pressure – Temporary Pullback or Start of a DowntrendHello everyone, great to see you again.
Today, let’s focus on the bearish factors surrounding gold. At the time of writing, gold is trading around 3,331 USD, down 50 pips on the day, continuing its downward correction since the end of last week.
Within just a few days, gold has plunged from its peak of 3,433 USD—losing nearly 100 USD per ounce.
This sharp drop is largely driven by profit-taking and market anticipation ahead of key economic data next week, including U.S. interest rate decisions, inflation, and job reports.
This week is packed with critical updates: growth figures, inflation stats, employment numbers, and monetary policy decisions from major central banks—all of which could significantly impact gold’s next move.
According to a recent survey, 36% of analysts expect gold to fall further, while retail investors remain optimistic about a rebound.
For now, the market is clearly in a correction phase. Caution is advised.
What do you think—will gold bounce back or continue to drop?
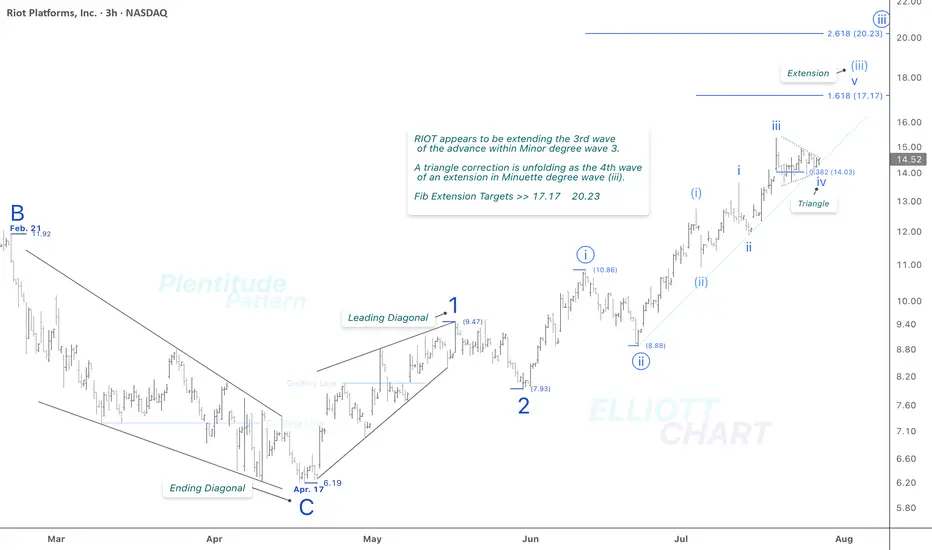
RIOT / 3hThere is no specific change in NASDAQ:RIOT 's previous analysis. As depicted on the 3h frame above, it appears to be extending the third wave of an impulsive advance within Minor degree wave 3. As anticipated, a triangle correction has emerged as the fourth wave within the ongoing extension of the Minuette wave (iii).
The Fibonacci extension levels of 17.17 and 20.23 remain valid and continue to align with the current wave structure.
>>> In this timeframe, I'm analyzing the initial rising tide within the ongoing Intermediate degree wave (1), where a nested series of waves have quite well revealed: 1, 2 → i (circled), ii (circled) → (i), (ii) → i, ii. The extreme high of this impulsive sequence lies beyond the visible range of the current chart.
NASDAQ:RIOT CRYPTOCAP:BTC BITSTAMP:BTCUSD MARKETSCOM:BITCOIN
#CryptoStocks #RIOT #BTCMining #Bitcoin #BTC
Trade management for NZD/AUDThe US-EU trade deal boosted USD demand and jolted FX markets at the open. This, coupled with low liquidity during the Monday Asian session caused a gap in this pair. Our short term trade was taken out at break even, while our medium term trade narrowly survived. This was a technical play in an odd pair, opportunistic while doing some charting :) I took profit at 1:1 and will wait to deploy capital elsewhere.

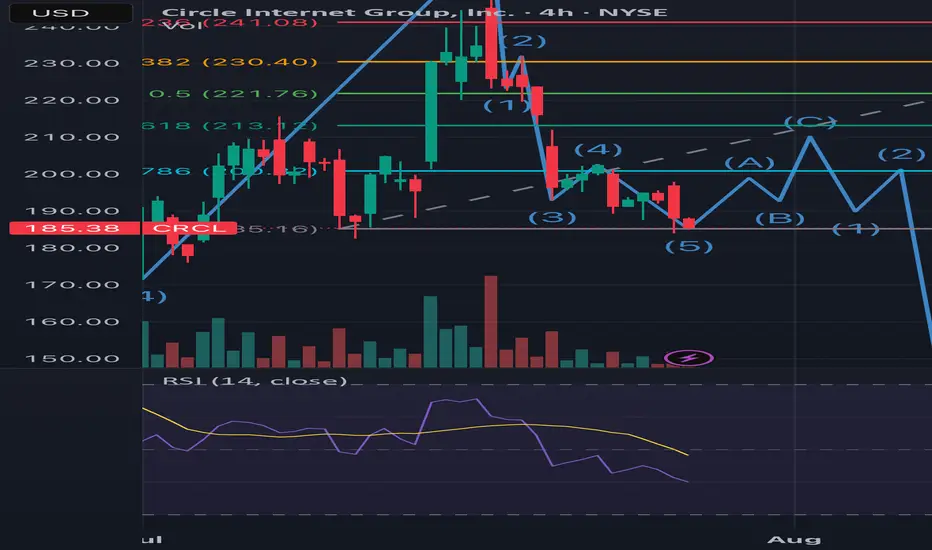
What goes around comes full CRCLFor the record, I bought in at ~$220 and looking to exit to ethical reasons. I believe that this stock will reach over $400USD for the end of the year but with every l opportunity left off for a greater cause, there will always be a greater reward.
1. Notice the end of the first 5 wave Elliot Impulse coincides with the passing of the GENIUS bill. Wave 3 peak was the ATH and wave 5 was the Friday peak of around $262.
2. We’ve entered the correction where sellers are looking to close from the hype
Wave 1 of the correction was the sell off from the wave 5 peak.
From the chart you can see the 3 wave correction is beginning with wave 1 of the 3 coming to an end.
Good news if you want to swing it to 213, this would be a good entry. Bad news if you want ito t hold it for ATH as it means you’d have to bear the third wave of the correction phase (gap fill ~$216), from there I’m expecting the huge sell off post earnings and FED expectations.
However, after retracing a new cycle will emerge led by major catalysts like the CLARITY Bill, CIRCLE’s bank charter application, USDT diminishing presence in the US and the adoption of USDC even possibly making it the standard stablecoin for all US crypto activity, DE-Fi growth and tradfi participation and growth in their MMF and remittance segments. This will kick start a new run where the highs of $400 will be achieved.
So target next high (earnings time) is $213. I assume price will not go below this region. But a recommended sell until q4
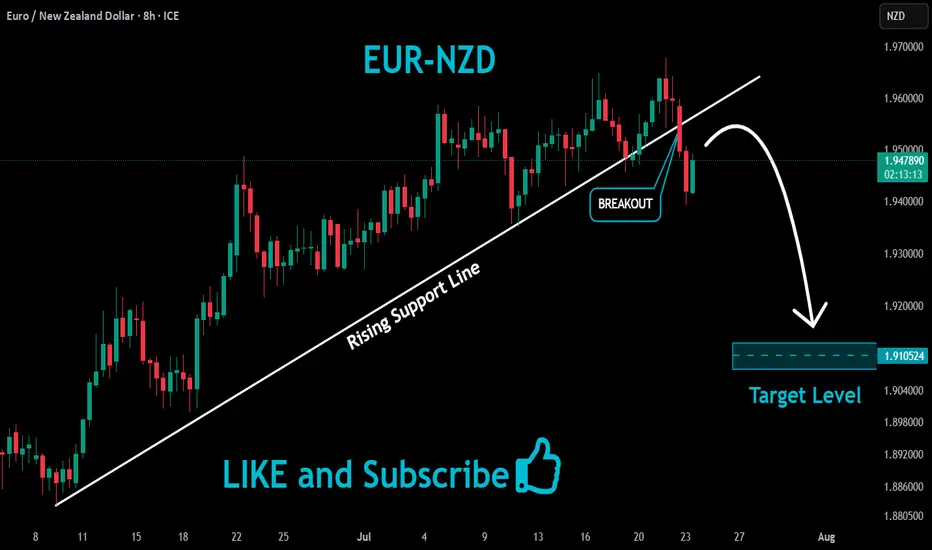
EURNZD Bearish Breakout !
HI,Traders !
#EURNZD was trading along
The rising support line but
Now we are seeing a bearish
Breakout so we are bearish
Biased and we will be expecting
A further bearish move down !
Comment and subscribe to help us grow !
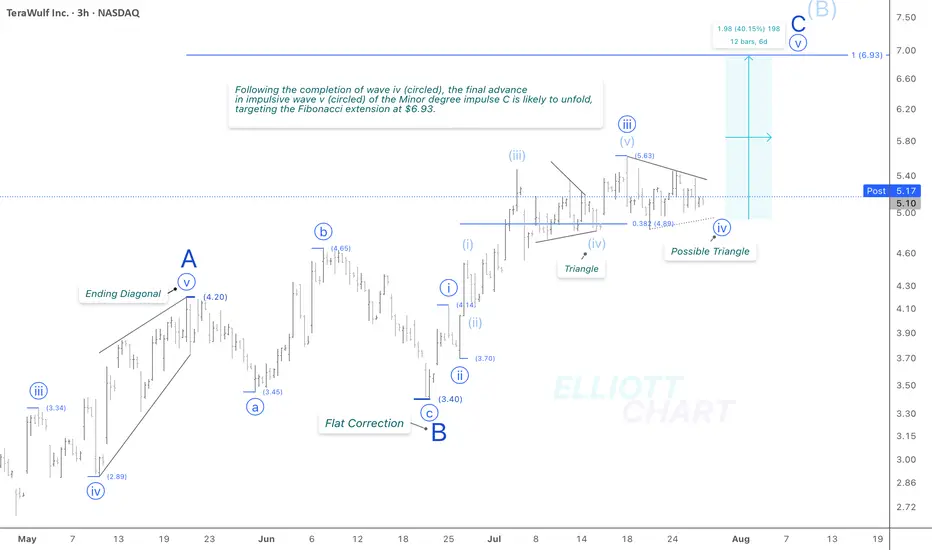
WULF / 3hNASDAQ:WULF traded sideways today, as expected, with no significant change to the broader outlook. The ongoing consolidation continues to support the current wave structure—specifically, a developing triangle in wave iv (circled), which may be forming ahead of the anticipated final advance in wave v (circled).
The Fibonacci extension target >> 6.93 remains valid.
Trend Analysis >> Upon completion of Minor degree wave C, the countertrend advance of Intermediate degree wave (B), which has been unfolding since April 9, is likely to give way to a decline in wave (C) of the same degree. This downtrend might begin in the coming days and potentially extend through the end of the year!!
NASDAQ:WULF CRYPTOCAP:BTC BITSTAMP:BTCUSD MARKETSCOM:BITCOIN
#CryptoStocks #WULF #BTCMining #Bitcoin #BTC
Google HTF Swing Short Wyoff Distribution PatternBased off HTF Wykoff Distribution Pattern. Overall target top 250ish Based off fibtrend/extensions. Followed by a ABC corrective pattern to play out over several months.

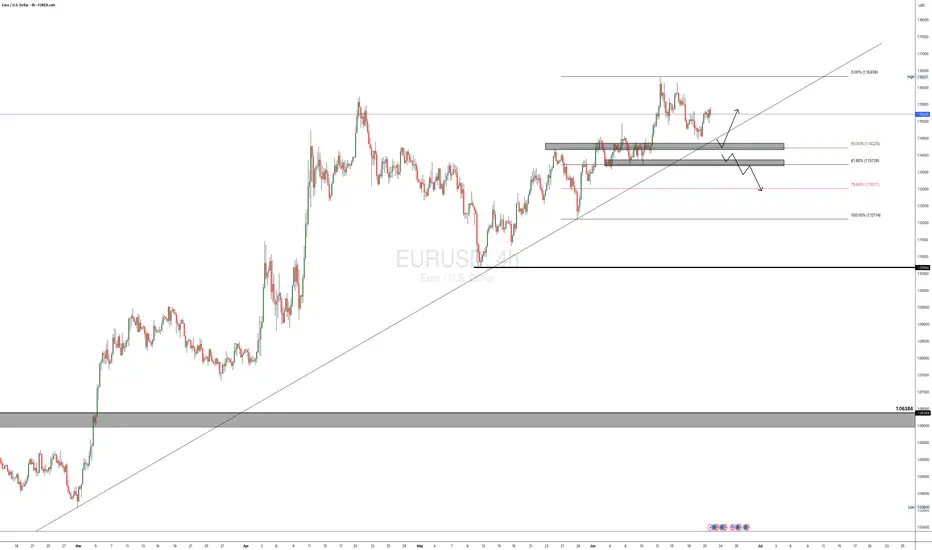
EURUSD POSSIBLE TRADE SETUP💶 Potential Trade Setup on EURUSD
Overview:
Since March, EURUSD has shown consistent bullish momentum, especially after breaking through the key 1.0600 supply zone.
The pair has maintained higher highs and higher lows, suggesting continued strength in the medium term.
That said, I am still quite anticipating for a possible continuation of the bullish momentum that started a long time ago, and moving forward, I will anticipate for a clear retest of the 50% fib at the 1.1425 region, then I go in for the kill.
Alternatively, there is a clear short opportunity, provided that, the bullish trendline is broken and the 1.1370 region is broken to the downside, this is a bit far a stretch, but it is in play. "IF" the DXY keeps the bullish momentum going.
🧭 Trading Plan:
✅ BUY Bias (Primary Plan):
Look for a retest of the 50% Fibonacci retracement zone around 1.1425. This aligns with the ongoing momentum on the 4H timeframe.
🔻 SELL Bias (Alternative Scenario):
If price breaks the bullish trendline and the 1.1370 support zone, a short opportunity opens up.
This is only valid if DXY continues to strengthen, shifting sentiment.
🎯 Targets & Risk Management: Targeting 1:2 R:R on both setups.
Ensure entries are backed by price action signals and confluences.
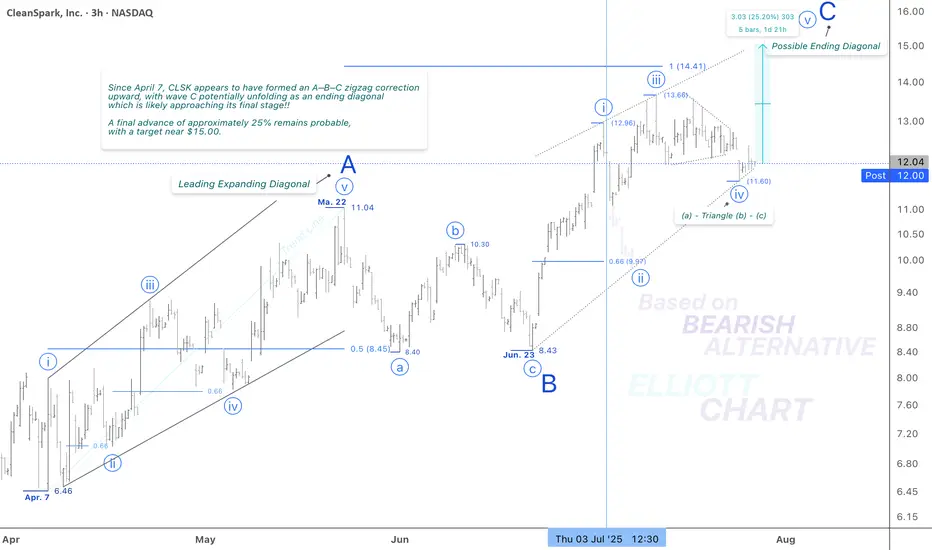
CLSK / 3hNASDAQ:CLSK has been trading with a slight upward bias ahead of a potentially final advance, projected to gain approximately 25% with a target near $15.00.
Wave Analysis >> As illustrated in the 3h-frame above, Minor wave C—completing the corrective upward move of wave (B)—appears to be unfolding as an ending diagonal, now likely in its final stages. Within this structure, the Minute wave iv (circled) has formed a correction. A final push higher in Minute wave v (circled) is now expected, which would complete the ending diagonal pattern of wave C, and in turn, conclude the countertrend advance of wave (B).
Trend Analysis >> Upon completion of the potential ending diagonal in Minor wave C, the broader trend is anticipated to reverse to the downside, initiating the final decline in Intermediate wave (C). This bearish phase may extend through the remainder of the year.
#CryptoStocks #CLSK #BTCMining #Bitcoin #BTC
NASDAQ:CLSK CRYPTOCAP:BTC BITSTAMP:BTCUSD MARKETSCOM:BITCOIN
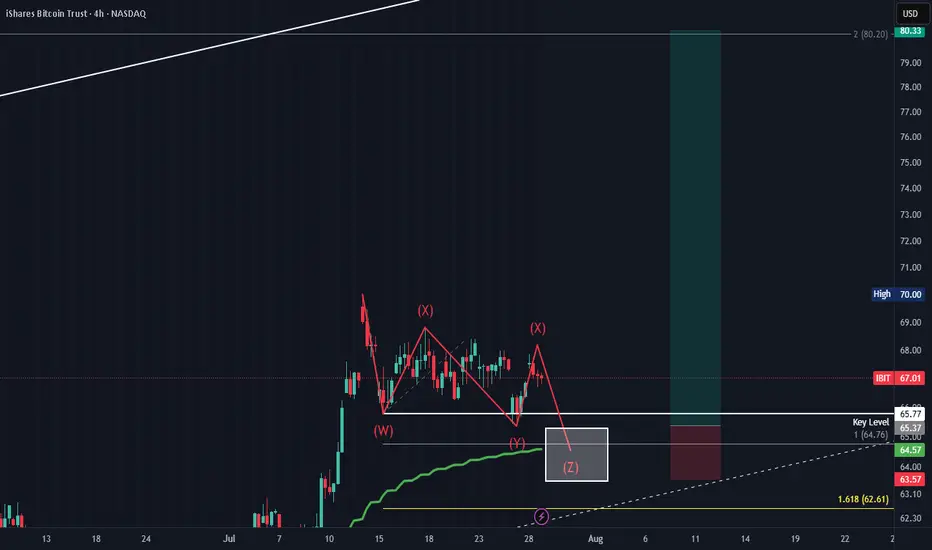
IBIT swing long. WYXYZ corrective pattern.Potential swing long setup. WXYXZ corrective pattern. Taking the lows 1 more time onto the 1 to 1 fib trend. Overall target 80 which should align with BTC hitting 135-150k.
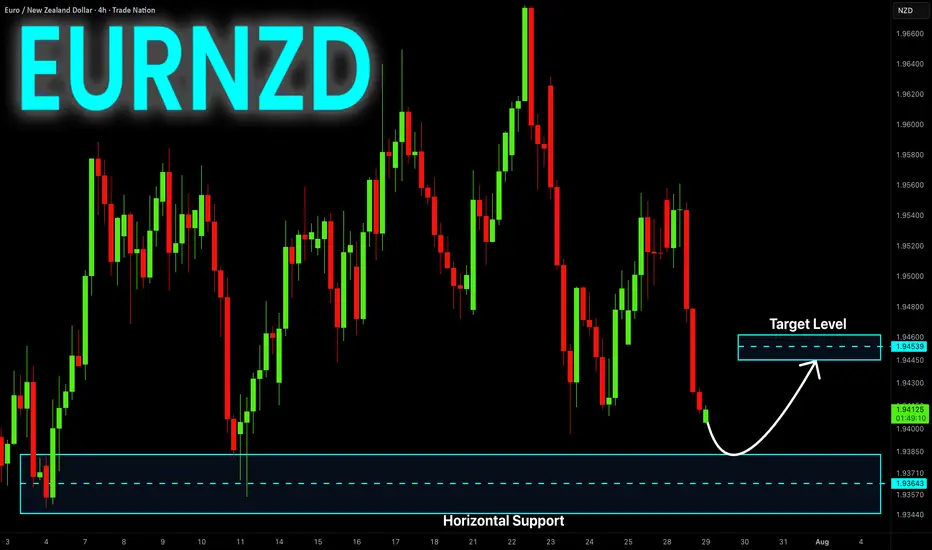
EUR-NZD Will Grow! Buy!
Hello,Traders!
EUR-NZD keeps falling
Down and we are bearish
Biased mid-term but there is
A horizontal support level
Below at 1.9370 so after
The retest we might expect
A local bullish correction
Buy!
Comment and subscribe to help us grow!
Check out other forecasts below too!
Disclosure: I am part of Trade Nation's Influencer program and receive a monthly fee for using their TradingView charts in my analysis.
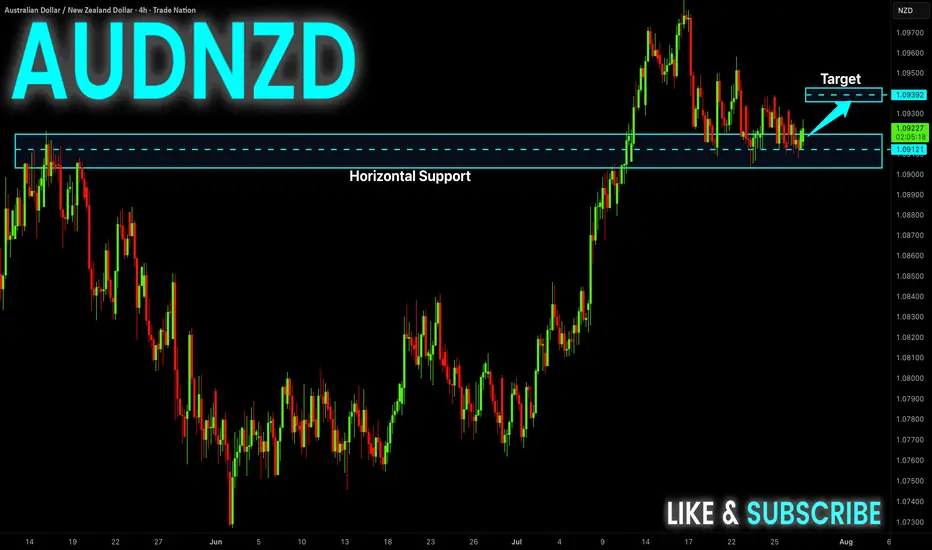
AUD-NZD Rebound Ahead! Buy!
Hello,Traders!
AUD-NZD made a retest
Of the wide horizontal support
Level again at 1.0909 and we
Are already seeing a bullish
Reaction so a local bullish
Rebound can be expected
Buy!
Comment and subscribe to help us grow!
Check out other forecasts below too!
Disclosure: I am part of Trade Nation's Influencer program and receive a monthly fee for using their TradingView charts in my analysis.
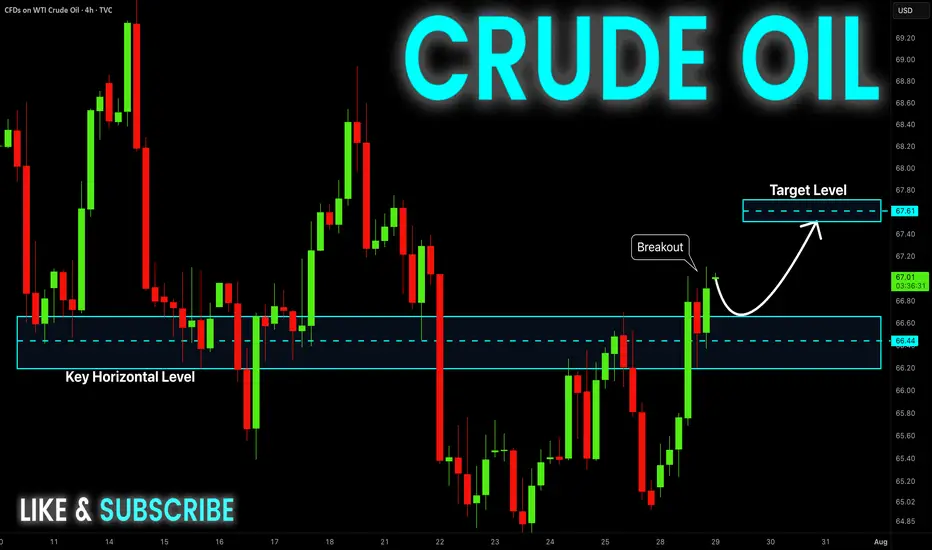
CRUDE OIL Bullish Continuation! Buy!
Hello,Traders!
CRUDE OIL made a rebound
From the support just as
I predicted and the price
Went further still and broke
The key horizontal level
Of 66.50$ and the breakout
Is confirmed so we are
Bullish biased and we will be
Expecting a further bullish
Move up!
Buy!
Comment and subscribe to help us grow!
Check out other forecasts below too!
Disclosure: I am part of Trade Nation's Influencer program and receive a monthly fee for using their TradingView charts in my analysis.
XHB HTF Elliot Wave Count and Wykoff Distribution HTF Elliot Wave Count aligning with HTF Wykoff Distribution Pattern. In confluence with Fibonnacci trend/extension and fibonnaci time. Also further confluence with SPX HTF Wave Count and Distribution

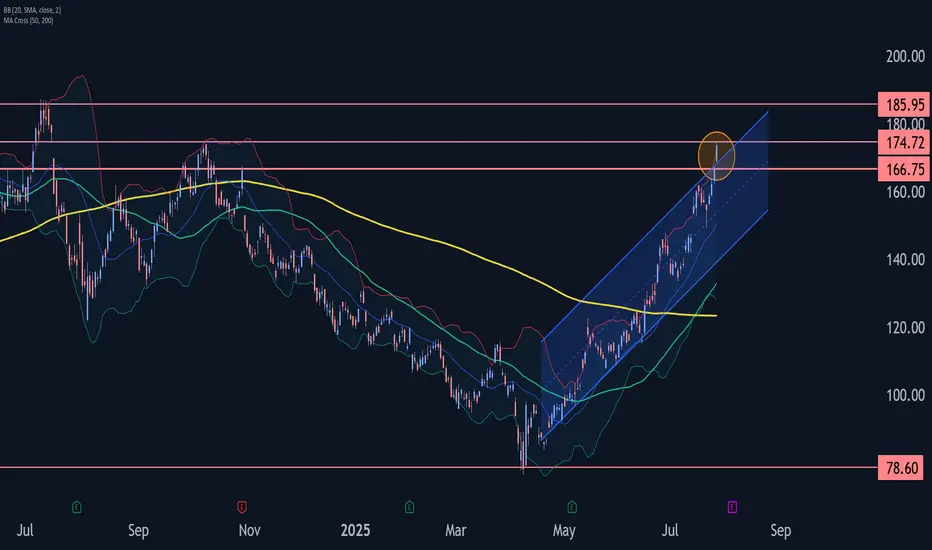
AMD Wave Analysis – 28 July 2025
- AMD broke resistance zone
- Likely to rise to resistance level 185.95
AMD recently broke the resistance zone between the resistance level 166.75 and the upper resistance trendline of the daily up channel from April.
The breakout of this resistance zone accelerated the active impulse waves 3 and (3).
Given the overriding daily uptrend, AMD can be expected to rise to the next resistance level 185.95 (former multi-month high from July of 2024).
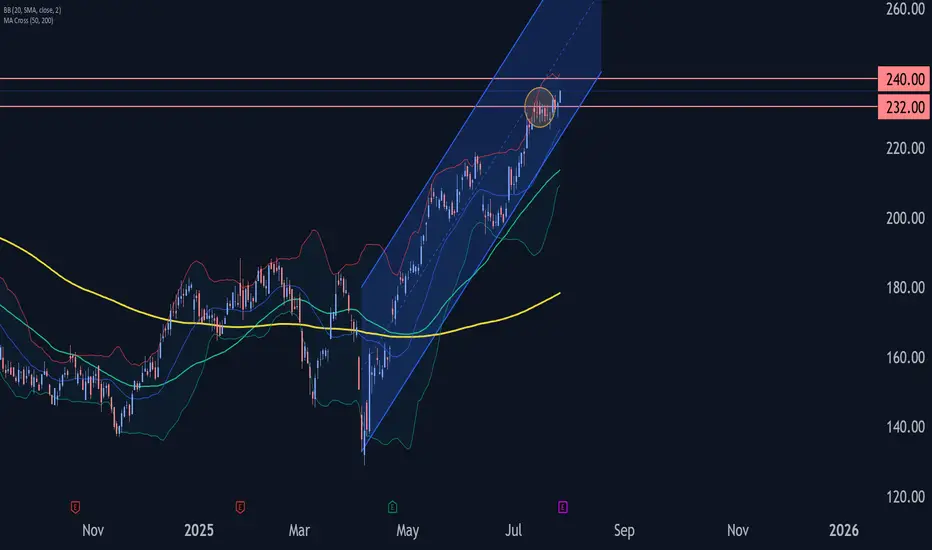
Boeing Wave Analysis – 28 July 2025- Boeing broke the resistance level 232.50
- Likely to rise to resistance level 240.00
Boeing recently broke the resistance level 232.50 (which stopped the previous minor impulse wave 3 in the middle of July, as can be seen below).
The breakout of the resistance level 232.50 continues the active short-term impulse wave 5 of the intermediate impulse wave (C) from June.
Given the clear daily uptrend, Boeing can be expected to rise further toward the next resistance level 240.00.
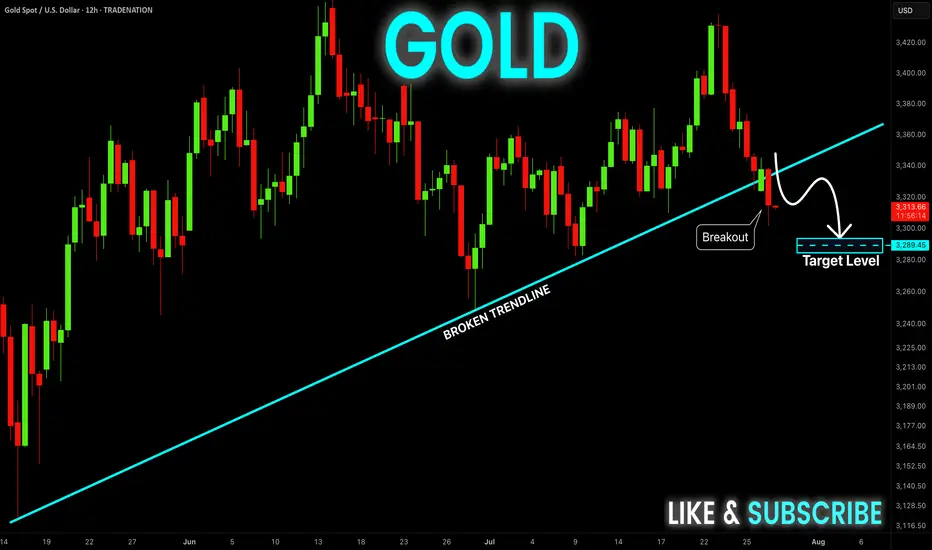
GOLD Epic Trendline Breakout! Sell!
Hello,Traders!
GOLD was trading along
A long-term trend-line but
It is broken now and the
Breakout is confirmed so
We are bearish biased now
And we will be expecting a
Further bearish move down
Sell!
Comment and subscribe to help us grow!
Check out other forecasts below too!
Disclosure: I am part of Trade Nation's Influencer program and receive a monthly fee for using their TradingView charts in my analysis.
SPX Elliot Wave Count, Wykoff DistributionBased off the HTF elliot wave count aligning and in confluence with a HTF Wykoff distribution. With the top coming in between 6600-7000ish around September 2025 till January 2026. Further confluence with trendline, fibonnacci time and fibonnaci trend and extension.

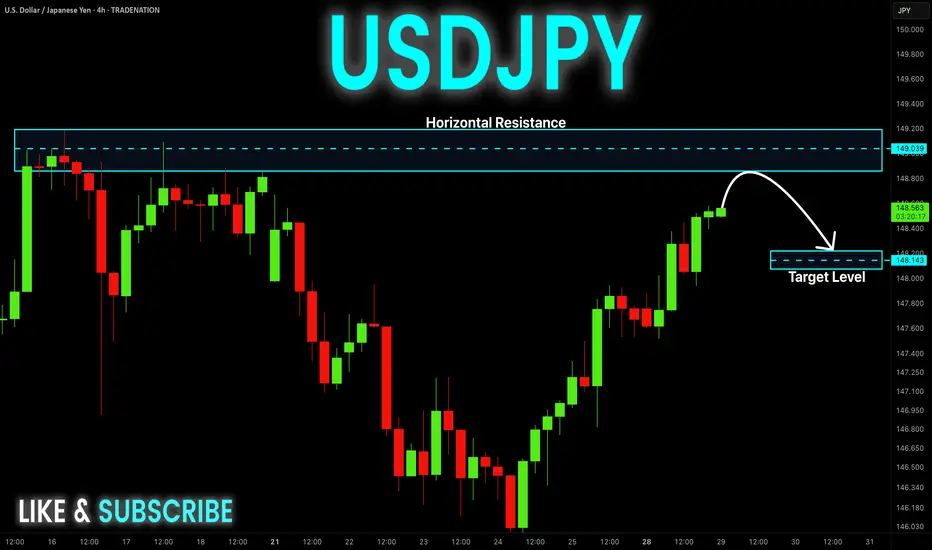
USD-JPY Is Overbought! Sell!
Hello,Traders!
USD-JPY is trading in a
Strong uptrend and the pair
Will soon hit a horizontal
Resistance of 149.200
So after the retest a
Local bearish pullback
Is to be expected
Sell!
Comment and subscribe to help us grow!
Check out other forecasts below too!
Disclosure: I am part of Trade Nation's Influencer program and receive a monthly fee for using their TradingView charts in my analysis.
XAU/USD – Current Wave Count & Potential ScenariosOANDA:XAUUSD
We are currently moving from (white) wave 3 to (white) wave 4.
So far, I am leaning towards the white count where the waves labeled (A), (B), (C) form a larger corrective wave A, which leads to wave B, and then to (white) wave 4.
Up to now, we have only completed (A) and (B).
Now, in the yellow bracket, we can interpret a 1-2-3-4-5 structure leading to (white) wave C 🟡.
Alternatively, one could interpret a triangle pattern (pink count):
Waves A, B, C, D, E, which would then form our wave 4.
In that case, we would expect bullish targets afterwards 🚀.
We need to watch closely if the price reverses or breaks through our yellow Fibonacci zone 🟡.
For now, we are primarily looking for upside potential 🔼.
From our yellow wave 2, we saw a downward push, which could theoretically be our yellow wave 1 leading into yellow wave 2 and the yellow Fibonacci zone — essentially a five-wave move from wave 2 to wave 3.

EURUSD BUYThe US Dollar (USD) gapped lower at the weekly opening amid optimism fueling demand for high-yielding assets, following news that the United States (US) and the European Union (EU) reached a trade deal.
The US and the EU agreed a 15% tariff on most European goods entering the US, much higher than the average 4.8% exporters face these days. No rates will apply to EU exports in important sectors, including aircraft parts, some chemicals, semiconductor equipment and some agricultural products.
The EU response to the headline was uneven. European Central Bank (ECB) policymaker Peter Kazimir said on Monday that the trade deal reduces uncertainty, but it is unclear for now how it impacts inflation. However, the French prime minister, François Bayrou, said the EU has capitulated to Donald Trump’s threats, adding it is a “dark day” for the EU. The trade focus now shifts to the US-China as officials from both countries resume talks in Stockholm.
The EUR/USD pair peaked at 1.1771 during Asian trading hours, but changed course early in Europe, with the USD surging across the FX board, resulting in the pair shedding over 100 pips.
The macroeconomic calendar had nothing relevant to offer at the beginning of the week, but will be flooded with first-tier releases, including US employment-related data ahead of the Nonfarm Payrolls report on Friday, the preliminary estimates of the Q2 Gross Domestic Product (GDP) for the US and the EU, and inflation updates. On top of that, the Federal Reserve (Fed) will announce its decision on monetary policy on Wednesday.
RESISTANCE 1.16050
RESISTANCE 1.16243
RESISTANCE 1.16451
SUPPORT 1.15856
SUPPORT 1.15711
