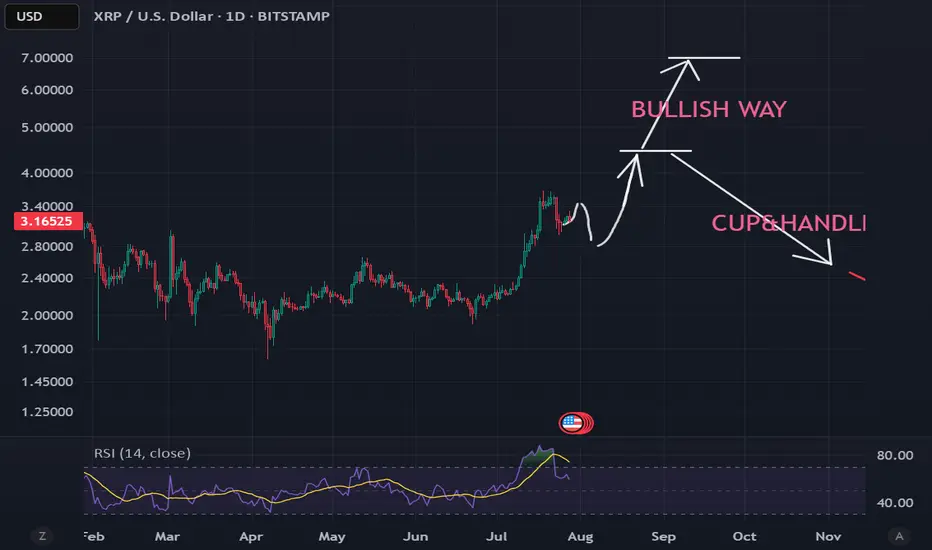
XRP: PullbackRipple’s XRP has once again seen a significant pullback since last Monday, raising the possibility that the high of turquoise wave B may already be in. For now, however, we continue to allow room for this corrective move to extend up to resistance at $4.09, before turquoise wave C drives the altcoin lower toward the magenta wave (2) low. With XRP still trading well above the $0.38 support level, the next upward impulse—magenta wave (3)—should then begin to take shape. Alternatively, there is a 33% chance that this bullish move has already started; however, this scenario would only be confirmed by a decisive break above the $4.09 level.
📈 Over 190 precise analyses, clear entry points, and defined Target Zones - that's what we do (for more: look to the right).
Wave Analysis

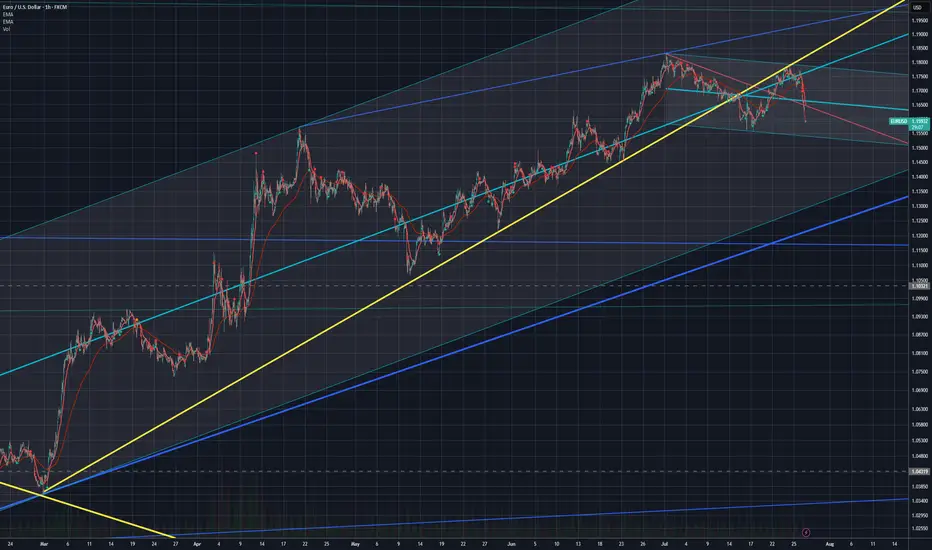
Eurusd retraces1st target is low channel 1 line (1,1543).
Red line is magnet... (1,1684-92)
Oscilation between theese two lines....
Expect slow corrective pattern (>1.1610,1,16411,1692)
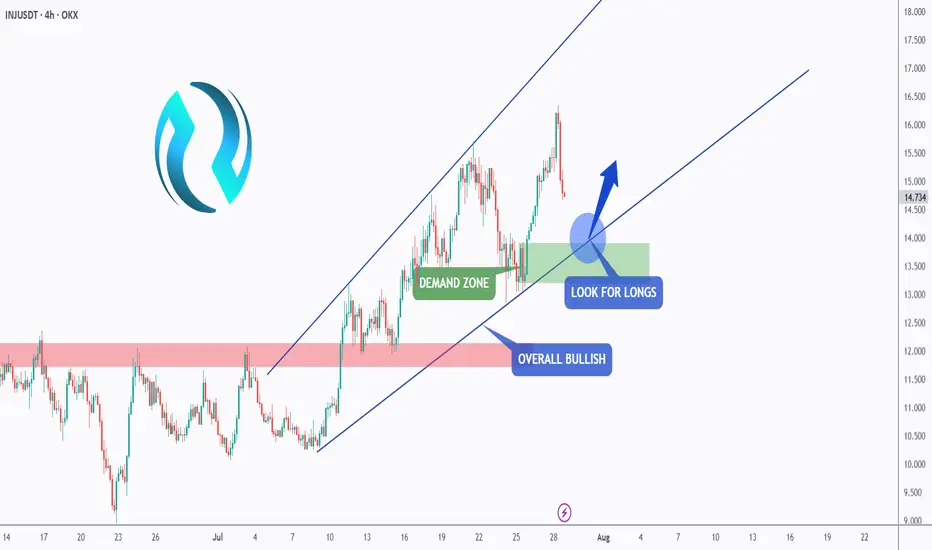
INJ - Back Bullish!Hello TradingView Family / Fellow Traders. This is Richard, also known as theSignalyst.
📈INJ has been overall bullish trading within the rising wedge pattern marked in blue.
This week, INJ has been retesting the lower bound of the wedge.
Moreover, the green zone is a strong demand.
🏹 Thus, the highlighted blue circle is a strong area to look for buy setups as it is the intersection of the lower blue trendline and green demand.
📚 As per my trading style:
As #INJ approaches the blue circle zone, I will be looking for trend-following bullish reversal setups (like a double bottom pattern, trendline break , and so on...)
📚 Always follow your trading plan regarding entry, risk management, and trade management.
Good luck!
All Strategies Are Good; If Managed Properly!
~Richard Nasr
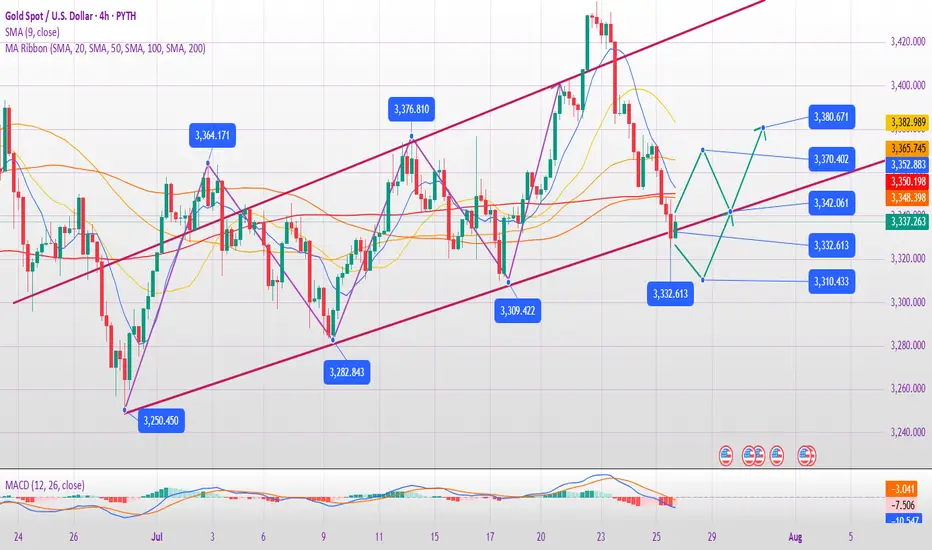
Analysis and strategy of gold market on July 28:
Core influencing factors
Risk aversion cools down: Despite frequent geopolitical risk events, market panic has not significantly increased, weakening gold safe-haven buying.
US dollar strengthens: US economic data supports the continuous rise of the US dollar, and funds flow back to US dollar assets, suppressing the attractiveness of gold.
ETF holdings outflow: Short-term risk appetite has rebounded, and gold ETFs have seen a slight outflow of funds, reflecting the cautious attitude of the market.
Key events focus:
US-EU and US-China trade negotiations: If progress is optimistic, gold prices may fall to the $3,300/ounce mark.
Federal Reserve resolution: Pay attention to policy independence (affected by Trump's pressure) and interest rate guidance.
Non-farm data: Released on Friday, if the employment data is strong, it may strengthen the US dollar to further suppress gold.
Key technical points
Weekly level:
Watershed $3,325: If it is held, it will maintain high-level fluctuations, and if it is lost, it will open up downward space.
Support area: If the daily support is broken, the weekly support may be tested (reference 3300-3310).
Daily level:
Key support: The current daily support is facing the risk of breaking down, and we need to be alert to the acceleration of short positions.
4-hour level:
Resistance 3388 US dollars (middle track): Before the rebound is not broken, the short-term is short.
Weak signal: The price continues to run below 3363, and the rebound is weak.
Hourly chart:
Strong and weak boundary 3363 US dollars: Maintain weakness before breaking, and avoid bottom-fishing against the trend in the negative market.
Operation strategy suggestions
Short-term direction: Short-selling on rebound is the main, supplemented by light-weight buying at key support levels.
Short-term selling opportunities:
Ideal entry: 3370-3375 area (below the 4-hour middle track), stop loss above 3380.
Target: 3320-3310, if it breaks down, look at 3300.
Opportunities to buy long orders in the short term:
Participate cautiously: If the support of 3320-3310 stabilizes, combine the K-line signal to hold a light long position, and stop loss below 3300.
Quick in and out: You can exit the market when it rebounds to 3340-3350.
Risk warning:
Before the Fed’s decision: Avoid heavy positions, and be wary of unexpected hawkish policies that cause volatility.
Non-agricultural data: If the data exceeds expectations, it will be bearish for gold.
Summary: Gold is short-term technically bearish, but be wary of event-driven reversals. Trading requires strict stop losses and flexible response to data and policy risks.
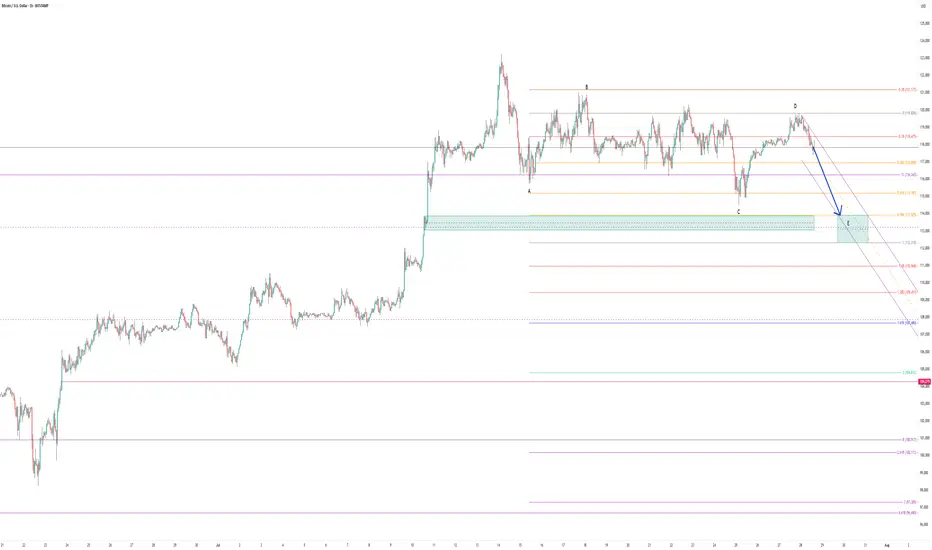
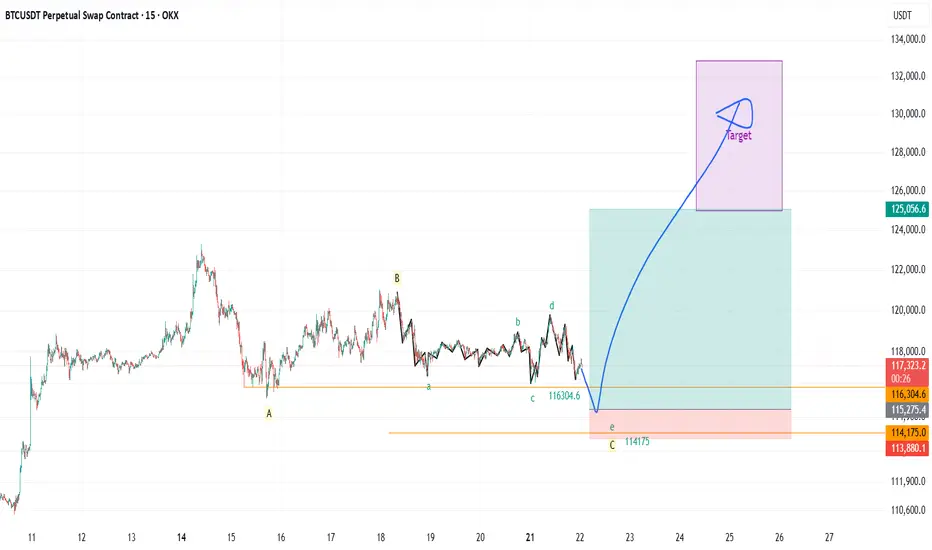
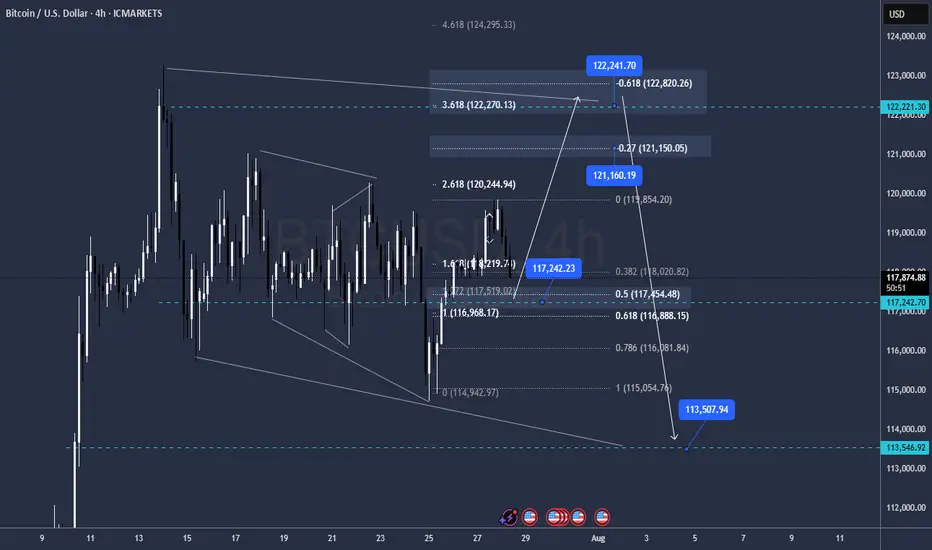
BTCUSD lower toward <113,000-ishI think we are in an Elliotwave A-B-C-D-E pattern, whereas E is delevoping. Price target toward $112,319 - $113,925
From a daily perspective, we can go as lower towards the $95k's...but let see where the next few days takes us.
I'm wrong is we break/close $119,826
Analysis and strategy of gold market on July 28:
Core influencing factors
Risk aversion cools down: Despite frequent geopolitical risk events, market panic has not significantly increased, weakening gold safe-haven buying.
US dollar strengthens: US economic data supports the continuous rise of the US dollar, and funds flow back to US dollar assets, suppressing the attractiveness of gold.
ETF holdings outflow: Short-term risk appetite has rebounded, and gold ETFs have seen a slight outflow of funds, reflecting the cautious attitude of the market.
Key events focus:
US-EU and US-China trade negotiations: If progress is optimistic, gold prices may fall to the $3,300/ounce mark.
Federal Reserve resolution: Pay attention to policy independence (affected by Trump's pressure) and interest rate guidance.
Non-farm data: Released on Friday, if the employment data is strong, it may strengthen the US dollar to further suppress gold.
Key technical points
Weekly level:
Watershed $3,325: If it is held, it will maintain high-level fluctuations, and if it is lost, it will open up downward space.
Support area: If the daily support is broken, the weekly support may be tested (reference 3300-3310).
Daily level:
Key support: The current daily support is facing the risk of breaking down, and we need to be alert to the acceleration of short positions.
4-hour level:
Resistance 3388 US dollars (middle track): Before the rebound is not broken, the short-term is short.
Weak signal: The price continues to run below 3363, and the rebound is weak.
Hourly chart:
Strong and weak boundary 3363 US dollars: Maintain weakness before breaking, and avoid bottom-fishing against the trend in the negative market.
Operation strategy suggestions
Short-term direction: Short-selling on rebound is the main, supplemented by light-weight buying at key support levels.
Short-term selling opportunities:
Ideal entry: 3370-3375 area (below the 4-hour middle track), stop loss above 3380.
Target: 3320-3310, if it breaks down, look at 3300.
Opportunities to buy long orders in the short term:
Participate cautiously: If the support of 3320-3310 stabilizes, combine the K-line signal to hold a light long position, and stop loss below 3300.
Quick in and out: You can exit the market when it rebounds to 3340-3350.
Risk warning:
Before the Fed’s decision: Avoid heavy positions, and be wary of unexpected hawkish policies that cause volatility.
Non-agricultural data: If the data exceeds expectations, it will be bearish for gold.
Summary: Gold is short-term technically bearish, but be wary of event-driven reversals. Trading requires strict stop losses and flexible response to data and policy risks.

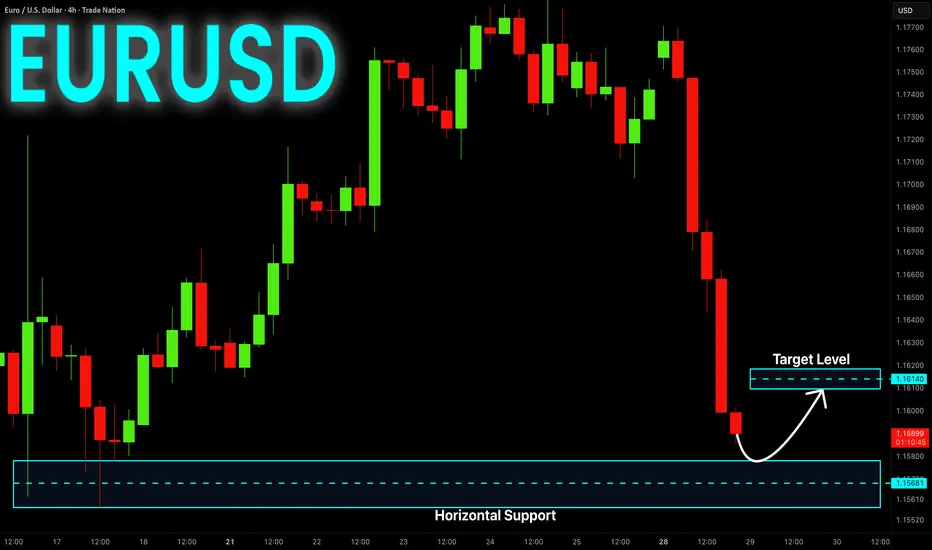
EUR-USD Support Ahead! Buy!
Hello,Traders!
EUR-USD is making a massive
Bearish correction and the pair
Is already locally oversold
So after it hits a horizontal
Support level below at 1.1568
We will be expecting a local
Bullish rebound
Buy!
Comment and subscribe to help us grow!
Check out other forecasts below too!
Disclosure: I am part of Trade Nation's Influencer program and receive a monthly fee for using their TradingView charts in my analysis.
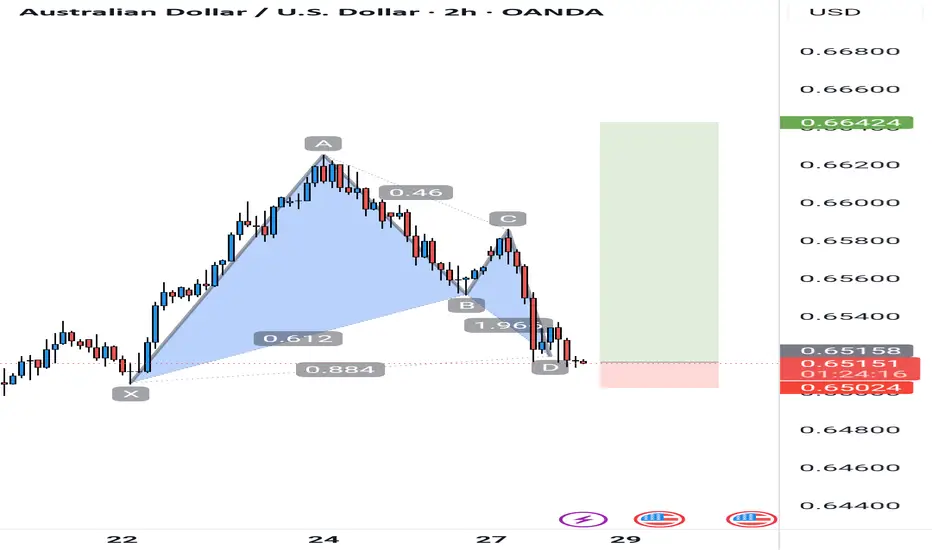
Potential BullsFrom the EW concepts, it looks like a w5 of a leading diagonal is the next print out on a D1 Time frame, and currently is a w4 correction.
By Harmonics, looks like a BAT Pattern finalising H1, and therefore looks like it's time to warm the engines of the chopper ready to fly. Until then we're expecting a bullish move.
EP 01: BTC correction near completionAfter the impulse to last ATH we got a 3 wave correction, last wave being formed by 5 waves, so all together coming to completion. We should visit the liquidation area under last low and swipe that liquidity and aim closer to last ATH if not exceeding it. When the market gives us more information we will go for episode 02.
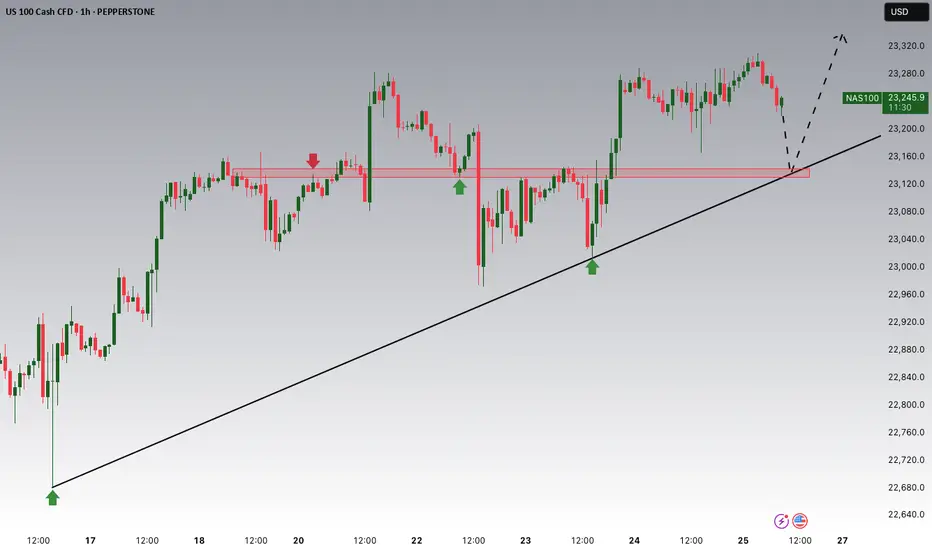
NASDAQ Potential UpsidesHey Traders, in today's trading session we are monitoring NAS100 for a buying opportunity around 23,140 zone, NASDAQ is trading in an uptrend and currently is in a correction phase in which it is approaching the trend 23,140 support and resistance area.
Trade safe, Joe.
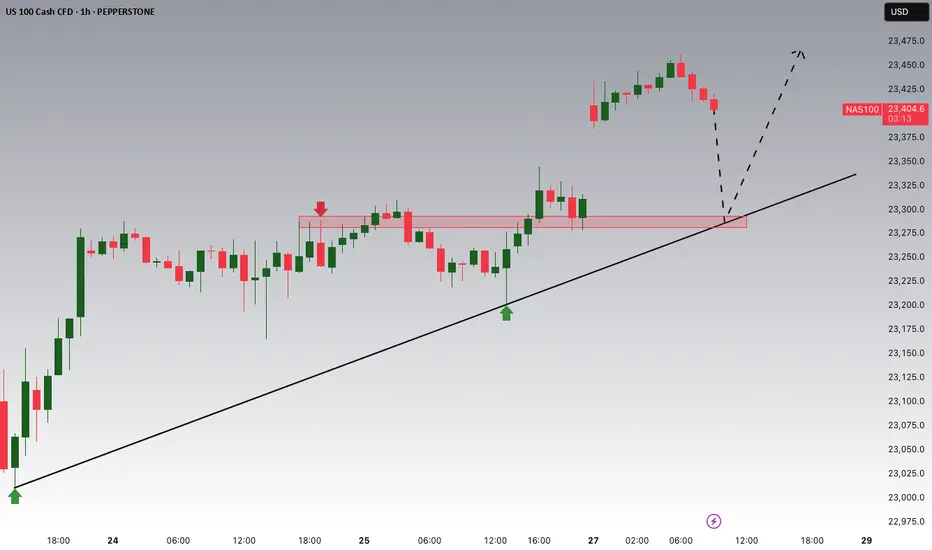
NASDAQ Potential UpsidesHey Traders, in today's trading session we are monitoring NAS100 for a buying opportunity around 23,300 zone, NASDAQ is trading in an uptrend and currently is in a correction phase in which it is approaching the trend at 23,300 support and resistance area.
Trade safe, Joe.
Scalp long position on Gold: R/R 1:3, Risk 1%Hello Guys
You can enter to this long position with maximum risk 1%

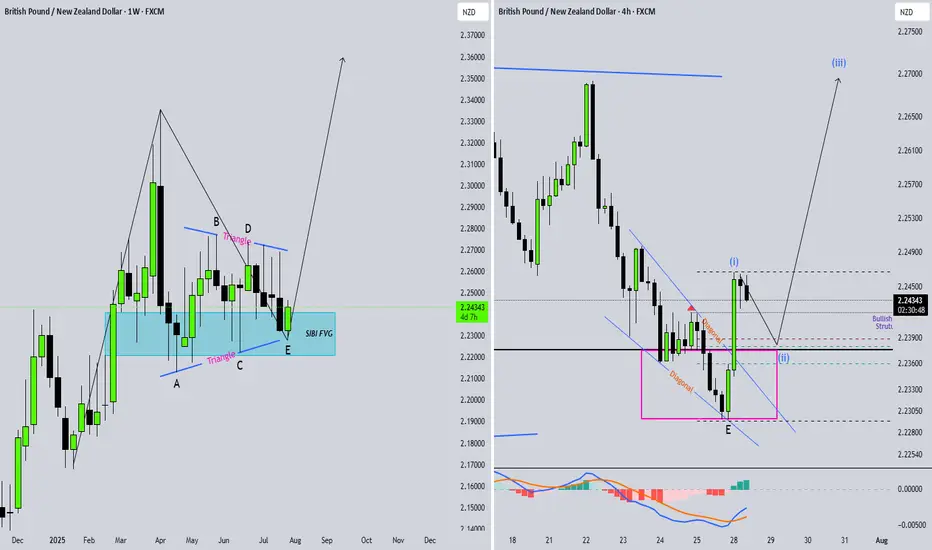
GBPNZD BullishAfter exiting a correction, the first impulse (Wave 1) appears. I expect a retracement of at least 50% of the Fibonacci.

XRPUSD Long, short, longWhole market is manipulated every minute... My prediction can be wrong but I see things this way right now ... Would be grateful for you to share your point of view ...
BTC new meassuresokay impulse is pretty much clear
buy level 117.250 Targtting 121.100 / 122.200 / 122.800
Sell level 122.200 targetting 113.500
Re buy level 113.500 targetting 127.500 / 133.000
GG
Bitcoin & Altcoins: Technical Analysis and Market OutlookBitcoin (BTC) Analysis
Bitcoin is currently forming a short-term bullish pennant within a larger long-term pattern, projecting a potential target around $135K.
Key Levels: BTC is consolidating between the lower zone at $117.3K and the upper zone at $119.7K.
Breakout Potential: A break above this pattern could propel BTC toward a new all-time high (ATH), surpassing the current ATH at $123K.
Macro Events This Week:
Wednesday: The Federal Reserve will announce its interest rate decision, with no changes expected.
Wednesday: ADP Employment Report, providing insights into potential future rate cuts.
Friday: Non-Farm Payrolls (NFP) data release, which could further influence market sentiment.
Ethereum (ETH) Breakout
Ethereum has decisively broken through its 4-year historical resistance around $3,725, closing the week above this level. This breakout signals a strong bullish outlook for ETH, with potential for further upside.
Altcoin Highlights
BNB: Has shattered its previous all-time highs, showcasing significant bullish momentum.
XRP: Reached approximately $3.64, reflecting strong gains and market interest.
Market Context
The crypto market is showing robust activity, with altcoins following Bitcoin and Ethereum's lead. Key macroeconomic events this week could introduce volatility, so traders should stay vigilant.
Disclaimer: This is not financial advice. Every trader is responsible for their own strategy and risk management.
Happy trading and good profits! 🚀

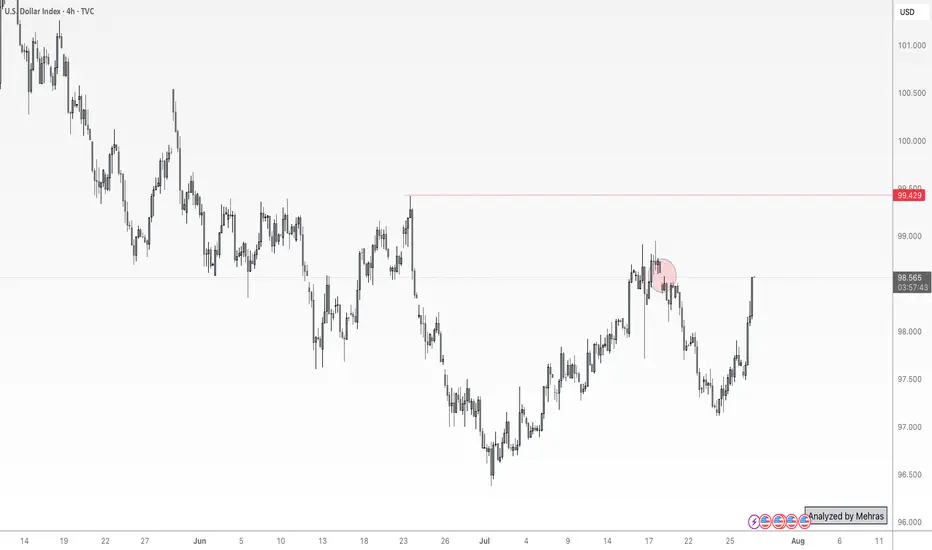
DXY at Its Most Critical Level of 2025 — Will the 100 Bank LevelThe Dollar Index (DXY), just like several other majors, is approaching a very important level. We’re now near the 100 mark, which is not only a psychological level — but also a key institutional (bank) level.
There’s also a gap zone left behind that price is about to fill. I believe the index will stay in a range over the next 1–2 days as it waits for critical data later this week — especially Wednesday’s announcements and Friday’s NFP report, which could set the tone for what’s next.
Based on current market sentiment, Trump’s remarks, Powell’s upcoming speech, and broader macro factors, I believe DXY has the potential to break above 100 and move toward 102–104, if that level is broken cleanly.
Let’s also not forget — price bounced from a monthly demand block near 96, and we’re seeing weak support across majors like EUR and Gold. That adds confluence for potential dollar strength.
📌 What do you think — is dollar strength just around the corner?
🔁 This analysis will be updated whenever necessary.
Disclaimer: This is not financial advice. Just my personal opinion.
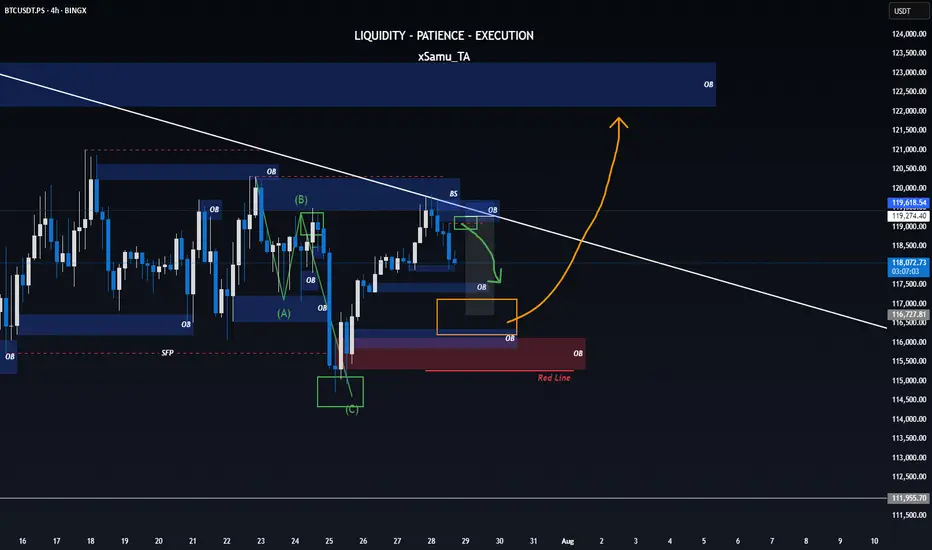
One last Correction till breakoutWith the most recent SFP printed on the higher timeframe and BTC still failing to break a significant high, all signs point toward one final dip – a move to shake weak hands and reload for the breakout that’s been brewing in silence.
⚡ If the orange level holds, consider it a highly bullish signal – supercycle potential unlocked?
Naturally, the Wizard plays both sides of the board:
📉 Short ideas would activate around the blue Order Block / green correction level.
📈 But should we bounce strong from orange… well, let’s just say you’ll want a seat for what comes next.
🟥 Bullish invalidation rests at the red line.
Let’s see how the game unfolds.
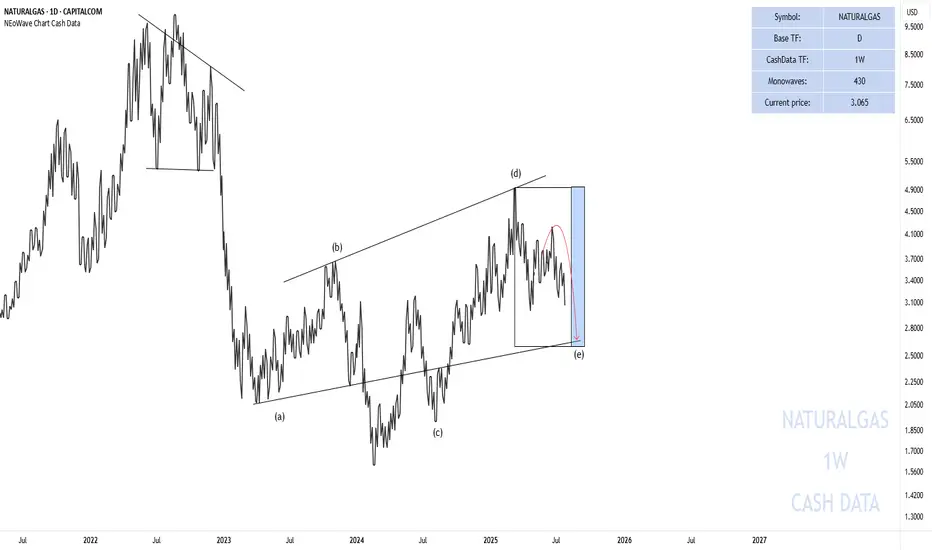
End of the Wave-(e) Natural Gas
In the previous analysis I said that:
Currently, wave-(e) is forming and I do not expect a strong upward movement until August 12-September 12 and this wave can take time until the time range I specified for it.
In the picture you can see that the price has started to decline again exactly from where we specified and has fallen by 27% so far. The price is not necessarily going to fall to 2.66 but time must pass and the price must enter the specified time range.
Good luck
NEoWave Chart
GBPUSD and The Elliott Wave TheoryThis is the continuation of a larger wave that had started earlier. Our Wave 2(Green) was a Zigzag and our Wave 4(Green), a Flat completed when Wave C(Blue) finished. When Wave 4(Green) completed, we see a 5 Wave move begin, thus Wave 5(Green). This 5 wave move is shown in Black. Wave 2(Black) was a Zigzag meaning a Flat should be expected for Wave 4(Black) - more on this later in this article. Wave 3(Black) expressed itself in a 5 wave move, shown in Red. Wave 2(Red) was a Zigzag meaning Wave 4(Red) should be a Flat. We see exactly that when Wave 3(Red) completes -- a Flat for Wave 4(Red). After Wave 4(Red), a Wave 5(Red) forms to complete the 5 wave move for Wave 3(Black) and is marked as so. Wave 2(Black) was a Zigzag and as mentioned earlier, hence Wave 4(Black) should be a Flat. Indeed, a Wave A(Green) forms for the first leg of the Flat, then a B(Green). Currently, we are on Wave C(Green) and upon completion, this would be our Wave 4(Black). After Wave B(Green) completes we see a Wave 1(Orange) form with a 2 or A forming. This has two readings for now because it could be a Zigzag or the first leg of a Flat. Stay tuned for updates.

Dollar us dxyI think the US dollar will fall sharply, causing a sharp rise in gold. There will probably be a bigger fall than in 2008 in the global economy, especially in the US.
