IONQ Short, based off patternDouble top and a break of the downward neckline trendline looking to go further to 35ish and 29 ish.
Wave Analysis
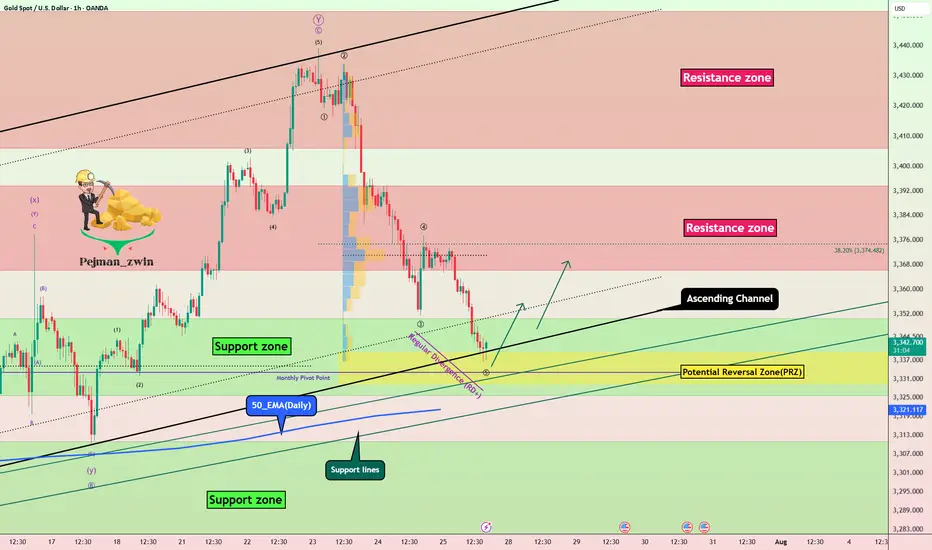
Gold Recovery Setup = Divergence + Support ClusterGold ( OANDA:XAUUSD ) fell to the lower line of the ascending channel and the Support zone($3,350-$3,326) , as I expected in my previous idea .
Gold is currently near a set of Supports .
Supports:
Support zone: $3,350-$3,326
Monthly Pivot Point: $3,333
Potential Reversal Zone(PRZ): $3,339-$3,329
Lower line of the ascending Channel
50_EMA(Daily)
Support lines
In terms of Elliott Wave theory , Gold appears to be completing a bearish wave 5 .
Also, we can see the Regular Divergence(RD+) between Consecutive Valleys .
I expect Gold to rise to at least $3,359 .
Second target: $3,367
Note: Stop Loss (SL) = $3,319
Do you think Gold can break the Support cluster by the end of trading hours?
Gold Analyze (XAUUSD), 1-hour time frame.
Be sure to follow the updated ideas.
Do not forget to put a Stop loss for your positions (For every position you want to open).
Please follow your strategy; this is just my idea, and I will gladly see your ideas in this post.
Please do not forget the ✅ ' like ' ✅ button 🙏😊 & Share it with your friends; thanks, and Trade safe.
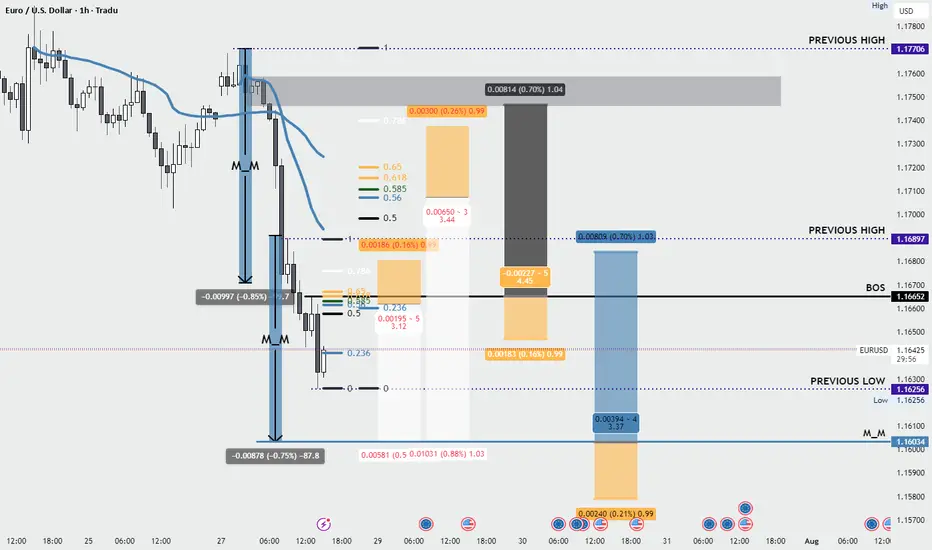
EURUSD - Monday analysis - Tarifs EUR/USD Analysis – Market Response to US–EU Tariff Agreement
Following the agreement between the United States and the European Union to implement 15% tariffs, the DXY is strengthening, which is triggering a sharp decline on EUR/USD.
I’m focusing on a potential pullback to rejoin the move or the formation of a new structure.
Given that such strong moves often lack long-term sustainability, I’ll be watching the 1.16654 level closely — looking for a possible structure break and the beginning of a corrective phase.
Trade management will be based on the evolving price action throughout the session.
🔻 In summary: Today, I'm looking for opportunities to either join the ongoing move or enter a fresh structure that sets us up for the next leg — especially with a news-heavy week ahead.
👉 Follow me for more EUR/USD trade ideas, market updates. 💼
I share structured analysis every Monday and Wednesday to help you stay aligned with the market 🗓️📊
WBD double bottom ??? WBD is nicely breaking above resistance zone i think we will see more upside in the coming weeks i will updated later with some target but for now 16 to 19 is good

XRP Bulls Returning We have seen XRP take some dips to 2.99 and reject strong. 3.00 support has been formed and we could see XRP moving to $4 this week if the higher low point is on the charts. Fundementals say that XRP banking is in a pending state, also rumor says that their Lawsuit will be dropped completely this week by SEC. Price action tells its all, we shall wait for come bullish hourly candles until we click the buy button

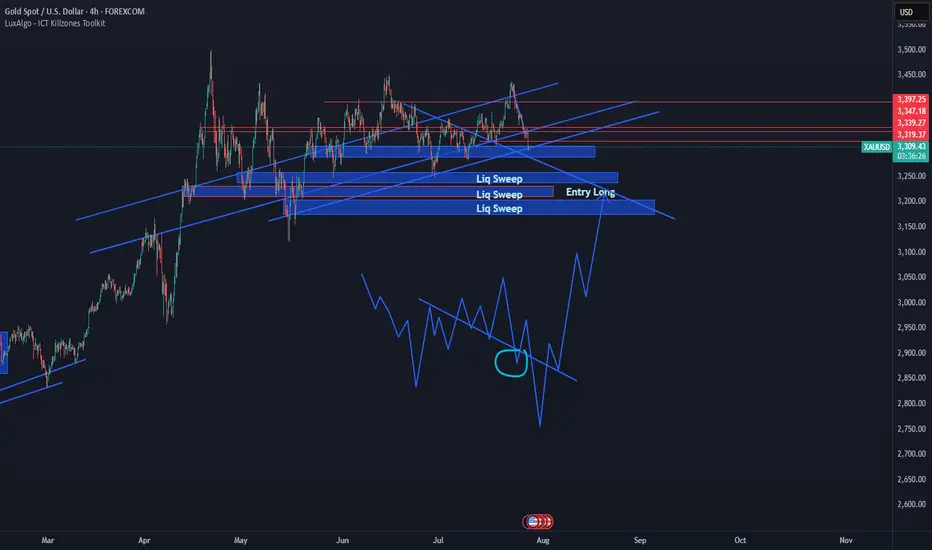
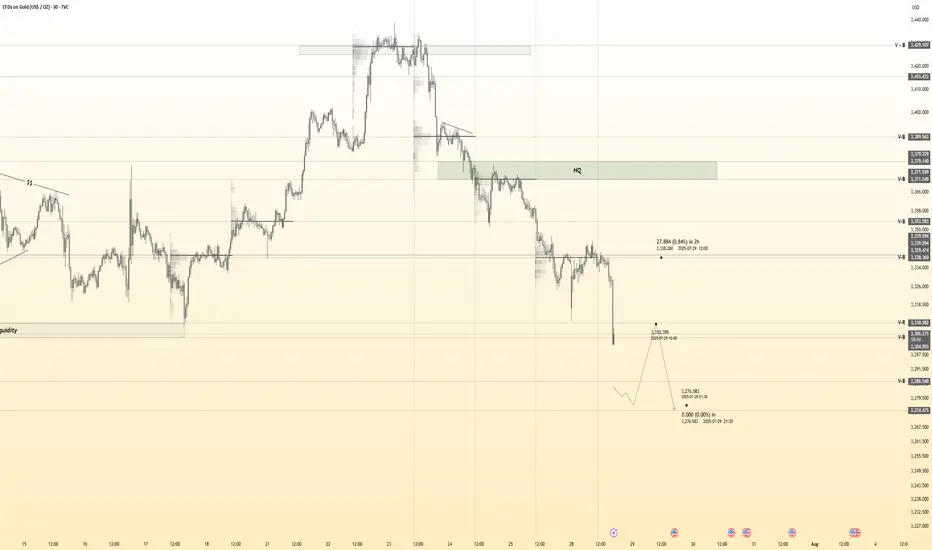
Gold (XAUUSD) - Liquidity Sweep Setup and Long Bias PlanPrice is currently respecting my projected structure and moving in line with expectations. I'm anticipating a deeper liquidity sweep into the marked demand zones below, where multiple liquidity pools are likely to be taken out. These areas have historically provided strong reactions.
🟦 Key Zones:
Three stacked liquidity sweep levels are highlighted, where previous lows and stop clusters are expected to be swept.
Watch closely for bullish reaction after liquidity grab in these zones.
🟢 Plan:
Looking for potential Entry Long after confirmation from the sweep and market structure shift.
Expecting price to accumulate, fake out with a final sweep (as sketched), and then launch upwards.
If the sweep completes and the structure confirms, targeting a strong bullish continuation move.
📈 Context:
Higher timeframe bullish structure still intact.
Setup aligns with ICT Smart Money Concepts – targeting liquidity and institutional order flow behavior.
💡 This idea will be updated as the setup develops. Trade safe and wait for confirmation.

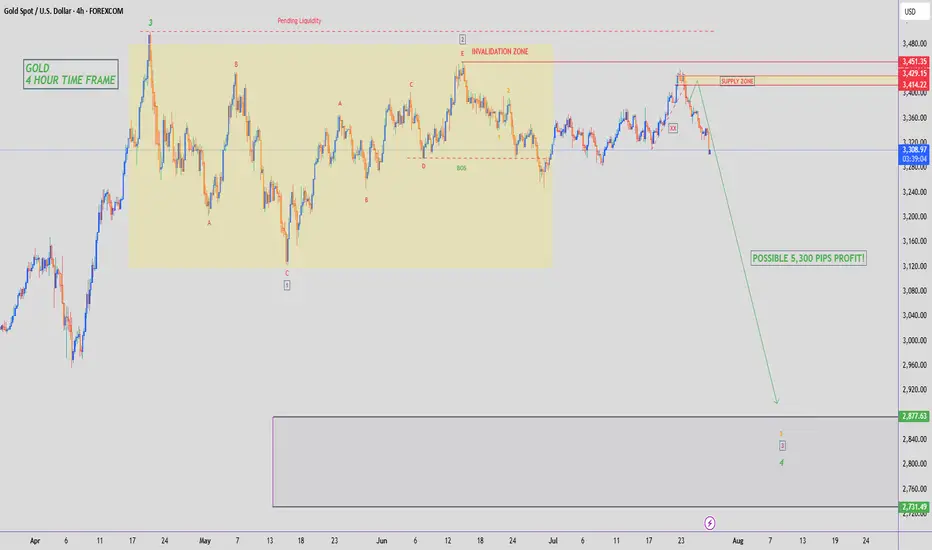
GOLD - SHORT TO $2,880 (UPDATE)Gold 'Sell Trade' running 1,130 PIPS in profit to start the week. I hope you are all taking advantage of this free analysis & profiting from Gold's downside. Amazing move to start the new week, with much more downside expected.
Drop me a message @XTBCAP for Account Management & Investment opportunities✅
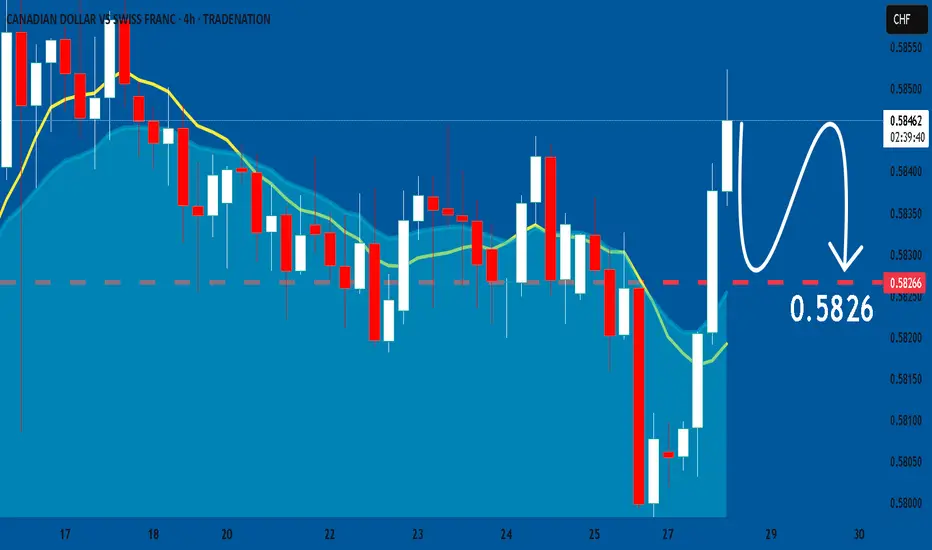
CADCHF: Market of Sellers
The recent price action on the CADCHF pair was keeping me on the fence, however, my bias is slowly but surely changing into the bearish one and I think we will see the price go down.
Disclosure: I am part of Trade Nation's Influencer program and receive a monthly fee for using their TradingView charts in my analysis.
❤️ Please, support our work with like & comment! ❤️
Elliott wavefollow abc wave structure to complete big wave A, enter 3290 area
buy limit 3290-3295, stoploss 3285, tp 3330

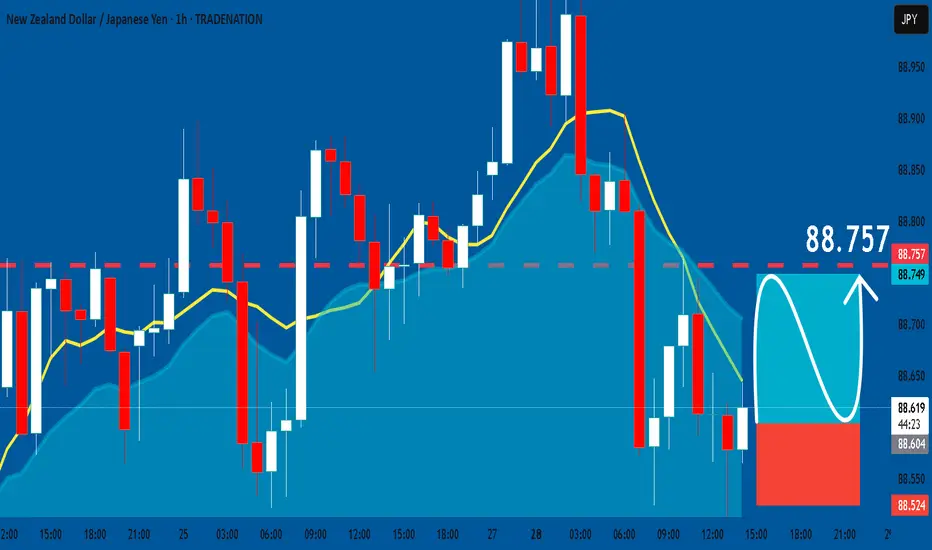
NZDJPY: Free Trading Signal
NZDJPY
- Classic bullish pattern
- Our team expects retracement
SUGGESTED TRADE:
Swing Trade
Buy NZDJPY
Entry - 88.612
Stop - 88.524
Take - 88.757
Our Risk - 1%
Start protection of your profits from lower levels
Disclosure: I am part of Trade Nation's Influencer program and receive a monthly fee for using their TradingView charts in my analysis.
❤️ Please, support our work with like & comment! ❤️
Gold 30Min Engaged ( Bearish Break Out Entry Detected )Time Frame: 30-Minute Warfare
Entry Protocol: Only after volume-verified breakout
🩸Bearish From now price - 3306
➗ Hanzo Protocol: Volume-Tiered Entry Authority
➕ Zone Activated: Dynamic market pressure detected.
The level isn’t just price — it’s a memory of where they moved size.
Volume is rising beneath the surface — not noise, but preparation.
🔥 Tactical Note:
We wait for the energy signature — when volume betrays intention.
The trap gets set. The weak follow. We execute.
ETHEREUM Long Outlook – Grand Supercycle Perspective(2025.05.21)Hello everyone,
This is SeoVereign, operator of the SeoVereign Team.
Today, I would like to share an Ethereum analysis based on the daily (1D) chart for the first time in a while.
Before reading this post, please refer to the idea I uploaded on April 18, 2025, through the link below. It will help you better understand the context:
🔗
(Clicking the image will take you to the corresponding link.)
If you look at the April 18 idea, you’ll see that I presented a bullish outlook based on the Deep Crab pattern.
This analysis is a continuation of that idea.
Through years of research, I’ve observed that when a Deep Crab pattern sees a rebound from the PRZ (Potential Reversal Zone), the trend that begins from that point tends to extend for a long time.
If you look closely at the chart, you’ll also see the 2.24 Fibonacci extension level.
Some people messaged me saying, “Since it went above 1.902 and even exceeded the 2.0 Fibonacci line, isn’t this Deep Crab invalid?”
However, I’ve studied harmonic patterns in depth for a long time and have set my own Fibonacci criteria based on that research.
In this particular Deep Crab case, I define the invalidation level as 2.24.
Therefore, I judged that the pattern is still valid, and this allowed me to forecast a long-term bullish trend.
Back to the main point,
Based on this Deep Crab pattern, I’ve consistently maintained a bullish outlook on the daily chart,
and so far, there have been no clear signals indicating a reversal into a bearish trend.
Thus, I would like to post a continuation of the bullish outlook on the daily chart.
On May 19, 2025, there was a sharp drop around the 2,587 USDT level.
At that time, our team expected the bullish trend that started from around 2,447 USDT to hold its low and continue.
However, the price broke below 2,447 USDT and made a new low.
We then closely monitored Bitcoin’s movement in response.
Typically, strong volatility occurs before a major trend begins.
Bitcoin was also showing significant volatility at the time.
So we concluded: “Let’s maintain a bullish stance, but do not be fully convinced until the previous high of 2,587 USDT is clearly broken upward.”
And by the time this post is published, we’ve confirmed that the price has indeed broken above 2,587 USDT.
Therefore, I have come to the conclusion that the bullish trend is still valid.
Based on this, I present the following three target levels.
🎯 SeoVereign’s Ethereum Bullish Targets
1st Target: 3,000 USDT
2nd Target: 3,400 USDT
3rd Target: 3,700 USDT
The market still shows strong volatility.
I sincerely hope you all trade wisely and calmly, achieving great returns,
and may great fortune be with you both in trading and in life.
I’ll see you again in the next daily analysis.
Thank you.
- SeoVereign

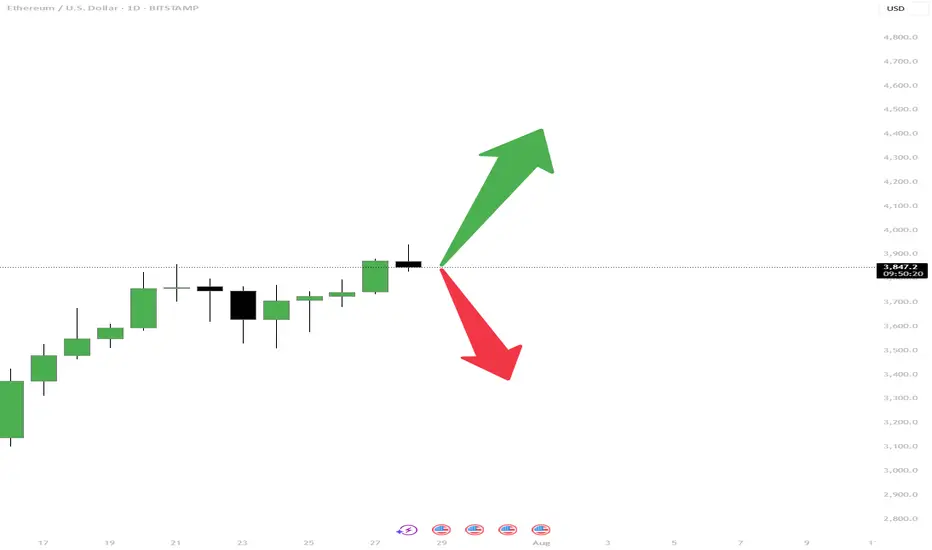
ETH is at a turning point — What would you do?Hey traders, how's everything going with you?!
The price has been increasing for days, but now it’s slowing down. From here, ETH can either:
🟢 Go higher and continue the uptrend
🔴 Or drop and start a pullback
This is a key moment. Some traders are preparing to buy the breakout, others are waiting to sell the drop, and some are watching for more clues.
👉 If this were your chart, would you do:
Buy?
Sell?
Wait?
Comment below and let’s learn from each other 👇. I would also appreciate it if you could hit the boost and follow!
Have a great day, everyone!
-Neo
EURJPY Sellers In Panic! BUY!
My dear friends,
Please, find my technical outlook for EURJPY below:
The price is coiling around a solid key level - 172.51
Bias - Bullish
Technical Indicators: Pivot Points Low anticipates a potential price reversal.
Super trend shows a clear buy, giving a perfect indicators' convergence.
Goal - 173.00
Safe Stop Loss - 172.29
About Used Indicators:
The pivot point itself is simply the average of the high, low and closing prices from the previous trading day.
Disclosure: I am part of Trade Nation's Influencer program and receive a monthly fee for using their TradingView charts in my analysis.
———————————
WISH YOU ALL LUCK


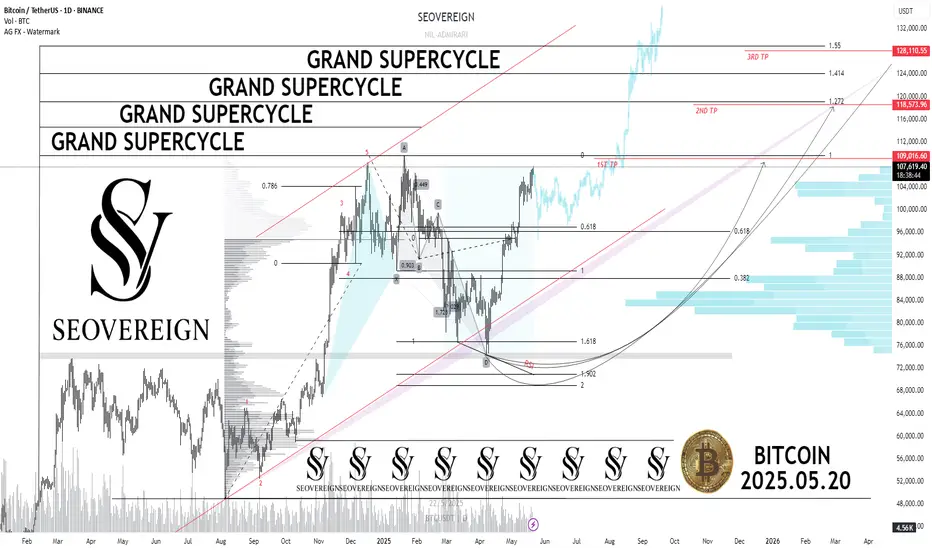
BTC Long Outlook – Grand Supercycle Perspective (2025.05.21)Hello everyone,
This is SeoVereign, the operator of the SeoVereign team.
It's been nearly a month since I returned to TradingView and started posting ideas again.
During that time, I’ve frequently shared short-term ideas based on minute charts.
However, since real-time responses are crucial in short timeframes,
there are practical limitations in explaining all the reasoning behind our analysis in detail each time.
But when it comes to larger timeframes like the daily chart,
we have a bit more flexibility.
So I see this as a valuable opportunity to explain our thought process and key reasoning more thoroughly.
Now, let’s get into the Bitcoin daily chart briefing.
Please refer to the following link first.
This is a post I made on April 18, 2025:
🔗
At the time, I shared the view that the upward wave starting near 75K
had the potential to extend to 88K and even 96K.
However, it was difficult to determine exactly how far the wave would extend at that point.
Now, I want to make one thing very clear.
If someone uses wave theory to say something like
"Bitcoin will definitely go to X price,"
that person is either a scammer or someone who fundamentally misunderstands wave theory.
Elliott Wave Theory can be somewhat useful in anticipating short-term moves,
but it has clear limitations when applied to long-term predictions.
After many years of studying Elliott Wave Theory in depth,
I've come to a simple but important conclusion:
"You cannot predict the distant future with technical analysis alone."
That said, there is one exception:
very short-term movements — the immediate price action right in front of us —
can often be approached with some confidence using technical analysis.
Here’s an example.
If someone bought Bitcoin at 10K and says,
“I’m going to sell at 100K,”
while it hasn’t even broken past 50K,
that’s just reckless optimism.
But if Bitcoin has already approached 100K,
and several bearish signals are starting to emerge and become confirmed,
that’s when we can begin considering short positions.
The key is to make decisions based on the data right now — not based on hopes or assumptions.
That was a long introduction.
Now, let me explain why I believe Bitcoin could break to new all-time highs
and possibly reach as high as 130K.
As I mentioned in the April 18 post,
I believe an Ending Diagonal was completed around the 74K region,
and I anticipated an upward impulse wave to follow.
In my view, the current market structure clearly suggests we are in an uptrend.
Many of you have reached out via private messages asking,
“What kind of wave are we in right now?”
But in this case, that question doesn’t hold much value.
Whether this current move is part of an impulse wave or a corrective structure,
what matters is that the price is going up.
If, for instance, the A-wave has completed — as confirmed by Fibonacci —
then the B-wave would follow, and we can plan accordingly with long positions.
Or, if the ABC correction is already over,
then a new impulse wave could be starting.
Either way, the key takeaway is that we’re likely in an upward phase.
Back to the main point:
A Deep Crab harmonic pattern formed near 74K,
and that zone concluded with an Ending Diagonal,
which is now leading to a bullish reversal.
I've studied harmonic patterns for years,
and in the case of the Deep Crab,
the upper boundary of the Potential Reversal Zone (PRZ)
is typically around the 2.24 Fibonacci extension.
As long as this level is not broken,
the pattern remains valid.
And when a reversal happens near the 1.618 or 1.902 zones,
it’s often a highly reliable bullish signal.
So, what are our targets in this current rally?
🎯 SeoVereign’s Target Strategy
1st Target: 109,000
2nd Target: 118,600
3rd Target: 128,100
Right now, before the market enters a full-scale bullish breakout,
we’re seeing unusually high volatility.
In times like this, staying calm and grounded is more important than ever.
I sincerely wish all of you the best of luck in navigating this volatility,
and may a wave of growth come to your accounts as well.
🍀 I genuinely hope great fortune finds its way to all of you.
See you in the next daily briefing.
Thank you.
— SeoVereign
GOLD REVERSALHello folks, most traders stop out on this idea right? lets get back to previous month opening price, for short idea stoploss above. 3440.
But If you can wait for LONG below. maybe in the next 2 days.
Goodluck. I prefer LONG? I will update once I see volumes on downtrend today or the next day.
I only see short today. the volume is declining/exhausted. I predict reversal atm.
ciao.. see the chart above.
this is not a financial advice.
trade it like its your own business.

TOTAL3 1D – Altcoins Market Cap (Excl. BTC & ETH)Daily chart of total market cap excluding BTC and ETH. Useful to measure trend strength of mid- and low-cap altcoins.

TOTAL2 1D – Altcoin Market CapAltcoin market cap excluding BTC. Used to measure overall altcoin trend and volume strength.

USDT Dominance 1D – Risk AppetiteDaily chart of USDT dominance. Helps detect if capital is entering or exiting the crypto market (risk on/off).

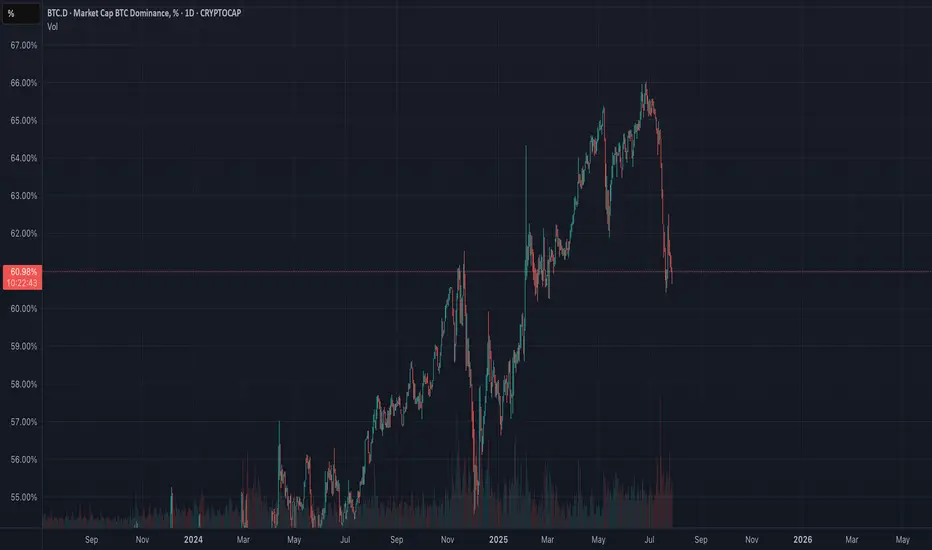
BTC Dominance 1D – Market LeadershipBTC dominance daily chart to assess whether BTC is leading the market or capital is flowing into altcoins.
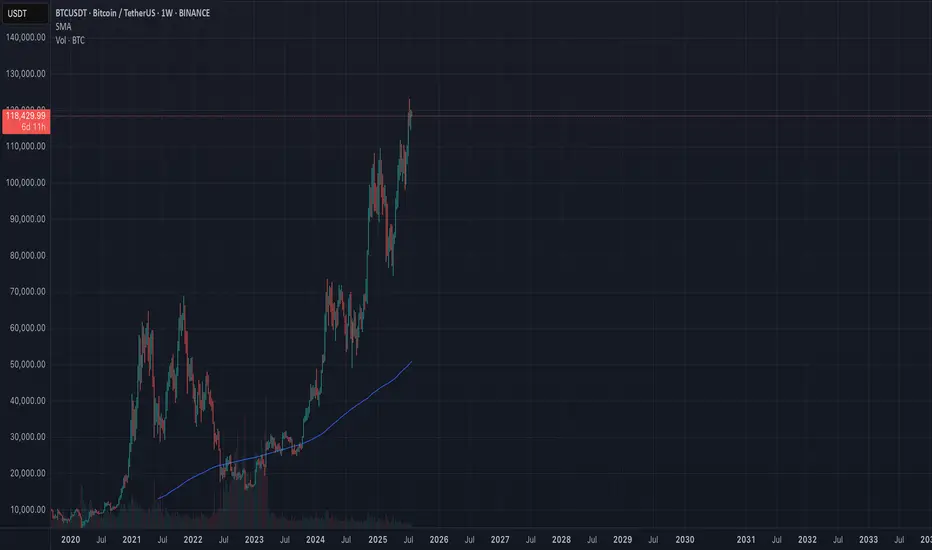
BTC 1W – Macro Trend with MA200Weekly chart of BTCUSDT showing long-term macro trend. MA200 helps identify bull vs bear market phases.