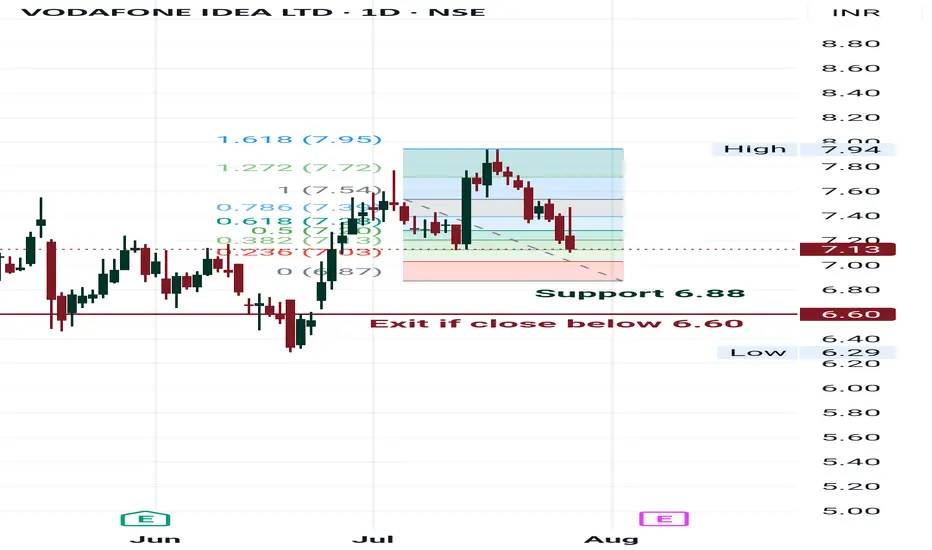
Idea buy at support Idea buy 6.88 , opposition calculation Fibonacci point.
Try to exit below 6.60 on close basis.
Wave Analysis
EURUSD at Make-or-Break Zone: Time to Short?EURUSD – Key Data Out Today, Short Setup Confirmed?
Today, several important economic indexes were released for both the Euro(EUR) and the Dollar(USD) . Let’s break them down in a simple way:
Eurozone PMI Data: Mixed to Weak
France:
Manufacturing PMI: 48.4 (slightly lower than forecast)
Services PMI : 49.7 (flat, but below 50 = contraction)
Germany:
Manufacturing PMI: 49.2 (weaker than expected)
Services PMI : 50.1(slightly expansionary)
Eurozone Overall:
Manufacturing PMI: 49.8 (still below 50)
Services PMI : 51.2 (slightly stronger than forecast)
ECB left the Main Refinancing Rate unchanged at 2.15% , which was widely expected.
U.S. Data( TVC:DXY ): Strong and Surprising
Unemployment Claims: 217K (better than expected 227K)
Manufacturing PMI: 49.5 (below forecast of 52.7 – a negative surprise)
Services PMI: 55.2 (well above forecast and previous – bullish for USD)
Interpretation :
The Eurozone's growth remains sluggish, especially in France and Germany.
Despite a drop in U.S. manufacturing, the services sector remains strong, and unemployment data confirms labor market resilience.
This mixed picture slightly tilts the balance in favor of the U.S. dollar, especially as the ECB remains on hold while the Fed may still consider being restrictive.
Bias: Short EURUSD ( FX:EURUSD )
Fundamentals support a Short position in EURUSD, in line with the current technical setup.
---------------------------------
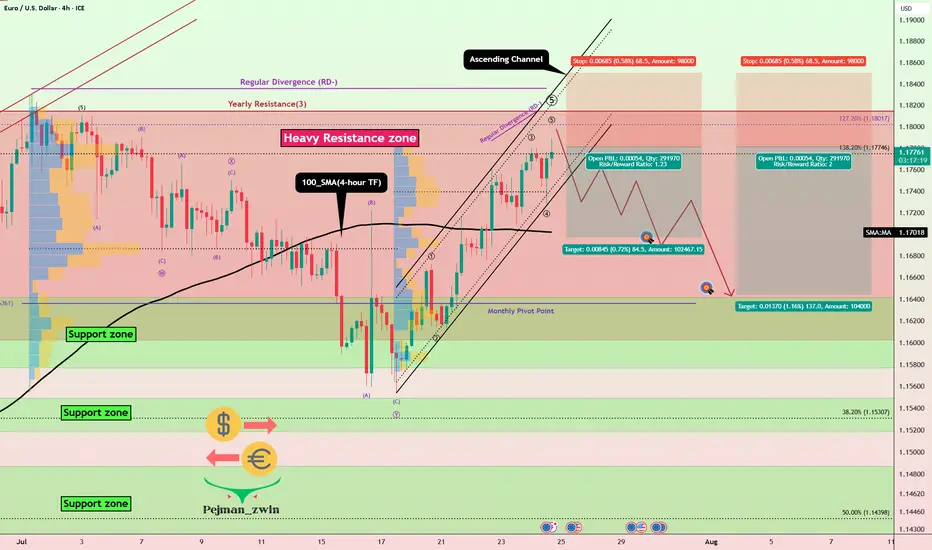
Now let's take a look at the EURUSD chart on the 4-hour time frame to find the best Short position .
EURUSD is currently trading in an Ascending Channel and at a Heavy Resistance zone($1.1845-$1.1602) .
Also, in terms of Elliott wave theory , it seems that EURUSD is completing a microwave 5 of the main wave 5 .
One of the most important supports ahead for EURUSD could be the 100_SMA(4-hour TF) .
If the currently 4-hour candlestick forms a Shooting Star Candlestick Pattern , it is a better sign for EURUSD to fall .
Also, we can see the Regular Divergence(RD-) between Consecutive Peaks .
I expect EURUSD to decline to at least $1.169 AFTER breaking the lower line of the ascending channel .
Second Target: Support zone($1.1642-$1.158) and Monthly Pivot Point.
Note: Stop Loss(SL)= $1.1850
Please respect each other's ideas and express them politely if you agree or disagree.
Euro/U.S. Dollar Analyze (EURUSD), 4-hour time frame.
Be sure to follow the updated ideas.
Do not forget to put a Stop loss for your positions (For every position you want to open).
Please follow your strategy and updates; this is just my Idea, and I will gladly see your ideas in this post.
Please do not forget the ✅' like '✅ button 🙏😊 & Share it with your friends; thanks, and Trade safe.
XAUUSD: Market Analysis and Strategy for July 28Gold technical analysis:
Daily chart resistance level 3375, support 3310
4-hour chart resistance level 3350, support 3320
1-hour chart resistance level 3345, support 3325.
Gold, after hitting the 3438 area last week, saw a sharp adjustment, falling to around 3323, a drop of about $120, and there is no sign of stopping the decline in the short term. The next step may be to test the previous starting point of 3310. If it holds here, it is expected to bottom out and rise. If it falls below this position, the market will increase its selling behavior, and the short-selling target will be near the daily Bollinger lower rail 3285.
For the intraday market, the important position below is around 3310. Today's Asian market opened at around 3323, and then quickly rose. As of now, the highest reached 3345, and it still did not break through the high point of the US rebound on Friday near 3347. In the day, you can rely on today's low point near 3323 to be bullish, pay attention to the resistance of 3347/51. If the gold price is difficult to break through, you can consider selling. If the rebound breaks through the 3347~3351 area, the short-term will turn bullish.
BUY: 3325near
BUY: 3310near
SELL: 3345near

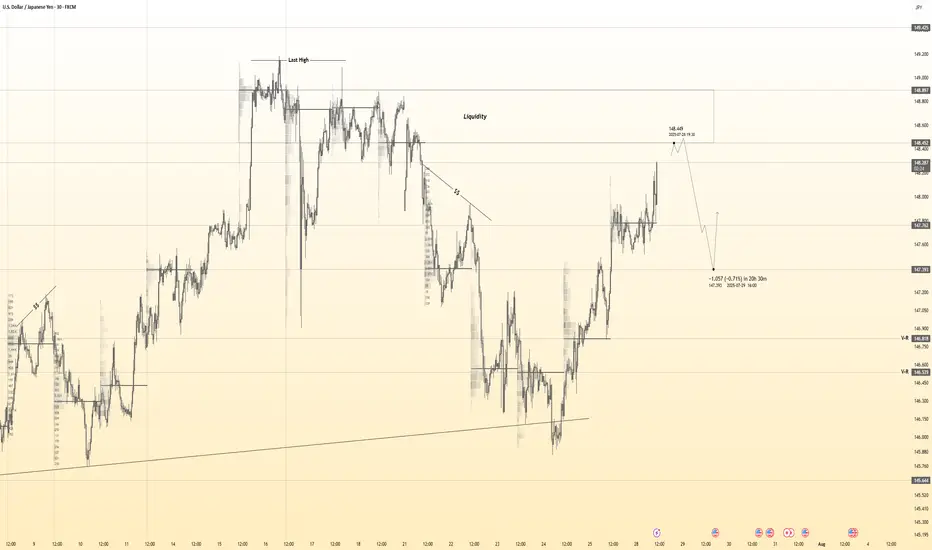
USDJPY 30Min Engaged ( Bearish Reversal Entry Detected )Time Frame: 30-Minute Warfare
Entry Protocol: Only after volume-verified breakout
🩸Bearish Retest - 148.450
➗ Hanzo Protocol: Volume-Tiered Entry Authority
➕ Zone Activated: Dynamic market pressure detected.
The level isn’t just price — it’s a memory of where they moved size.
Volume is rising beneath the surface — not noise, but preparation.
🔥 Tactical Note:
We wait for the energy signature — when volume betrays intention.
The trap gets set. The weak follow. We execute.
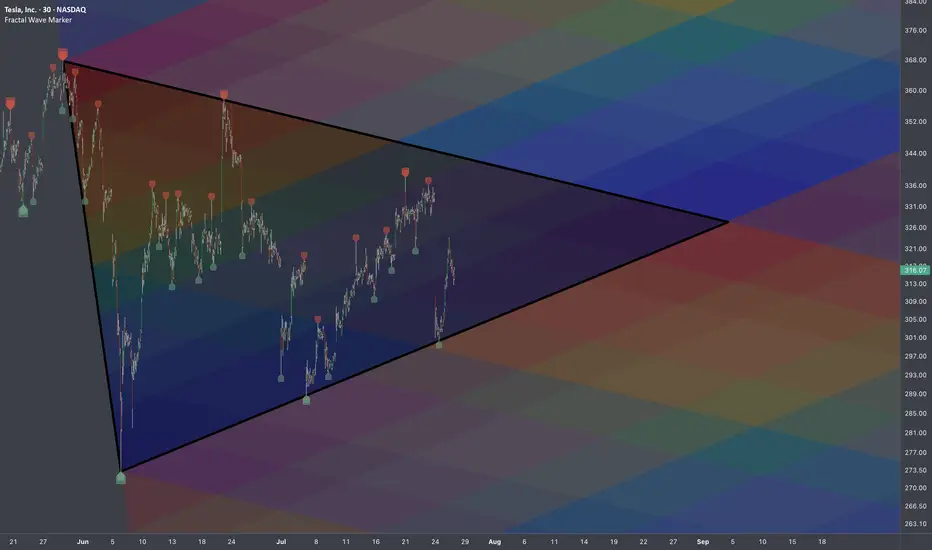
$TSLA: Breakout Wave Dimensions🏛️ Research Notes
Apart from known compression patterns for Tesla, there is another squeeze happening on smaller scale:
That area will be processed to derive the chart-based levels and see how market reacts to them.
Triangle
Breakout Expansion
BITCOIN PREDICTION: HUGE BREAKOUT SOON!! (watch this level) Yello Paradisers! I'm sharing with you multi-timeframe analysis on Bitcoin, levels to watch out for, confirmations we are waiting for, and everything needed for successful professional trading that is being profitable in the long run.
I'm sharing with you zig-zag from the Elliot Wave pattern formation. I'm also sharing a possible impulse we are going through, a head and shoulders pattern and its target, and the next major resistance and support levels.
I'm sharing with you a contracting triangle setup and how to trade it, along with an ending diagonal setup and how to trade it. Watch out for confirmations and how the price is developing based on what I have been talking about in this video, then trade it as a professional trader should.
Make sure that you have a great risk management, trading strategy, and tactic for entering the trades. I have explained some tactics that I'm watching for in this video, but make sure that all these tactics are well within your larger trading strategy and that you're approaching the market professionally. Don't try to get rich quick.
Make sure that you are focusing on long-term profitability and survival. This is the only way you can make it in crypto trading!

US30 Weekly Forecast – Bullish Bounce or Breakdown?Hope everyone had a great weekend!
This chart outlines a critical US30 intraday structure with price currently pulling back into a key confluence zone composed of:
A rising trendline from July 23rd
Two stacked demand zones, the upper around 44,850 and lower near 44,700
Bullish Scenario (Preferred Bias):
If price respects the trendline and upper key zone, we may see a bullish continuation targeting the 45,150–45,250 range.
The clean bounce zone, marked by the green arrow, suggests smart money might defend this level.
Watch for bullish engulfing or low-volume traps near 44,850–44,880 to confirm entry.
Bearish Scenario (Alternate Play):
If price fails to hold the trendline, and breaks below the 44,850 key zone with momentum, expect a drop into the lower zone (44,650–44,700).
A breakdown below this lower demand could shift the bias entirely, opening the door for a deeper correction back into the mid-44,000s.
Weekly Playbook:
Early week: Monitor the reaction at the upper key zone for sniper long opportunities with tight stops.
Mid to late week: If structure fails, flip bias and look for supply rejections on retests for shorts.
Risk: Account for FOMC/major U.S. news events that may introduce volatility traps around these zones.
Verdict: Stay patient. Let price dictate bias at the trendline. If it holds, this could be a textbook bounce continuation setup.

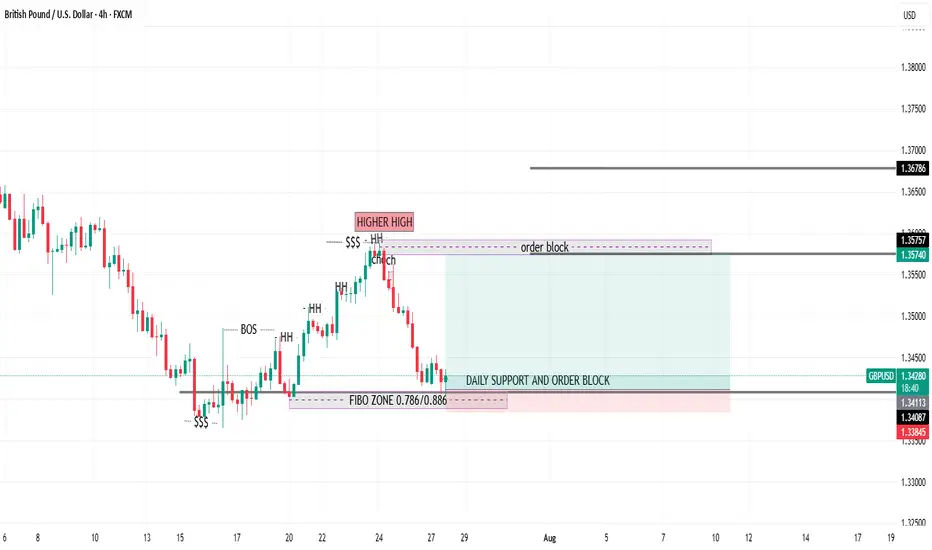
GBPUSD BUY with money mangemnt Analyzing market structure and liquidity using Price Action and Smart Money Concepts. Focuse
done on key supply/demand zones and institutional order flow
From Hype to Hesitation: What’s Next for Pump Fun ($PUMP)?Today, I want to break down the recent developments and fundamentals of Pump fun ( BYBIT:PUMPUSDT ) and its token PUMP — a project that initially launched with strong hype but is now facing serious investor concerns .
What is Pump fun?
Pump fun is a memecoin launchpad that allows users to launch and trade memecoins in a gamified, simplified environment. The idea was to create a frictionless way for anyone to generate and speculate on meme tokens, leveraging viral growth and community culture.
Its native token, PUMP , was introduced via an ICO priced at $0.004, with 12.5% of the total 1 trillion supply offered during the sale.
Latest Updates – Past 24 Hours Recap
PUMP Crashes Over 50% After ICO :
The token initially spiked to $0.0068 on launch day (July 16) , but has now dropped over 50%.
This is roughly 14% below its ICO price , creating concerns for short-term investors.
Founder Confirms No Airdrop Anytime Soon:
In a livestream with ThreadGuy , project founder Alon Cohen confirmed:
“ The airdrop is not going to be taking place in the immediate future. ”
While the team still plans to deliver an airdrop, Alon emphasized it must be well-executed and meaningful, not rushed for hype.
The current focus is on long-term growth and ecosystem sustainability, not short-term incentives.
Mixed Investor Sentiment:
High-profile trader Machi Big Brother ( Jeffrey Huang ) reportedly increased his long position in PUMP — even though he’s down over $5.8M on his position.
Meanwhile, two wallets linked to private sale investors dumped over 1.2B PUMP at $0.003 , taking a combined loss of $1.19M.
Declining Volume and Market Cap:
Trading volume has dropped significantly.
PUMP has lost over 40% of its value in the past 7 days.
Short-term holders appear uncertain, while the project team asks for patience and long-term vision.
Fundamental Outlook:
Pump fun’s future now heavily depends on:
The real utility of the platform as a meme coin incubator.
The team’s ability to regain trust after delaying the airdrop.
Whether new features or hype can revive volume and user engagement.
-------------------------------
Now, let's examine the PUMP token from a technical analysis perspective
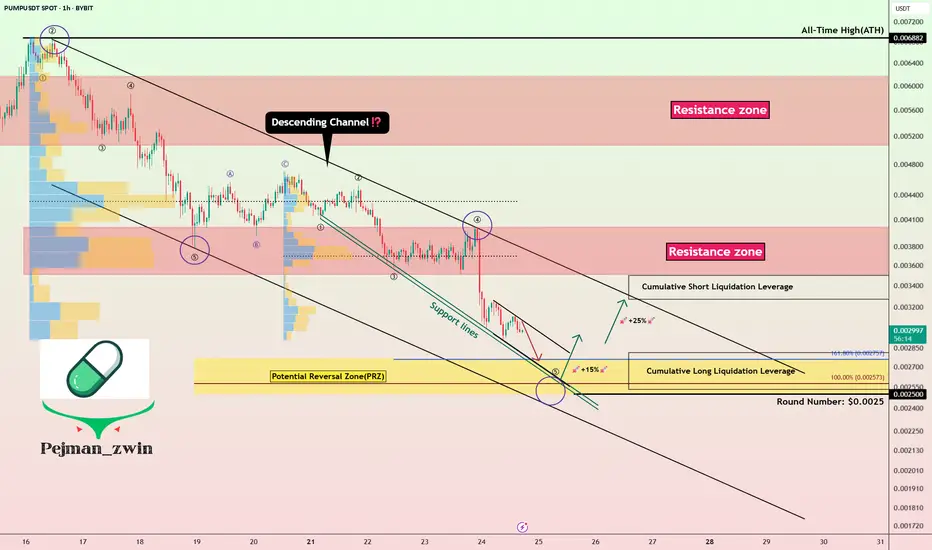
From the outset, I must say that due to the small number of candlesticks that create the PUMP token, technical analysis may be a bit difficult , but we will use technical analysis tools to analyze this token.
The PUMP token seems to be moving in a descending channel since the beginning of its correction (over -50%) until now, we need a second price bottom to confirm the descending channel.
I expect the PUMP token to rise from the Potential Reversal Zone(PRZ) and near the Support lines to $0.0029(+15%) . PUMP Token increase can also be from the bottom of the ascending channel .
Second target: the upper line of the ascending channel.
Cumulative Long Liquidation Leverage: $0.002810-$0.002530
Cumulative Short Liquidation Leverage: $0.003498-$0.00327
Note: Stop Loss(SL): $0.002391
Please respect each other's ideas and express them politely if you agree or disagree.
Pump fun Analyze (PUMPUSDT), 1-hour time frame.
Be sure to follow the updated ideas.
Do not forget to put a Stop loss for your positions (For every position you want to open).
Please follow your strategy and updates; this is just my Idea, and I will gladly see your ideas in this post.
Please do not forget the ✅' like '✅ button 🙏😊 & Share it with your friends; thanks, and Trade safe.
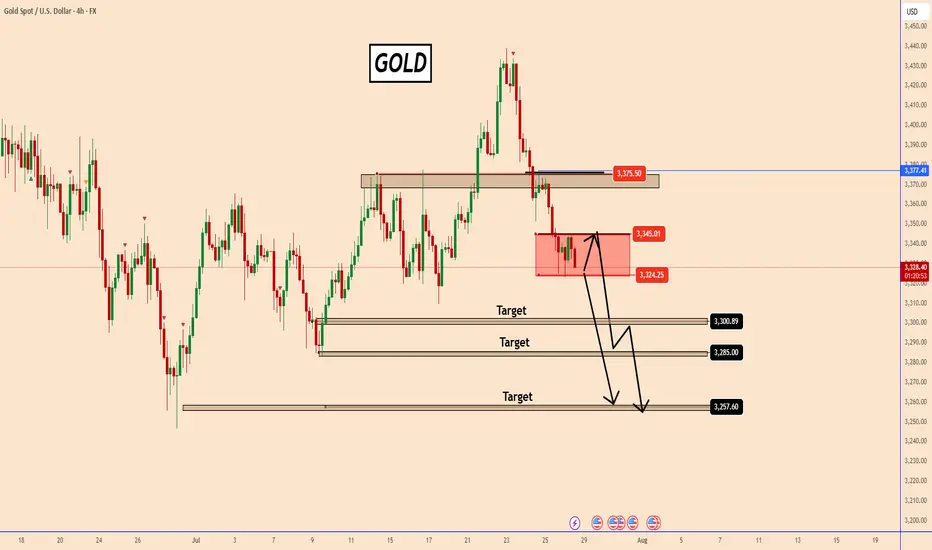
Gold : Holding Ground Below 3345 Amid USD SurgeGold : Holding Ground Below 3345 Amid USD Surge
Gold's upward potential from Friday appears limited by the 3345 level—a narrow but firm resistance zone. As long as price fails to break above it, this zone has a high importance.
If gold holds below 3345, the probability of further downside increases significantly.
Meanwhile, the recent US–EU agreement has strengthened the USD. While this isn’t expected to severely impact gold, short-term fluctuations can’t be ruled out.
If price stabilizes in the red zone, it may consolidate ahead of the upcoming FOMC meeting. In such cases, volatility could erupt based on news-driven catalysts—so be prepared for unexpected moves.
You may find more details in the chart!
Thank you and Good Luck!
PS: Please support with a like or comment if you find this analysis useful for your trading day
Bitcoin Correction Maturing – Long Setup Brewing!Bitcoin ( BINANCE:BTCUSDT ) has fallen by more than -4% over the past day.
Let's take a look at the reasons for the decline.
One of the key reasons behind Bitcoin’s decline in the past 24 hours ( July 25 ) could be the reduced likelihood of Jerome Powell being replaced as Chair of the Federal Reserve.
In recent days, market participants were speculating that Donald Trump might replace Powell — a scenario that was considered bullish for risk assets like Bitcoin. However, recent reports of a meeting between Trump and Powell, and signs that Powell might not be dismissed, have weakened this fundamental narrative.
This meeting may signal a truce or reduced tension between Trump’s team and Powell , which could imply a continuation of current Fed policies. That’s bad news for Bitcoin, as it removes a potential psychological tailwind from the market and dampens speculative sentiment.
As a result:
Over $500 million in liquidations(Long Positions) occurred
Weak inflows into Bitcoin ETFs
A stronger U.S. Dollar Index ( TVC:DXY )
And declining Gold( OANDA:XAUUSD ) prices over the past two days
all added additional selling pressure on BTC. Now let's take a look at Bitcoin's conditions on the 4-hour time frame .
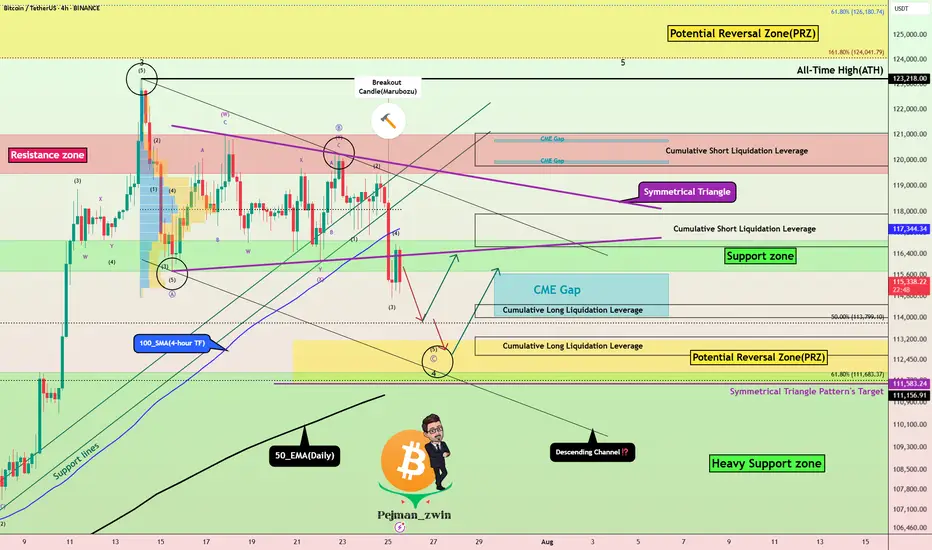
Bitcoin currently appears to have broken the Support zone($116,900-$115,730) , Support lines , 100_SMA(4-hour TF) , and the lower line of the Symmetrical Triangle Pattern with a bearish Marubozu candle .
Note : In general, trading was difficult when Bitcoin was inside a symmetrical triangle (about 10 days).
It also seems that the pullback to these zones has ended and Bitcoin is waiting for the next decline .
In terms of Elliott Wave theory , Bitcoin appears to be completing microwave 5 of microwave C of major wave 4 . There is a possibility that main wave 4 will create a descending channel and complete at the bottom of the descending channel (at Potential Reversal Zone(PRZ) ).
I expect Bitcoin to start rising again after completing the CME Gap($115,060-$114,947) from Cumulative Long Liquidation Leverage($114,480-$114,000) or Cumulative Long Liquidation Leverage($113,284-$112,603) near the PRZ and Heavy Support zone($111,980-$105,820) .
Cumulative Short Liquidation Leverage: $117,904-$116,665
Cumulative Short Liquidation Leverage: $121,046-$119,761
Do you think Bitcoin has entered a major correction, or does it still have a chance to create a new ATH?
Please respect each other's ideas and express them politely if you agree or disagree.
Bitcoin Analyze (BTCUSDT), 4-hour time frame.
Be sure to follow the updated ideas.
Do not forget to put a Stop loss for your positions (For every position you want to open).
Please follow your strategy and updates; this is just my Idea, and I will gladly see your ideas in this post.
Please do not forget the ✅' like '✅ button 🙏😊 & Share it with your friends; thanks, and Trade safe.
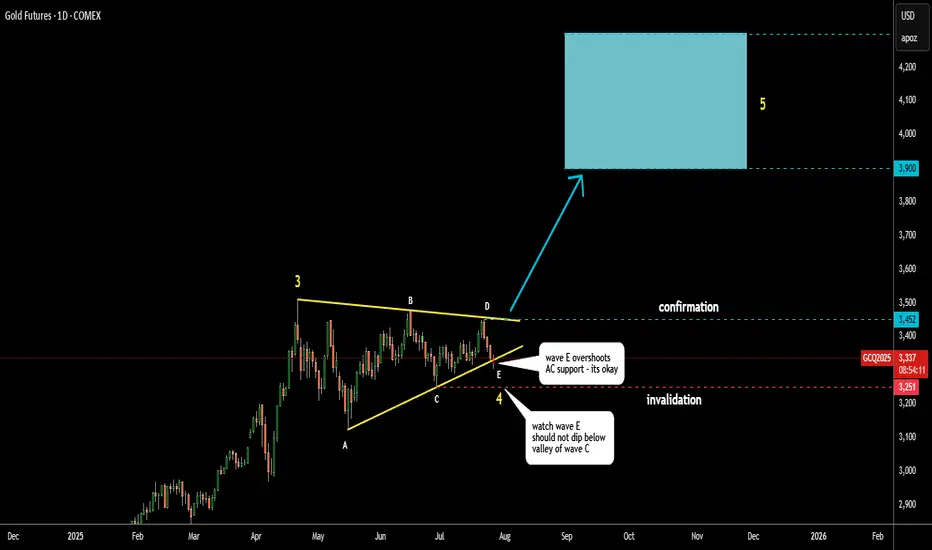
Gold Update 28 JULY 2025: On The EdgeGold is accurately following the path shown in my earlier post.
Wave D respects the triangle rules, staying below the top of wave B.
Wave E appears nearly complete, even piercing the A–C support line.
This is acceptable as long as wave E stays above the wave C low at $3,251.
Keep a close eye on this invalidation point.
The target range remains unchanged: $3,900–$4,300.
Analysis on the DXY – EURUSD RelationshipHello traders,
Here’s an analysis that can be useful for both short-term and swing trades on EURUSD and DXY. Our trading team’s calculations are as follows:
Analysis on the DXY – EURUSD Relationship
Currently, DXY is at 98.200. Historical statistical data indicate that if DXY declines toward 96.300, there is approximately a **1.55% probability of an upward move** in EURUSD.
Based on this scenario:
Current EURUSD level: 1.16500
Projected target level:1.1830
While the correlation data show a strong inverse relationship, it’s important to note that periodic deviations can occur in the market. Therefore, this analysis should be considered a statistical projection only, not a guaranteed outcome.

Strategic Multi-Swing Analysis – Pivots and Post-FOMC Outlook__________________________________________________________________________________
Technical Overview – Summary Points
➤ Sustained bullish momentum on BTCUSDT across all swing timeframes.
➤ Key supports: 116400–117400 (likely rebound), major supports: 105047–114674.
➤ Main resistances: 119000–120000 (short term), major ceiling at 123240 (1D/12H).
➤ Risk On / Risk Off Indicator: "Strong Buy" signal – tech sector leadership confirmed.
➤ Volumes normal to moderately elevated, no excess or behavioral anomaly (ISPD "Neutral").
➤ No euphoria or capitulation flags; general wait-and-see attitude, FOMC event ahead.
__________________________________________________________________________________
Strategic Summary
➤ Strategic bullish bias remains as long as 116400/117400 supports hold.
➤ Opportunity window: buy pullbacks towards 117400–116400 with tight stops; clear invalidation below 115900.
➤ Risks: FOMC-induced volatility, increased leverage on alts, potential capitulation if key support breaks.
➤ Catalysts: FOMC communication, geopolitical context (no immediate threat), background risk-off climate not yet triggered.
➤ Action plan: Prioritize post-event reaction over anticipation; maintain strict technical protection.
__________________________________________________________________________________
Multi-Timeframe Analysis
1D: Uptrend confirmed. Price above all major supports. Strong resistance at 123240, key support at 105047, normal volumes, Risk On / Risk Off Indicator "Strong Buy", ISPD "Neutral".
12H: Bullish bias. Resistance cluster 120002–123240. Intermediate supports 114674/111949. Momentum/volume supported, no excesses.
6H: Bullish near range top, supports at 114674/111949, ceiling at 120002–123240. Solid Risk On / Risk Off Indicator.
4H–2H: Up momentum, resistance 119003–120002–123240, supports 116474/117800. Moderate/normal volumes.
1H: Strong uptrend, thick resistance at 119000–120000, immediate supports 117800/116474. Slight volume uptick ahead of FOMC.
30min–15min: Resistance 119003–120000 (~H4 pivot). Intraday support 117400–117800/118200. Both Risk On / Risk Off Indicator and ISPD neutral, normal volumes, bullish as long as 116474 holds.
SYNTHESIS: Broad bullish confluence on MTFTI from 1H to 1D/W.
Supports at 116474/117400 are key pivots for maintaining bullish swing view.
No behavioral alerts or extreme volumes.
Consolidation/waiting likely before FOMC release – monitor reactions at pivot zones.
__________________________________________________________________________________
Strategic decision & macro
Opportunities: Swing bullish scenario favored as long as key supports hold, buy strategic pullbacks, reverse on clear break.
Main risk: FOMC volatility, altcoin excesses, possible post-announcement fake moves. Active monitoring essential.
Macro/on-chain: No excess, BTC realized cap > $1T; aggressive rotation into alts, high open interest. No capitulation. Major on-chain & technical support aligned at 114500–118000.
Action plan: Favor reactivity (post-FOMC), tight stops, progressive take profits at 119500–123240 resistance. No aggressive pre-positioning.
__________________________________________________________________________________
Macro catalysts overview
FOMC expected: status quo, market sensitive to any Powell tone shift.
Global macro: latent risk-off, geopolitical drivers closely watched.
BTC stable, no technical disruptor in the immediate term.
__________________________________________________________________________________
Final Decision Summary
Robust technical setup with a clear bullish bias. Optimal entries on 117400-116400 pullbacks, stops below support, active management needed during FOMC. No on-chain excess; constructive background unless exogenous shock or resistance failure (119000–123240). Stay alert for breakout/reject pivot.
__________________________________________________________________________________

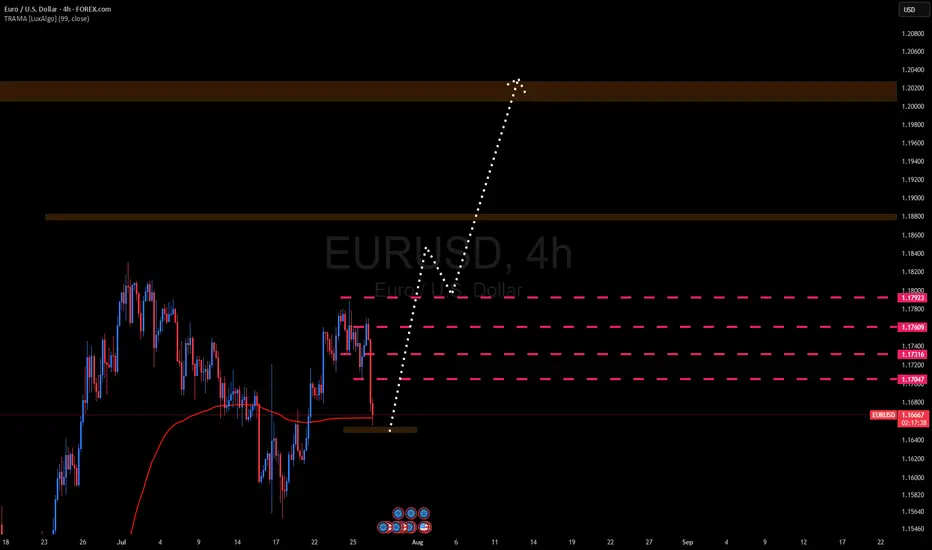
EURUSD BULLISH TREND 28-15 JUL-2025EUR/USD is expected to enter a bullish phase, with an upward move likely to start from the 1.16557–1.16486 range. The pair is projected to rise throughout the week, potentially reaching the 1.20051–1.20200 levels. As long as it continues toward that zone, the trend remains bullish
SHELL/USDT - Bullish StructureContinues to maintain a bullish market structure, printing consistent higher highs (HH) and higher lows (HL)—a clear indication of sustained buyer control. Price is currently consolidating within an upward accumulation box, where buyers are actively absorbing supply on each dip.
This phase reflects strong accumulation in an uptrend, often preceding an impulsive breakout move

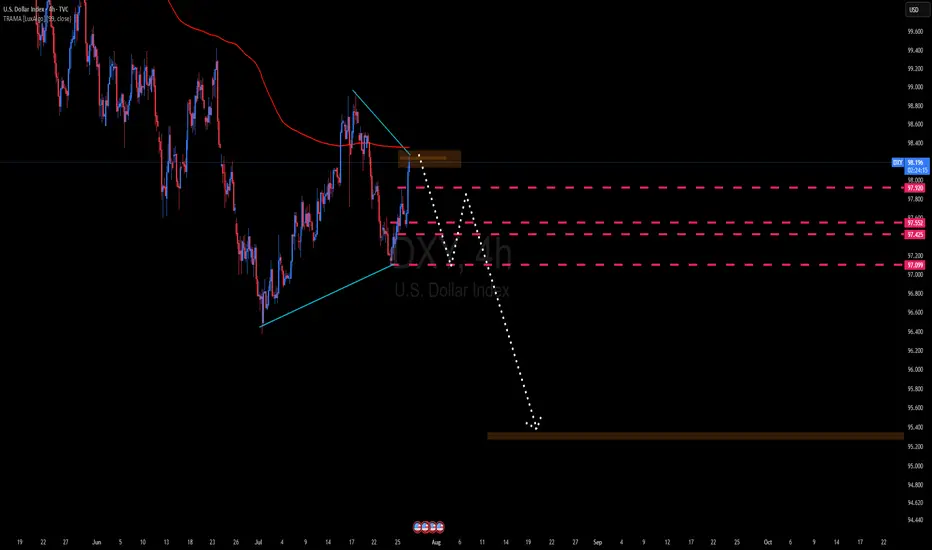
DXY Bearish Trend The DXY is expected to enter a bearish phase, with a potential decline starting from the 98.26–98.35 range, and possibly extending down to the 95.20–94.50 levels, which are anticipated to act as key support zones during the upcoming downtrend
Eigen Labs CEO CriticalMilestone ReducesETH Scalability TradeoffIn a major leap toward next-generation blockchain infrastructure, Eigen Labs, the developer behind EigenLayer, has announced the achievement of what its CEO describes as a “critical milestone” in the evolution of Ethereum scalability—reducing the long-standing trade-off between decentralization, security, and performance.
Speaking at the Ethereum Scaling Summit in Seoul, Eigen Labs CEO Sreeram Kannan unveiled the platform's updated modular architecture, which enables “restaked security” for a broad spectrum of Layer 2 networks and decentralized applications.
“Scalability without compromise has always been the holy grail,” Kannan noted. “This milestone changes the calculus—we no longer have to sacrifice decentralization or security for throughput.”
The Challenge: Balancing the Blockchain Trilemma
Since its inception, Ethereum has faced the so-called blockchain trilemma: optimizing only two out of three key elements—security, scalability, and decentralization. While Layer 2s such as Arbitrum and Optimism address throughput, they often introduce trade-offs in validator assumptions or operational complexity.
EigenLayer aims to address this through a novel re-staking mechanism, which leverages the security of Ethereum’s mainnet by allowing ETH stakers to “re-stake” their assets to secure other networks and services.
This innovation could radically expand Ethereum’s trust footprint without duplicating infrastructure or introducing centralized checkpoints—a persistent issue with several scaling models.
Institutional Interest and Market Significance
Venture capital and institutional crypto funds are watching closely. In Q2 2025, Eigen Labs closed a $100M Series B round, with participation from a16z, Polychain, and Jump Crypto. The firm’s long-term roadmap includes interoperability modules that will allow Ethereum-based Layer 2s to share consensus and security guarantees—a breakthrough for composability and capital efficiency.
“EigenLayer is fast becoming a backbone protocol,” says Nadia Liu, a partner at crypto VC firm Framework Ventures. “By minimizing fragmentation, it unlocks value across the entire Ethereum ecosystem.”
What It Means for Developers and Enterprises
For developers, EigenLayer offers a plug-and-play model for building secure applications without launching bespoke validator sets. For enterprise clients, the appeal lies in a more cost-efficient, composable Web3 stack, opening the door to scalable DeFi, gaming, and tokenized asset platforms.
Kannan emphasized that several pilot integrations are already underway with major DeFi protocols and data availability layers. While he did not name them, sources close to the matter hint at collaborations with StarkWare, Celestia, and Coinbase’s Base.
Looking Ahead
The broader implications of EigenLayer’s progress are hard to overstate. If adopted at scale, the protocol could standardize how Ethereum-based projects achieve security, replacing fragmented systems with a unified, market-driven security layer.
With this milestone, Eigen Labs may have just shifted the scalability conversation—from a compromise-based model to one of scalable consensus as a service.
“The modular era is here,” Kannan concluded. “And it's one that doesn’t ask builders to choose between performance and principles.”

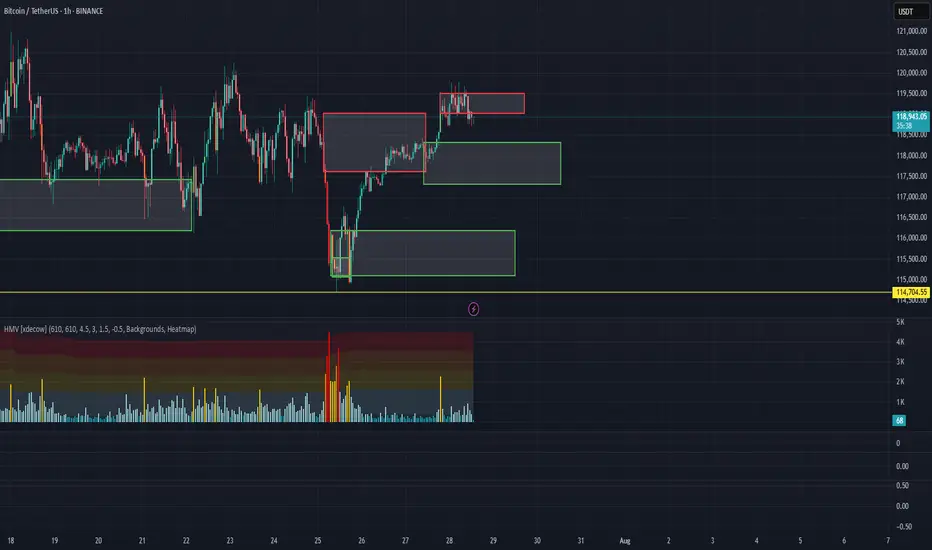
Market overview
📈 WHAT HAPPENED?
Last week, a less priority but expected scenario was realized for Bitcoin. We broke through the sideways in a downward direction and fell to the area of pushing volumes ~$115,000. At this level, strong volume anomalies were recorded, and a rebound occurred.
On Friday, the daily analysis on TradingView indicated a point to join the long movement, which confirmed its accuracy. The price reached the accumulated volume zone of the sideways at $117,600-$119,200 and was able to consolidate above without any significant reaction, which strengthens the buyers' position.
💼 WHAT WILL HAPPEN: OR NOT?
At the moment, the first protection from sellers has appeared. Let's consider possible scenarios:
1. A decline to the mirror zone of $118,300-$117,300, from which, if the buyers' reaction is confirmed, buys are expected to resume.
Next, a narrow sideways formation within the mentioned zone and a local sell zone of $119,500-$119,000 is possible, followed by a long position.
Another option is to develop a further long divergence from the current levels. In this case, the local sell zone of $119,000-$119,500 will provide additional support.
2. A less priority scenario is a decline to the volume anomaly zone of $116,200-$115,000, with a test of the local minimum. In this case, the recovery will take longer.
Buy Zones:
$118,300–$117,300 (mirror volume zone)
$116,200–$115,000 (volume anomalies)
$110,000–$107,000 (accumulated volumes)
Sell Zone:
$119,500–$119,000 (potential resistance if a correction develops)
📰 IMPORTANT DATES
Macroeconomic events this week:
• July 29, Tuesday, 14:00 (UTC) - publication of the US Consumer Confidence Index from CB for July;
• July 29, Tuesday, 14:00 (UTC) - publication of the US Job Openings and Labor Turnover (JOLTS) for June;
• July 30, Wednesday, 08:00 (UTC) - publication of Germany's GDP for the second quarter of 2025;
• July 30, Wednesday, 12:15 (UTC) — ADP's July change in the number of non-agricultural employees in the United States;
• July 30, Wednesday, 12:30 (UTC) — U.S. GDP for the second quarter of 2025;
• July 30, Wednesday, 13:45 (UTC) — Canada's interest rate decision;
• July 30, Wednesday, 18:00 (UTC) — US FOMC statement and announcement of the US Federal Reserve interest rate decision;
•July 30, Wednesday, 18:30 (UTC) — US FOMC press Conference;
• July 31, Thursday, 01:30 (UTC) — publication of the Chinese Manufacturing PMI for July;
•July 31, Thursday, 03:00 (UTC) — announcement of Japan's interest rate decision;
• July 31, Thursday, 12:00 (UTC) — publication of Germany's July Consumer Price Index (CPI);
• July 31, Thursday, 12:30 (UTC) — publication of the United States' June Personal Consumption Expenditure Price Index and Initial Jobless Claims;
• August 1, Friday, 09:00 (UTC) — publication of the Eurozone Consumer Price Index (CPI) for July;
• August 1, Friday, 12:30 (UTC) — publication of the average hourly wage, changes in the number of employees in the non-agricultural sector, and the unemployment rate in the United States for July;
• August 1, Friday, 13:45 (UTC) — publication of the U.S. Manufacturing Purchasing Managers' Index (PMI) for July.
*This post is not a financial recommendation. Make decisions based on your own experience.
#analytics
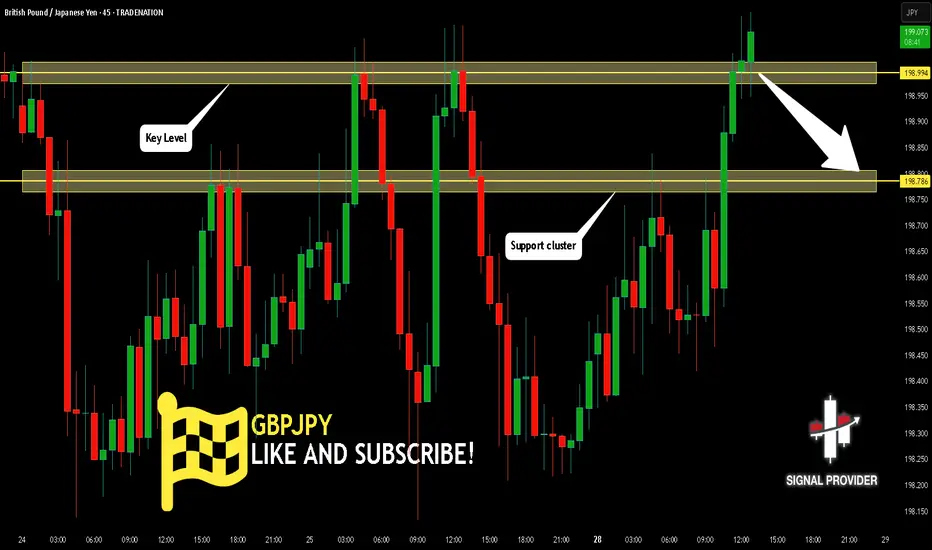
GBPJPY Is Very Bearish! Sell!
Please, check our technical outlook for GBPJPY.
Time Frame: 45m
Current Trend: Bearish
Sentiment: Overbought (based on 7-period RSI)
Forecast: Bearish
The market is approaching a significant resistance area 198.994.
Due to the fact that we see a positive bearish reaction from the underlined area, I strongly believe that sellers will manage to push the price all the way down to 198.786 level.
P.S
Overbought describes a period of time where there has been a significant and consistent upward move in price over a period of time without much pullback.
Disclosure: I am part of Trade Nation's Influencer program and receive a monthly fee for using their TradingView charts in my analysis.
Like and subscribe and comment my ideas if you enjoy them!
GBPAUD Is Going Up! Long!
Here is our detailed technical review for GBPAUD.
Time Frame: 6h
Current Trend: Bullish
Sentiment: Oversold (based on 7-period RSI)
Forecast: Bullish
The market is on a crucial zone of demand 2.055.
The oversold market condition in a combination with key structure gives us a relatively strong bullish signal with goal 2.070 level.
P.S
Please, note that an oversold/overbought condition can last for a long time, and therefore being oversold/overbought doesn't mean a price rally will come soon, or at all.
Disclosure: I am part of Trade Nation's Influencer program and receive a monthly fee for using their TradingView charts in my analysis.
Like and subscribe and comment my ideas if you enjoy them!

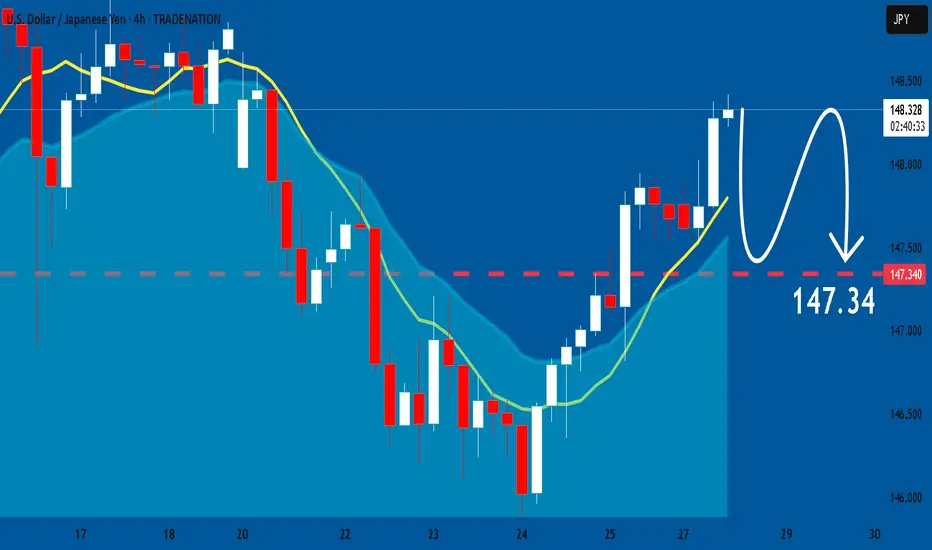
USDJPY: Market of Sellers
It is essential that we apply multitimeframe technical analysis and there is no better example of why that is the case than the current USDJPY chart which, if analyzed properly, clearly points in the downward direction.
Disclosure: I am part of Trade Nation's Influencer program and receive a monthly fee for using their TradingView charts in my analysis.
❤️ Please, support our work with like & comment! ❤️
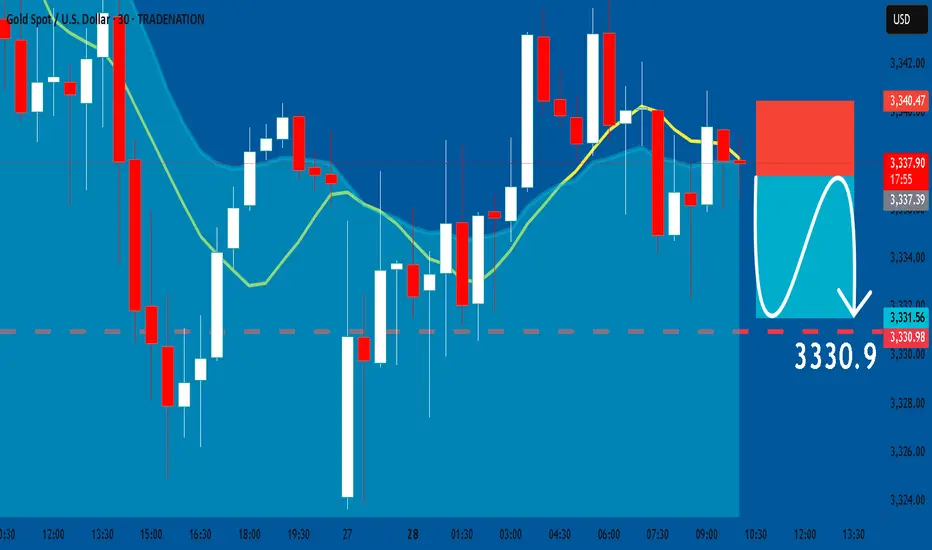
GOLD: Short Trade with Entry/SL/TP
GOLD
- Classic bearish setup
- Our team expects bearish continuation
SUGGESTED TRADE:
Swing Trade
Short GOLD
Entry Point - 3337.3
Stop Loss - 3340.4
Take Profit - 3330.9
Our Risk - 1%
Start protection of your profits from lower levels
Disclosure: I am part of Trade Nation's Influencer program and receive a monthly fee for using their TradingView charts in my analysis.
❤️ Please, support our work with like & comment! ❤️