EURUSD Massive Long! BUY!
My dear friends,
EURUSD looks like it will make a good move, and here are the details:
The market is trading on 1.1665 pivot level.
Bias - Bullish
Technical Indicators: Supper Trend generates a clear long signal while Pivot Point HL is currently determining the overall Bullish trend of the market.
Goal - 1.1728
About Used Indicators:
Pivot points are a great way to identify areas of support and resistance, but they work best when combined with other kinds of technical analysis
Disclosure: I am part of Trade Nation's Influencer program and receive a monthly fee for using their TradingView charts in my analysis.
———————————
WISH YOU ALL LUCK
Wave Analysis

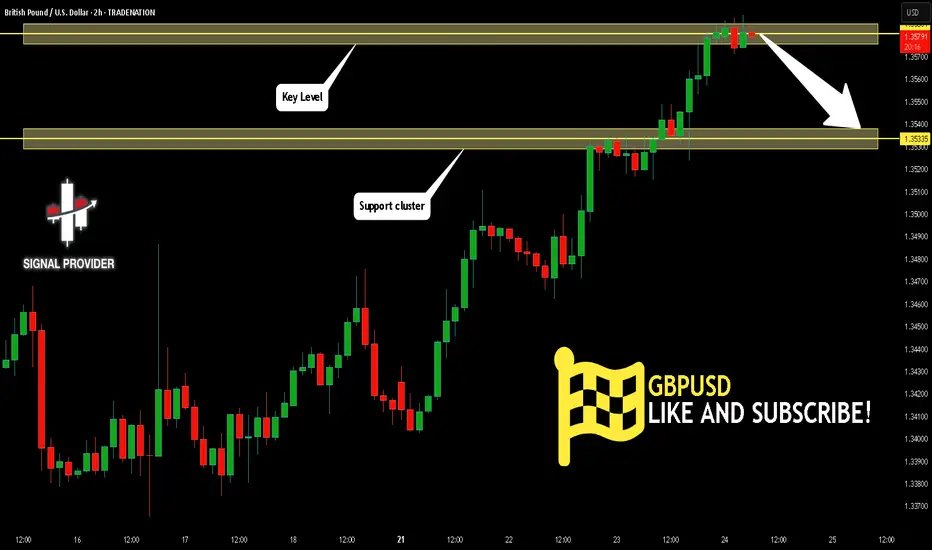
GBPUSD Will Go Lower! Short!
Take a look at our analysis for GBPUSD.
Time Frame: 2h
Current Trend: Bearish
Sentiment: Overbought (based on 7-period RSI)
Forecast: Bearish
The price is testing a key resistance 1.358.
Taking into consideration the current market trend & overbought RSI, chances will be high to see a bearish movement to the downside at least to 1.353 level.
P.S
The term oversold refers to a condition where an asset has traded lower in price and has the potential for a price bounce.
Overbought refers to market scenarios where the instrument is traded considerably higher than its fair value. Overvaluation is caused by market sentiments when there is positive news.
Disclosure: I am part of Trade Nation's Influencer program and receive a monthly fee for using their TradingView charts in my analysis.
Like and subscribe and comment my ideas if you enjoy them!
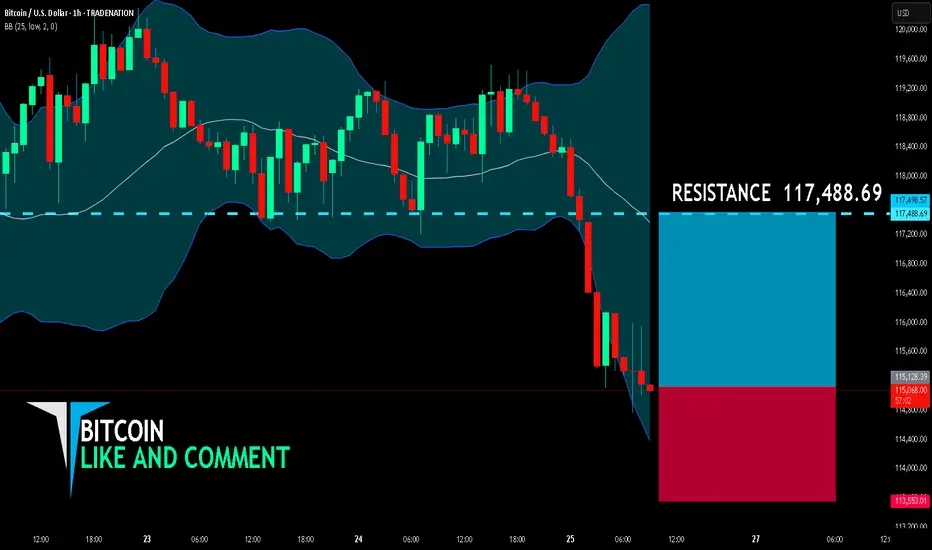
BITCOIN BULLS ARE GAINING STRENGTH|LONG
BITCOIN SIGNAL
Trade Direction: long
Entry Level: 115,128.39
Target Level: 117,488.69
Stop Loss: 113,553.01
RISK PROFILE
Risk level: medium
Suggested risk: 1%
Timeframe: 1h
Disclosure: I am part of Trade Nation's Influencer program and receive a monthly fee for using their TradingView charts in my analysis.
✅LIKE AND COMMENT MY IDEAS✅
NOT/USDTHas been ranging for over 170 days, forming a classic accumulation box structure, signaling strong base-building behavior. The long consolidation phase indicates that smart money may be actively accumulating before a major rally.
Price action is showing early signs of reversal, with demand stepping in near the lower boundary of the range. Breakout attempts are becoming more frequent and volume is gradually picking up key signs of a potential expansion phase on the horizon.

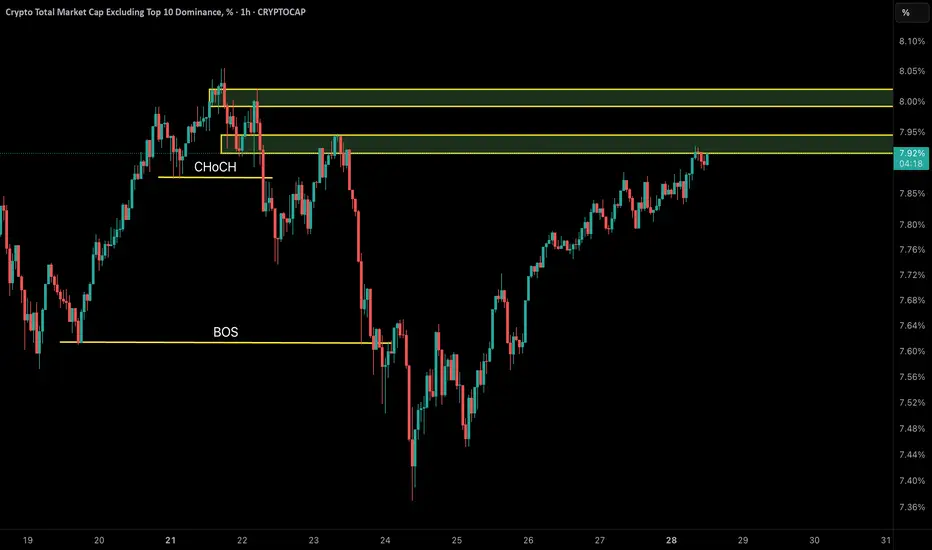
Other Dominance (OTHER.D) –Liquidity Grab Before Potential Crash
🟡 Structural Analysis:
🔸 First, a CHoCH (Change of Character) occurred around the 7.87% level, formed by the break of the first key low and the failure to create a new high. This was the first warning sign of a trend change from bullish to bearish.
🔸 Then, by breaking the previous support low, the market formed an important BOS (Break of Structure) near 7.61%, confirming the start of a bearish trend.
🔸 After this break, the price entered a corrective/bullish phase and has now reached previous demand zones (now resistance). These areas are marked with yellow boxes on the chart. The current zone has strong resistance and a high probability of a bearish reaction.
⸻
🔍 Possible Scenarios:
1️⃣ If the price rejects the resistance zone at 7.95–8.00% and shows ranging candles or bearish engulfing candles, a bearish continuation and formation of LH (Lower High) can be expected.
2️⃣ If the price manages a strong breakout above resistance and closes above 8.00%, the current bearish structure may become invalidated and a new bullish trend could start.
⸻
🧠 Important Trading Notes:
• As long as the previous high (8.00%) is not broken, the dominant structure remains bearish.
• The best selling opportunity is near the current resistance with confirmation of bearish signals.
• If resistance is broken, proceed cautiously and wait for confirmation.
⸻
📊 Analysis by: CryptoPilot
#PriceAction #SmartMoney #CHoCH #BOS #DominanceAnalysis #CryptoPilot #MarketStructure #TechnicalAnalysis
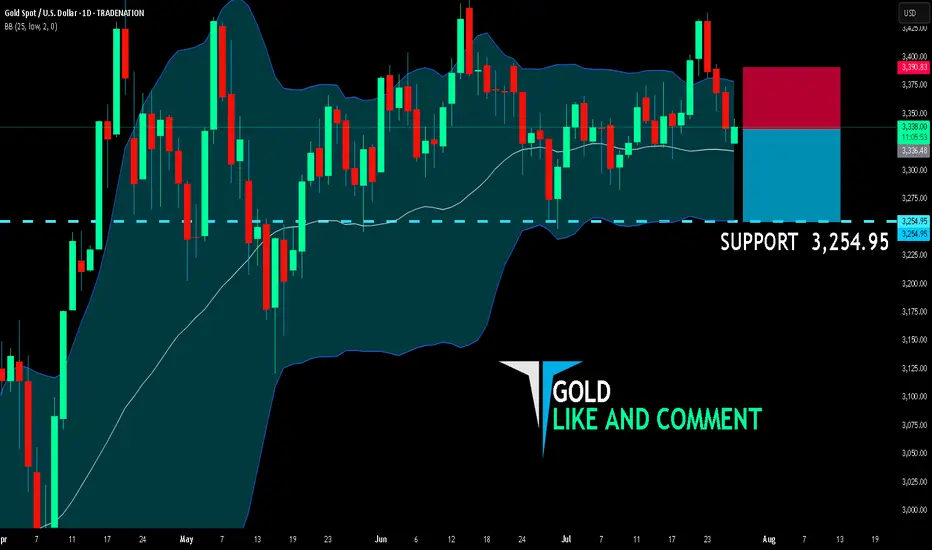
GOLD SENDS CLEAR BEARISH SIGNALS|SHORT
GOLD SIGNAL
Trade Direction: short
Entry Level: 3,336.48
Target Level: 3,254.95
Stop Loss: 3,390.83
RISK PROFILE
Risk level: medium
Suggested risk: 1%
Timeframe: 1D
Disclosure: I am part of Trade Nation's Influencer program and receive a monthly fee for using their TradingView charts in my analysis.
✅LIKE AND COMMENT MY IDEAS✅
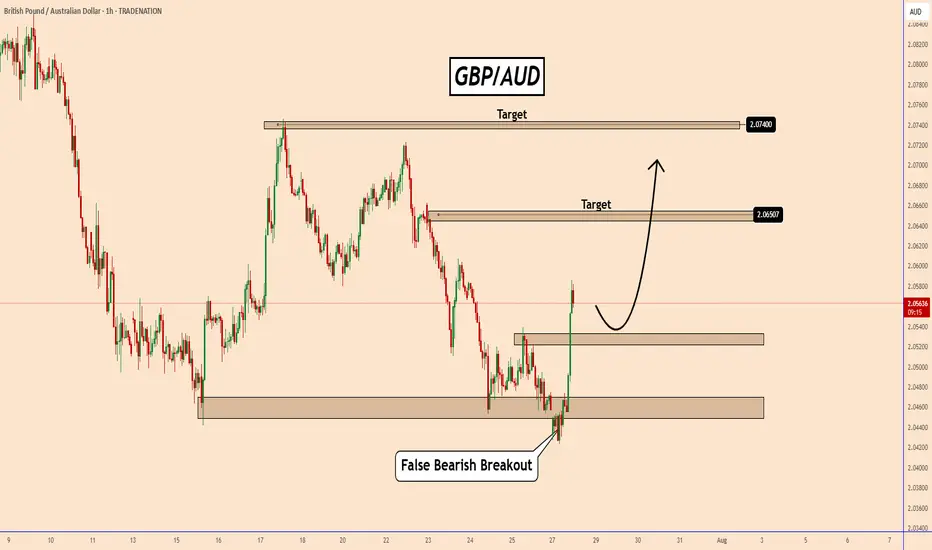
GBPAUD transformed its chart quickly from bearish to bullish!GBPAUD transformed its chart quickly from bearish to bullish!
During the opening of the Market today, GBPAUD created a clear bearish breakout structure and later canceled that breakout.
From the chart we can see a false bearish breakout and GBPAUD is already positioned for a bullish move.
The bullish move is very aggressive and the price increased by almost 135 pips in just 2.5 hours.
After a short pause, GBPAUD should increase further to 2.0650 and 2.0740.
You may find more details in the chart!
Thank you and Good Luck!
PS: Please support with a like or comment if you find this analysis useful for your trading day
Disclosure: I am part of Trade Nation's Influencer program and receive a monthly fee for using their TradingView charts in my analysis.
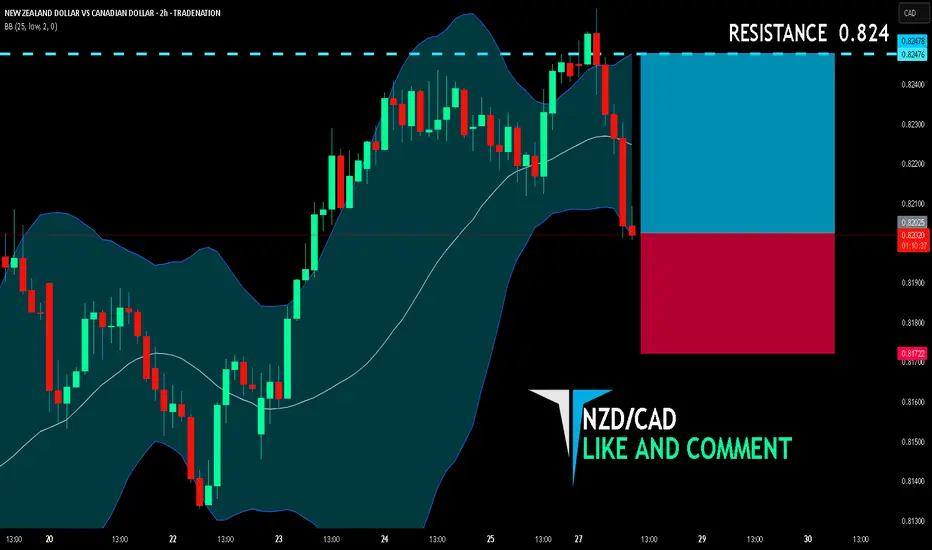
NZD/CAD BULLS ARE GAINING STRENGTH|LONG
NZD/CAD SIGNAL
Trade Direction: long
Entry Level: 0.820
Target Level: 0.824
Stop Loss: 0.817
RISK PROFILE
Risk level: medium
Suggested risk: 1%
Timeframe: 2h
Disclosure: I am part of Trade Nation's Influencer program and receive a monthly fee for using their TradingView charts in my analysis.
✅LIKE AND COMMENT MY IDEAS✅
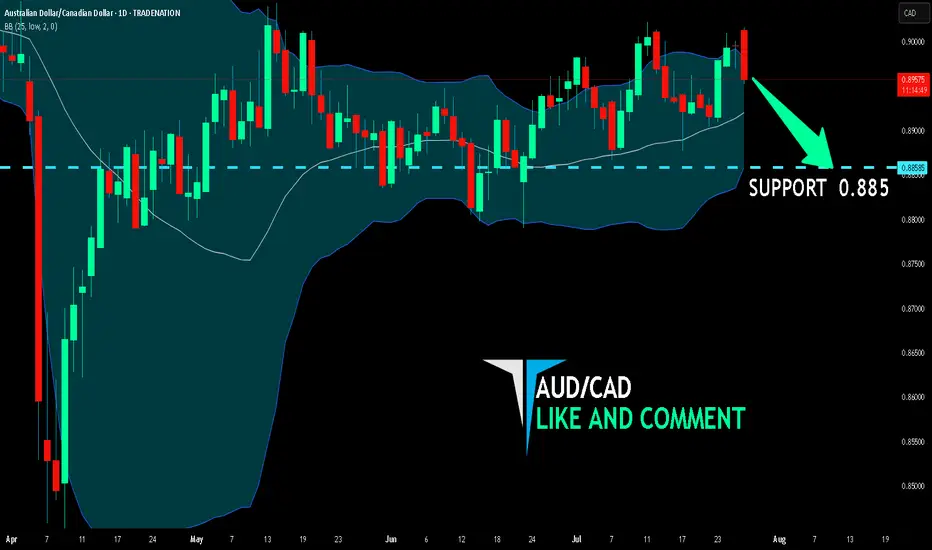
AUD/CAD SELLERS WILL DOMINATE THE MARKET|SHORT
Hello, Friends!
We are now examining the AUD/CAD pair and we can see that the pair is going up locally while also being in a uptrend on the 1W TF. But there is also a powerful signal from the BB upper band being nearby, indicating that the pair is overbought so we can go short from the resistance line above and a target at 0.885 level.
Disclosure: I am part of Trade Nation's Influencer program and receive a monthly fee for using their TradingView charts in my analysis.
✅LIKE AND COMMENT MY IDEAS✅
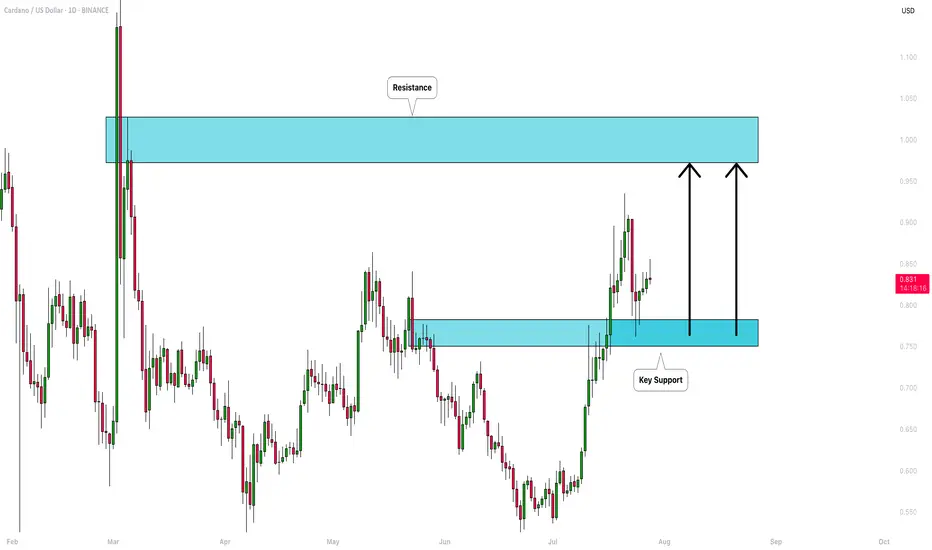
CARDANO (ADAUSD): Bullish Move Ahead!
ADA is testing a key daily support cluster.
I think the market is going to bounce from that
and continue growing.
Next resistance - 0.97
❤️Please, support my work with like, thank you!❤️
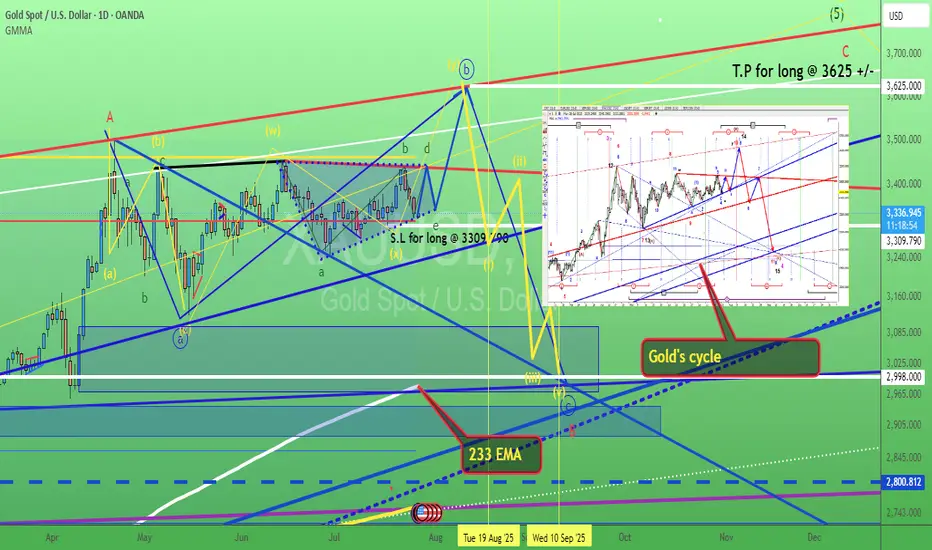
Gold. Bull Trap "triangle". 28/July/25XAUUSD, by checking gold latest speed of chart with its cycle. we might have a bull 'trap" triangle. A base for rallying to ATH again before a very deep pullback toward 233 Daily EMA which have not been "touched" for long time...
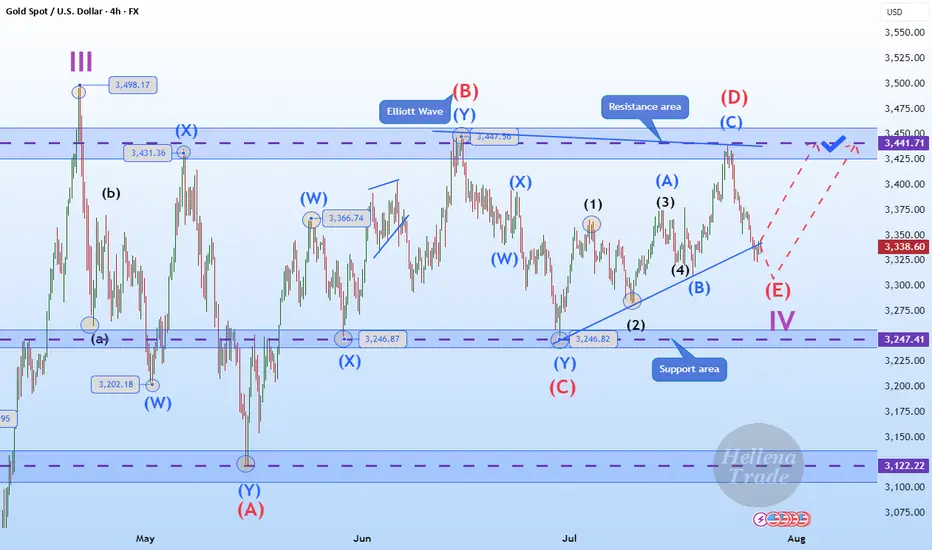
Hellena | GOLD (4H): LONG to resistance area of 3440 (Wave V).As you can see, everything turned out to be more complicated than I had previously thought. We are dealing with a complex correction and a diagonal. I believe that the “ABCDE” waves, which make up the corrective wave “4”, are completing their levels, and I continue to expect the upward movement to continue.
The first area I expect is the resistance area of 3440. This will be the beginning of the large upward wave “V.”
Manage your capital correctly and competently! Only enter trades based on reliable patterns!
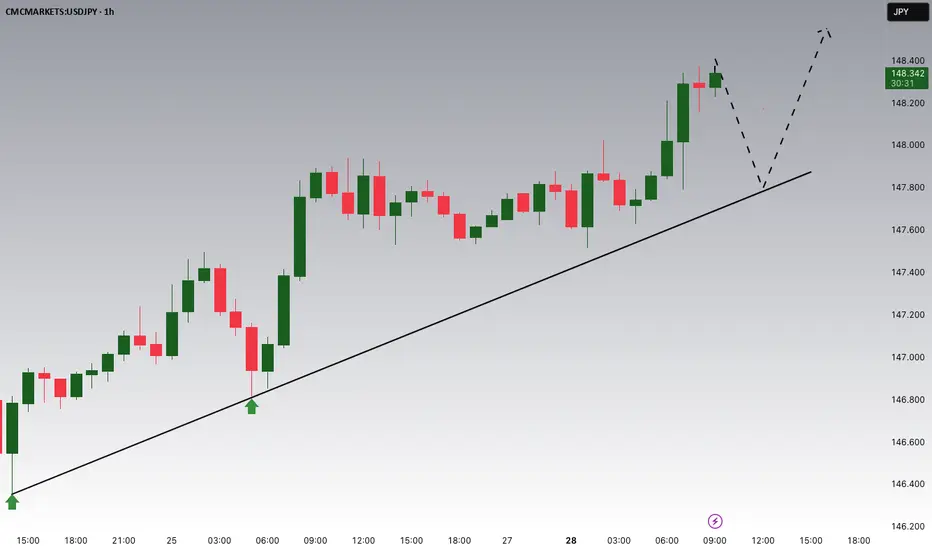
USDJPY Potential UpsidesHey Traders, in today's trading session we are monitoring USDJPY for a buying opportunity around 147.800 zone, USDJPY is trading in an uptrend and currently is in a correction phase in which it is approaching the trend at 147.800 support and resistance area.
Trade safe, Joe.
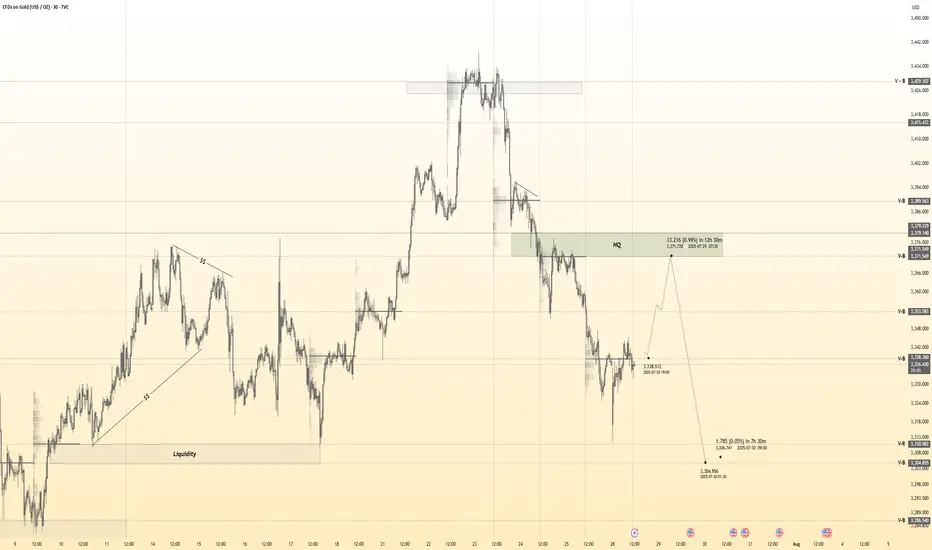
Gold 30Min Engaged ( Bullish After Break Out Entry Detected )———
Time Frame: 30-Minute Warfare
Entry Protocol: Only after volume-verified breakout
🩸Bullish Break - 3339
➗ Hanzo Protocol: Volume-Tiered Entry Authority
➕ Zone Activated: Dynamic market pressure detected.
The level isn’t just price — it’s a memory of where they moved size.
Volume is rising beneath the surface — not noise, but preparation.
🔥 Tactical Note:
We wait for the energy signature — when volume betrays intention.
The trap gets set. The weak follow. We execute.
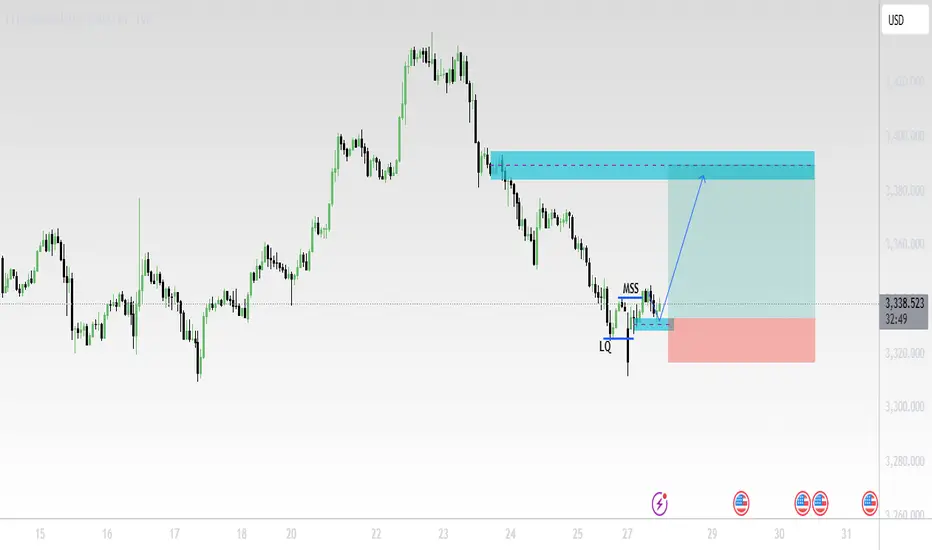
XAUUSD (Gold/USD) – 1H Chart Analysis (July 28, 2025)🔍 Technical Summary:
Market Structure Shift (MSS) detected after liquidity (LQ) grab.
Price formed a bullish break of structure confirming a possible trend reversal.
Entry taken near support (after LQ), targeting a supply zone above.
📊 Key Chart Elements:
LQ (Liquidity Grab):
Price swept previous lows, triggering stop-losses before reversing.
MSS (Market Structure Shift):
Break of internal structure confirms potential upside movement.
Blue Zone (Target Area):
A clear supply zone, likely to act as resistance.
TP (Take Profit) placed just below this zone.
SL (Stop Loss):
Positioned below the recent low (LQ) – tight risk management.
📈 Outlook:
Expecting bullish continuation towards 3,380+ zone.
If price respects support and structure holds, long entries remain valid.
Watch for reaction at the supply zone – potential rejection or consolidation.
⚠️ Disclaimer:
This is not financial advice. Always do your own research before trading.
Combining three important indicators for the ALT seasonThe best tool for detecting the start of the Alt Season is a combination of three important indicators: Bitcoin Dominance, Tether Dominance, and USDC Dominance.

NZD/CHF Rebounds from Trendline SupportThis NZD/CHF 1-hour chart shows a bounce from a rising trendline support at 0.47669. Price is expected to retest support before moving toward the 0.47937 resistance and potentially reaching the 0.48118 demand zone. Trend remains bullish above support.

BTC poised to rise further! Market volume remains the problemBTC poised to rise further! Market volume remains the problem
From our chart we can see that BTC likes to make big corrections before moving higher. Over the weekend, BTC transformed from a bearish picture to a clear bullish triangle with a bullish breakout.
The prevailing trend should push BTC higher as shown in the chart, but again the problem is with the volume.
Suppose BTC has not accumulated enough volume during the development of the pattern. In that case, it is very likely that it will fall even further to develop an even larger pattern like the previous one that we can see at the end of the wave.
However, at the moment, BTC has a bullish pattern and the scenario could develop in the way shown in the chart. We cannot assume further transformations at the moment.
You may find more details in the chart!
Thank you and Good Luck!
PS: Please support with a like or comment if you find this analysis useful for your trading day

BTC Price Prediction and Elliott Wave AnalysisHello friends,
>> Thank you for joining me in my analysis. I think we will finish the 1st wave A in pink X wave as Gray ABCm. I am waiting for its confirmation.
>> Reminder about our previous confirmations:
* Day TF: Breaking 118451 for today and the next couple of days, and keep on above it, leads to ending the B wave successfully.
* 4Hr TF: Breaking 118451 for the past hours and keep on above it, we ended W wave successfully ( maybe also B ?)
Keep liking and supporting me to continue. See you soon!
Thanks, Bros

GOLD BUY M15 Gold (XAUUSD) 15-Minute Chart Analysis – July 28, 2025
Price is currently forming a potential bullish setup after a recent drop. A bullish order block area has been highlighted (purple zone), indicating a possible demand zone where buyers might step in.
Entry Zone: Around 3333 – current price region.
Stop Loss (SL): 3322 (placed below the demand zone).
Target: 3350 – marked as the main bullish target.
The expected move is a bounce from the demand zone, with multiple small retracements, leading to a potential breakout toward the resistance zone around 3350.

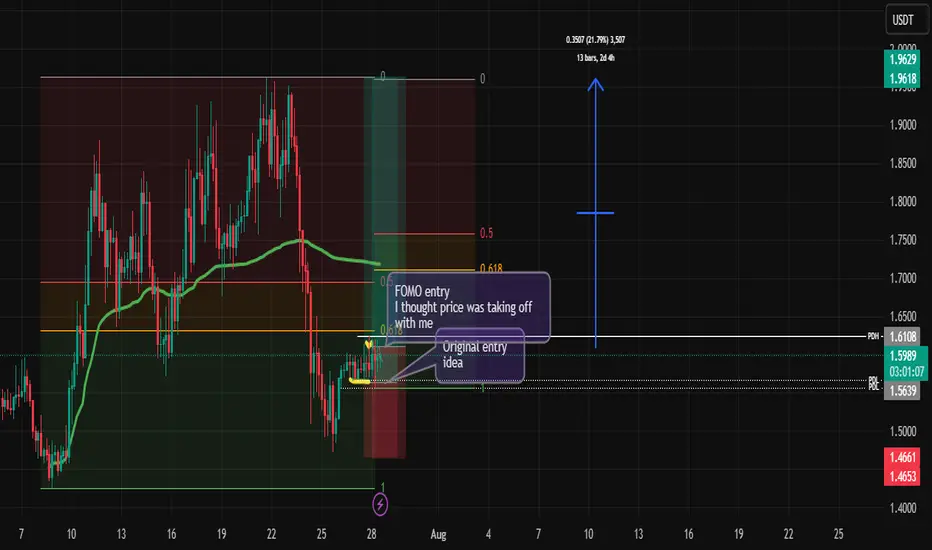
Virtual FOMO and a 20%%????
Like all the others, I am looking for a pump on virtual to grow that spot.
If look closely, I fomo in.
Let's see what happens in by the end of the week.
Solana (SOL) Revs Up Again — Fresh Breakout Above $200 in Sight?After months of consolidation, Solana (SOL) is once again showing signs of bullish momentum, trading near $176 and rapidly approaching a potential breakout level of $200. Investors and analysts alike are paying close attention, as on-chain activity and ecosystem development provide a compelling case for a renewed upward trajectory.
With growing demand for high-throughput blockchain infrastructure and new institutional integrations, Solana is positioning itself as more than just an Ethereum alternative—it’s emerging as a core infrastructure layer for high-performance Web3 applications.
Institutional Momentum Gathers Pace
In the last three weeks, several high-profile announcements have bolstered confidence in the Solana ecosystem. Fidelity Digital Assets revealed it is piloting tokenized bond products on Solana’s network, citing its fast settlement time and composability.
Meanwhile, Visa expanded its USDC settlement pilot on Solana across five countries, reinforcing the blockchain’s real-world financial use cases.
“Solana is no longer just retail-driven,” said Karla Nunez, digital asset strategist at ApexBridge. “Institutions are beginning to build directly on it—and that changes the dynamic.”
Ecosystem Growth and Developer Activity
The number of active developers on Solana has surged 38% quarter-over-quarter, according to Electric Capital’s Developer Report. Projects in DeFi, gaming, and NFTs continue to attract users, helped by extremely low transaction costs and sub-second finality.
Notably, the Solana Foundation recently launched a $100 million grant fund for AI-integrated crypto applications, which could catalyze the next wave of user adoption.
Technical Indicators Support Breakout Narrative
SOL has outperformed major altcoins this month, rising 21% in July. The token is now trading above its 50-day and 100-day moving averages, and momentum indicators suggest a potential breakout above the key psychological barrier at $200.
A confirmed break would likely open the door to $240–$260, with minimal historical resistance in that zone.
Macro Factors Provide Tailwind
The broader crypto market is recovering as inflation metrics cool and expectations for central bank easing rise. Solana, with its high beta to market movements, often leads altcoin rallies during bullish pivots.
Furthermore, the recent dip in Ethereum gas prices has had limited impact on Solana’s user base, suggesting its appeal is increasingly based on performance, not cost arbitrage.
Conclusion
While risks remain—from network outages to broader market volatility—Solana’s resurgence appears fundamentally supported. With institutional interest rising, technical signals aligning, and ecosystem momentum building, a clean break above $200 could mark the beginning of a new cycle for SOL.
For investors seeking exposure to high-speed smart contract platforms with real-world traction, Solana may be nearing another defining moment.

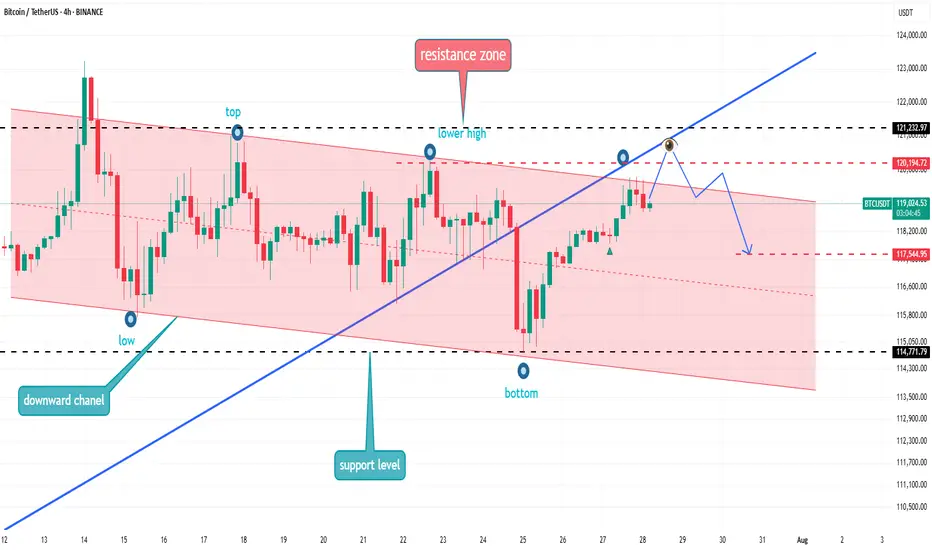
BTCUSDT Range-Bound Market: Short-Term Bearish MoveBTCUSDT
has failed to break through the descending resistance near 120,000 and is now forming a lower high within the broader resistance zone. The price action follows an impulsive leg up and is currently tracing a potential reversal pattern under key structural resistance. As long as the market remains capped below 120,000, continuation toward 117,500 is likely. The downward bias is supported by weakening momentum after the bull trap and resistance rejection.
📉 Key Levels
Sell trigger: Breakdown below 119,000
Sell zone: 119,400 – 120,000
Target: 117,500
Invalidation: Break and close above 120,500