Gold Crashing After Hot U.S. Data – More Pain Ahead?Minutes ago, important indices were released from the US , which catalyzed the continuation of gold's downward trend .
Key U.S. Economic Data Just Dropped!
ADP Employment: 104K
GDP q/q: 3.0%
Both came in stronger than expected , signaling that the U.S. economy is holding up better than many thought!
Strong job growth
Solid economic expansion
The result? A stronger U.S. dollar ( TVC:DXY ) and potential downward pressure on Gold .
All eyes are now on FOMC meeting .
Will the Fed still hint at future rate cuts despite the solid data? Or is the easing cycle officially on hold? What is your idea!?
----------------------
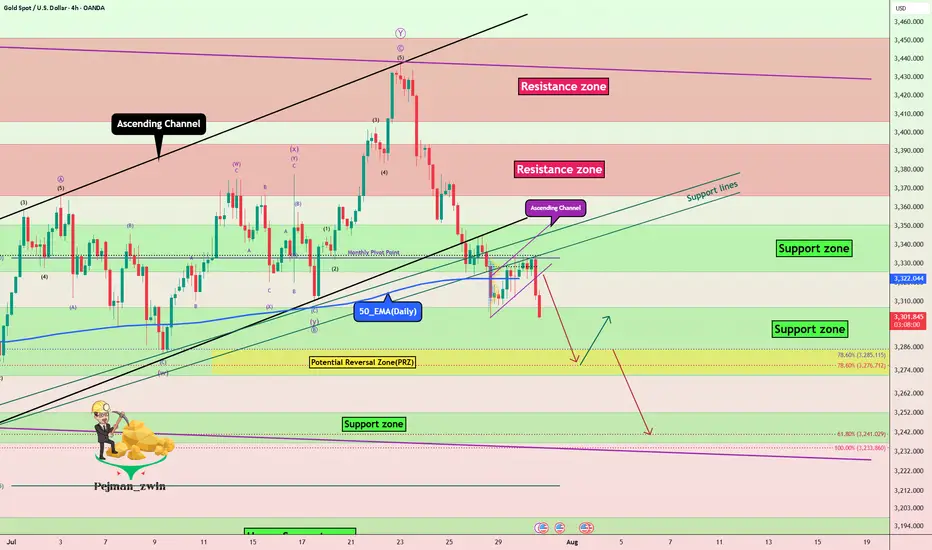
Gold ( OANDA:XAUUSD ) has already managed to break the Support zone($3,350-$3,326) , Monthly Pivot Point , 50_EMA(Daily) , Support lines , and the lower line of the ascending channel . Also, Gold trading below $3,333 plays an important role for me, which can increase the possibility of a continuation of the downtrend .
I expect Gold to drop to at least the Potential Reversal Zone(PRZ) before the FOMO meeting and if the Support zone($3,307-$3,272) is broken, we can expect further declines to $3,253(Second Target) .
--------------------------------
Information we need to know:
How should the Federal Funds Rate be announced to cause a deeper drop in Gold ?
The Fed needs to take a hawkish stance — meaning:
They keep rates unchanged, but make it clear they intend to keep them elevated for a prolonged period.
They emphasize strong economic data like today's solid ADP and GDP numbers .
They express concern that inflationary risks remain, and cutting rates isn’t on the table anytime soon.
In this case, markets get disappointed, rate cut hopes fade, and gold drops as real yields( TVC:US10Y ) rise and the U.S. dollar strengthens.
--------------------------------
Note: Stop Loss (SL) = $3,340
Gold Analyze (XAUUSD), 4-hour time frame.
Be sure to follow the updated ideas.
Do not forget to put a Stop loss for your positions (For every position you want to open).
Please follow your strategy; this is just my idea, and I will gladly see your ideas in this post.
Please do not forget the ✅ ' like ' ✅ button 🙏😊 & Share it with your friends; thanks, and Trade safe.
Wave Analysis
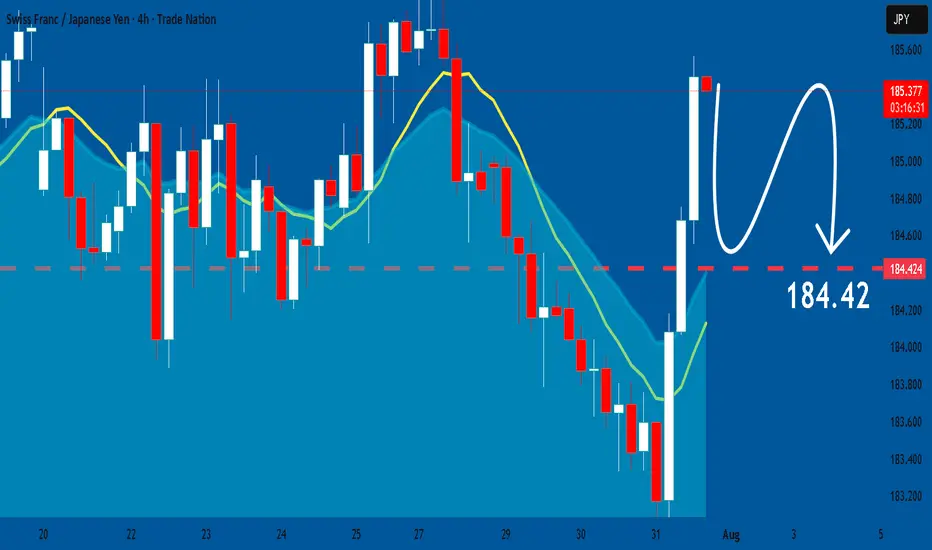
CHFJPY: Bearish Continuation is Expected! Here is Why
The price of CHFJPY will most likely collapse soon enough, due to the supply beginning to exceed demand which we can see by looking at the chart of the pair.
Disclosure: I am part of Trade Nation's Influencer program and receive a monthly fee for using their TradingView charts in my analysis.
❤️ Please, support our work with like & comment! ❤️
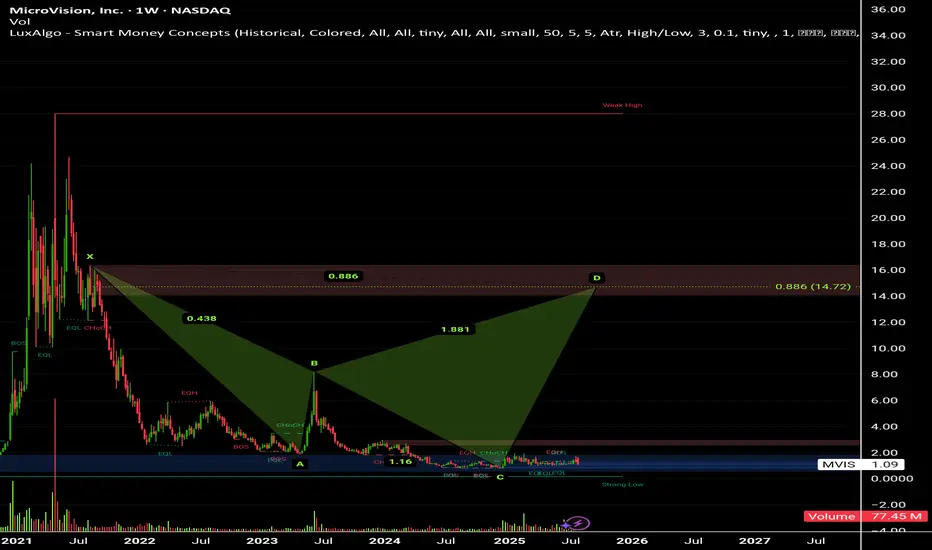
Microvision Inc (MVIS).Stock on triggering Explosive Level.
🦈 Shark Harmonic shap Target price above 14$ .
Any breaking up Resistance level 1.21$ , Buying signal triggering, Explosive level = 1.95$
Highly recommended for Buying now 👌
BITCOIN PREDICTION: NOBODY IS WATCHING THIS PATTERN !!!(warning)Yello Paradisers, I'm updating you about the current Bitcoin situation, which is extremely dangerous for crypto noobs that will get rekt again very soon!
It's going to be a big move soon. I'm telling you on a high timeframe chart we are doing multi-time frame analysis and on a high timeframe chart I'm updating you about the RSI indicator, the bearish divergence, the moving average reclaim, and the channel reclaim that we are having right now.
We are observing a shooting star candlestick pattern, which is a reversal sign, and I'm telling you what confirmations I'm waiting for to make sure that I can say with the highest probability that we are going to the downside. On a medium timeframe, I'm showing you two patterns: one is a head and shoulders pattern, then a contracting triangle, and on a low time frame, I'm sharing with you the ending diagonal because on a high time frame chart, we are either creating ABC or impulse, and I'm telling you what the probabilities are for the zigzag, which is a corrective mode wave, or the impulse, which is a motive mode wave.
I'm sharing with you what's going to happen next with the highest probability. Please make sure that you are trading with a proper trading strategy and tactics, and that's the only way you can be long-term profitable.
Don't be a gambler. Don't try to get rich quick. Make sure that your trading is professionally based on proper strategies and trade tactics.

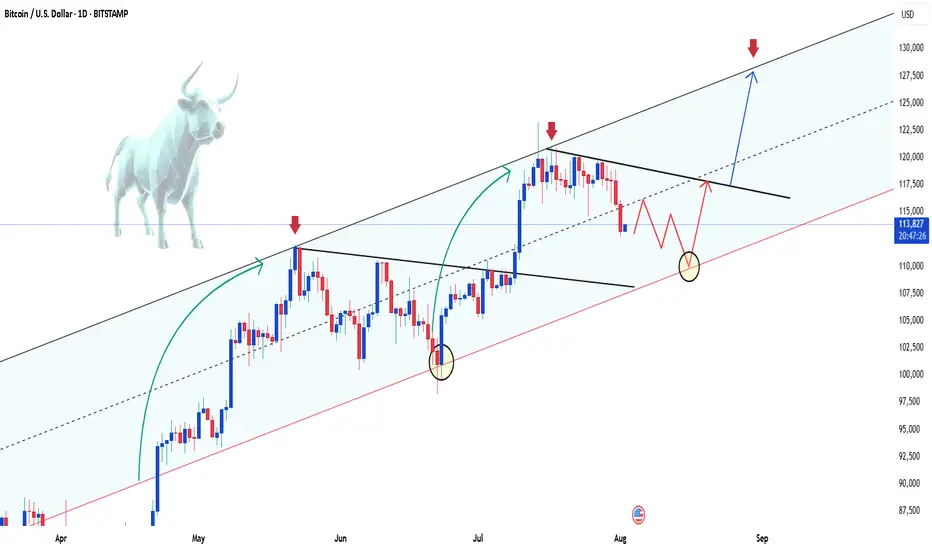
BTCUSD – bullish momentum is backBitcoin is making a strong comeback, breaking above short-term resistance and reestablishing its uptrend after a prolonged consolidation phase. The technical structure now shows clear control from the bulls, with higher highs and higher lows beginning to form.
Positive risk sentiment and growing expectations of capital flowing back into the crypto space—especially after a series of weak U.S. economic data—are fueling the current BTCUSD rally. If momentum holds, the next target could be the upper boundary of the price channel.
Keep an eye on how price reacts at key levels and trendlines — this might be the launchpad for the next bullish leg.
Good luck, and if you enjoyed this analysis, don’t forget to hit like and drop a comment!
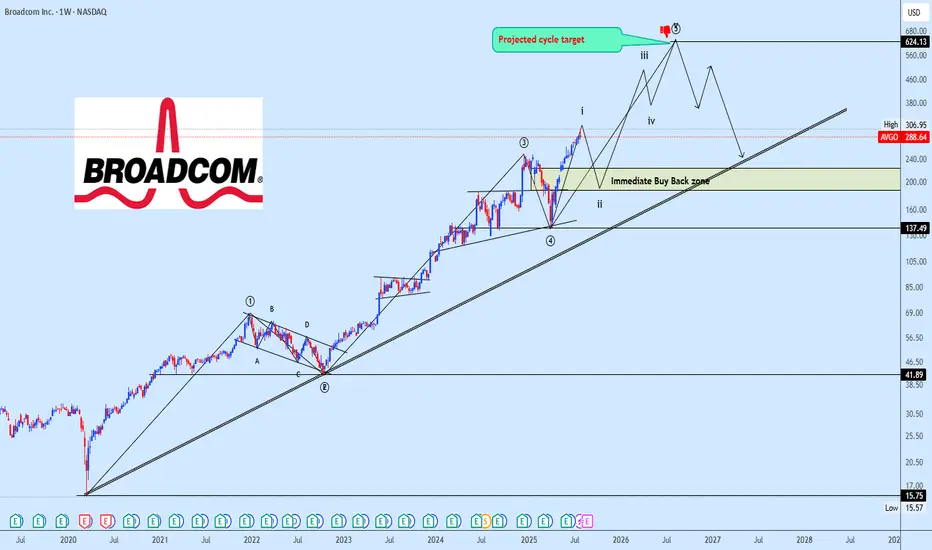
AVGO Bullish Impulse Wave Structure in ProgressAVGO continues its macro advance with a clear 5-wave impulse structure unfolding. The current price action marks the completion of subwave (i) of wave ⑤, setting the stage for a corrective pullback into subwave (ii).
We expect this corrective leg to reach into the 38.2%–50% Fibonacci retracement zone of subwave (i), which will serve as a potential re-accumulation area before the next bullish expansion.
The strategy remains to monitor the development of wave (ii) closely, waiting for key price reaction around the identified retracement zone to build positions in anticipation of subwave (iii) of ⑤ typically the strongest and most impulsive move in Elliott Wave structure.
Targets are shared on the chart for clarity. Patience here is key as we await the right entry zone aligned with technical confluence.
📌 Drop your stock requests in the comment section for quick chart updates — only equity-based assets will be accepted under this post.
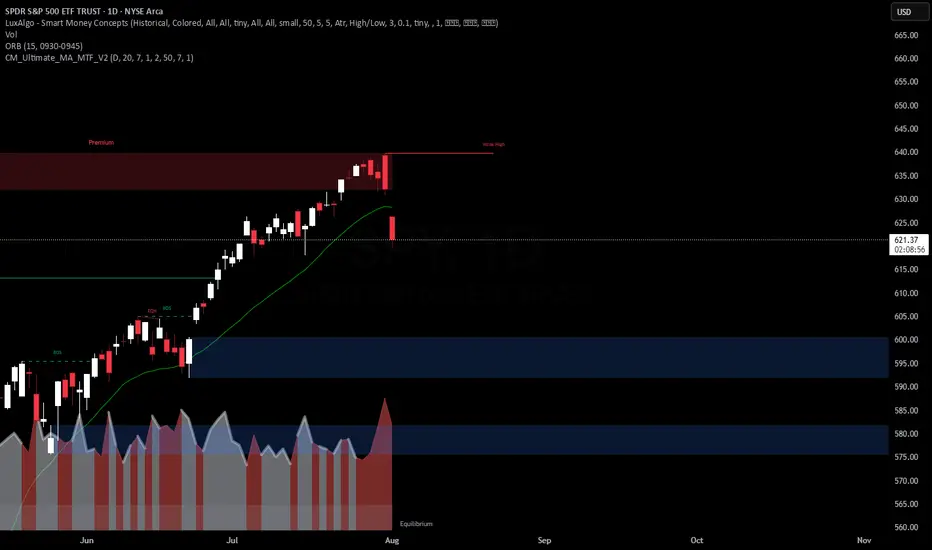
SPY: I think dollar milkshake is brewing, buying for long term📉 SPY Daily Breakdown – Aug 1, 2025 | VolanX Observations
🧠 Bot failed today, but the market taught more than any trade could have. Sitting out gave me the clarity to reassess structure and edge.
🔍 Market Structure Update:
Gap Down from Premium Zone: Today’s price action rejected the weak high and created a clean daily gap — signaling potential distribution at the top.
ORB (15-min) marked and ready: Likely to be retested on Monday. If price rallies into this zone and rejects, that’s where I’ll look for short entries.
Friday Bearish Close Rule: Statistically, when Friday closes red with strong momentum, Monday tends to follow — especially after a gap-down open.
🧭 Big Picture Outlook:
Liquidity Zones Below:
600 → First institutional reaction zone.
580 → Deeper demand and equilibrium area from previous consolidation.
Dollar Milkshake Brewing: Strong USD thesis could pressure equities short-term. This aligns with potential flow into defensives and out of high beta.
Long-Term Bias: Watching for deep discounts. If price moves into high-value demand zones, I’ll accumulate for the long haul — buying fear when it's priced in.
📌 What I’m Watching Next Week:
Monday open – will we see Gap & Go or a Gap Fill + Fade?
Reaction to ORB zone.
Volatility behavior and volume footprint in the first 90 minutes.
🔻 No trades today due to a bot error, but ironically, that gave me better vision. Sometimes, the best trades are the ones you don’t take.
VolanX Protocol engaged. Standing by.
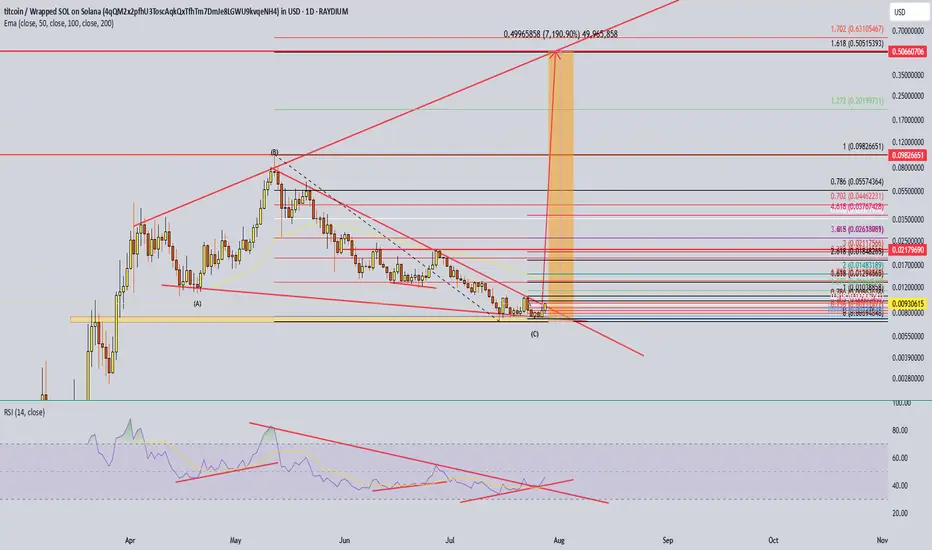
Solana Bullish Wave 5 coming?solana has completed the 3rd impulsive wave and now the recent decline was not impulsive but corrective meaning wave 4 has almost completed now we can look for wave 5 tp and sl are on the chart

The Great XRP Escape Plan: Thief Strategy Deployed🌀 XRP/USDT – Thief Trader’s Master Heist Plan: Crack the Vault Before They Catch On! 🧠💰
🔐💸 Operation Code: Ripple Raid 3.9 - Eyes on the Prize, Hands on the Trigger 💥
🌍 Attention Global Market Robbers and Strategic Money Movers!
This ain't just another analysis—this is the Thief Trading Style Blueprint, surgically designed for the XRP/USDT Crypto Market. Whether you're a silent sniper or full-squad raider, this trade setup is your next high-voltage money heist.
🔍 Market Breakdown:
📊 Technical + Fundamental = Robbery Precision
Currently, Ripple (XRP) is showing bullish fuel—charging into our trap-the-bears zone. Volatility is tightening, resistance is trembling, and it smells like liquidity is about to get stolen.
⚠️ Warning: The market’s at a risky cross-zone – overbought with heavy consolidation – where big bears and trapped traders usually play defense. That’s exactly where we strike.
🔓 Entry Gameplan – “Wait, Trigger, Execute”
📈 Entry:
"The heist begins when the candle breaks the high and screams confirmation!"
Set Buy Stop Orders above the recent resistance (around 3.1000).
Alternatively, use Buy Limit Orders on pullbacks at key swing levels (15M or 30M timeframes).
We use a multi-layered entry strategy (aka DCA + stacking like a pro thief stacking vaults). Be surgical. Be patient.
📌 Pro Tip: Always set a chart alert at the trigger zone to avoid missing the breakout party.
🛑 Stop Loss – “Breakout First, Then Talk Safety”
🚫 NO SL BEFORE BREAKOUT. Period.
Once price breaks out, then:
🔐 SL = Nearest 4H candle wick swing low (around 2.8000).
But remember, your SL = your risk appetite.
Whether you're placing 1 big order or 10 mini traps, manage it smart.
🎯 Target – "Get Rich, Then Vanish"
🏴☠️ Primary Take Profit Zone:
Target: 3.9000
Or exit anytime you see signs of reversal.
Don't get greedy—get paid.
👀 Scalpers’ Note:
Only play the Long side.
If you're deep-pocketed, dive in straight. If not, ride with swing traders and trail your SL to protect profits.
🔥 Why This Trade is 🔐:
📈 Current price structure, liquidity zones, and momentum favor bulls.
📊 Correlated intermarket signals + on-chain activity + macro backdrop align with XRP strength.
🧠 Smart money accumulation is visible – this is your window before the big breakout.
🚨 News & Position Management Alert:
📢 Stay clear of opening trades during major news events.
Use Trailing Stop-Loss on running positions to lock gains while letting profits fly.
This is not hype. This is precision.
Thief Trader doesn’t guess – we plan, we trigger, we exit.
📌 Final Words:
Whether you're scalping seconds or swinging for days – follow the blueprint. XRP has a vault to crack, and we’re here to rob it clean.
Now go out there, set those traps, and let the market pay you like it owes you.
🧠💸🕶️ Next Heist Plan Coming Soon… Stay Sharp.

xauusdxauusd Focus on red line
From the price level of 3368 and above, gold is expected to pull back at least until the Stochastic on the M30–H1 timeframes reaches oversold levels.
After that, a bullish continuation is likely, pushing the price up to around 3400.
This area will be a critical decision point — determining whether the market will continue its uptrend or reverse into a downtrend.
If the H4 chart prints a reversal candlestick pattern, it would indicate the beginning of a bearish trend, which could potentially lead to a downward movement of up to 20,000 points.

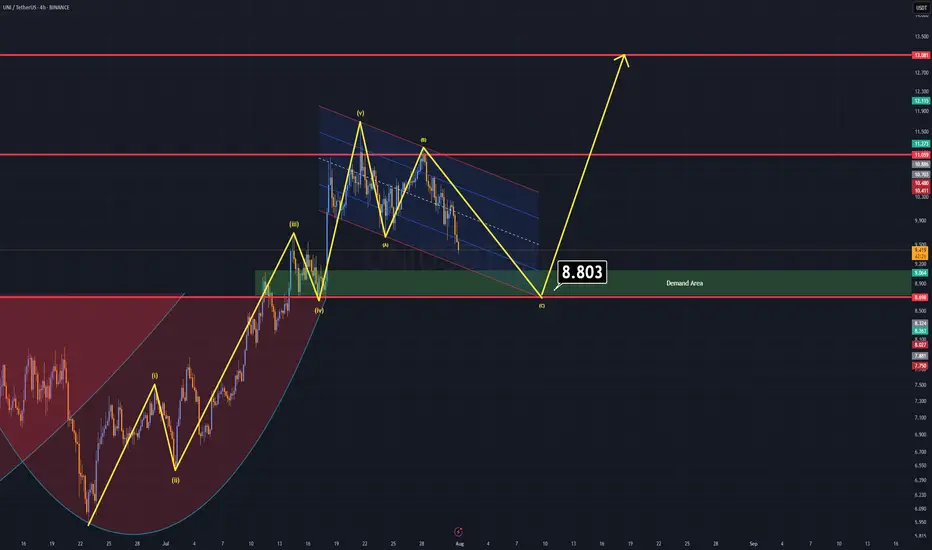
UNI Analysis (4H)UNI – Correction Might Bring Opportunity
Currently, UNI is forming an A–B–C corrective pattern, and based on technical structure, this correction may complete around the $8.8 level.
Key Zone to Watch: $9.0 – $8.5
There's a strong demand zone just below $9, supported by historical price action.
On the daily time frame, a broken cup & handle formation aligns perfectly with this area — the old neckline may now act as support, increasing the confluence.
This overlap of structure and demand makes the $9–$8.5 zone a favorable entry for a long position.
Once price reaches this area, expect a significant upward correction as part of the next move in the cycle.
Good Luck.
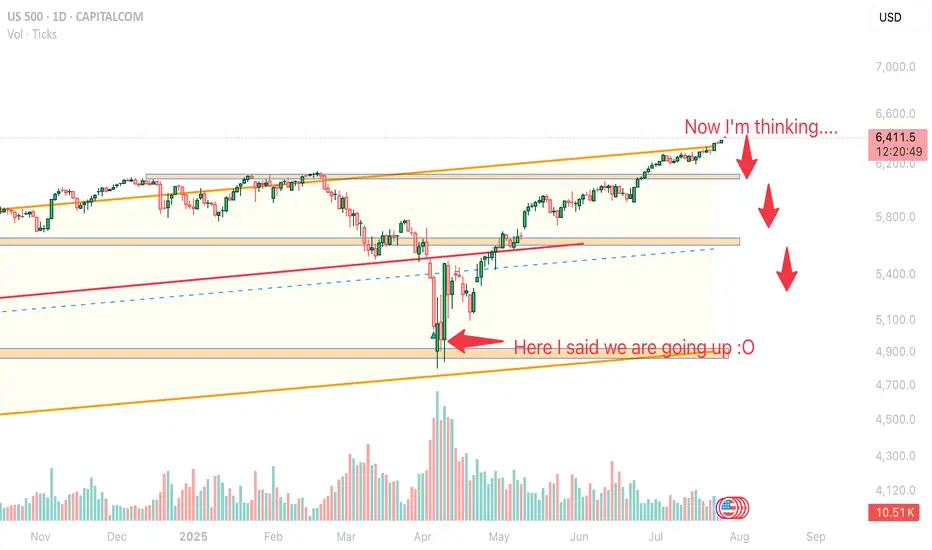
US500 SP500 Sell the news- ShortHello fellow traders, what do you think? Am I predicting FUTURE? This is my early entry, cautious, but holding steady, checking from time to time but general rule- what went up will eventually fall. The price is just a Wave of coincidance and events, trade carefully! Protect capital! don't copy my idea it's an idea NOT A TRADING ADVISE
CAD/CHF: Bearish Trend Resumes After Retest of Downtrend LineCAD/CHF continues to respect its prevailing downtrend, with price reacting from the descending trendline and showing signs of renewed bearish pressure. Fundamentals support further downside as CAD remains weighed by weak domestic data, while CHF holds steady as a safe-haven currency amid global tariff concerns.
Technical Analysis (4H Chart)
Trend: Strong downtrend structure, with repeated rejections from the descending trendline.
Current Level: 0.5829, consolidating after failing to break above 0.5863 resistance.
Key Support Levels:
0.5786 (near-term support and first bearish target).
0.5736 (secondary support and next major target).
Resistance Levels:
0.5863 (immediate resistance at descending trendline).
0.5910 (upper resistance if a breakout occurs).
Projection: Likely pullback toward 0.5863 (retest zone) before continuation to 0.5786 and possibly 0.5736.
Fundamental Analysis
Bias: Bearish.
Key Fundamentals:
CAD: Weak Canadian manufacturing PMI and trade risks from US tariffs limit CAD upside.
CHF: Swiss Franc remains supported by safe-haven demand amid tariff uncertainty.
Oil Prices: Stable oil offers partial CAD support but insufficient to change the broader trend.
Risks:
A sharp rise in oil prices could strengthen CAD.
Global risk-on sentiment could weaken CHF and lift CAD/CHF.
Key Events:
BoC policy updates.
SNB stance and global risk sentiment shifts.
Oil market data.
Leader/Lagger Dynamics
CAD/CHF is a lagger, following CAD’s performance relative to oil and CHF’s safe-haven flows.
Summary: Bias and Watchpoints
CAD/CHF remains bearish, with price respecting the downtrend and targeting 0.5786 initially. A break below this level opens the door to 0.5736. The key watchpoints are oil price fluctuations, global risk sentiment, and potential safe-haven demand for CHF.

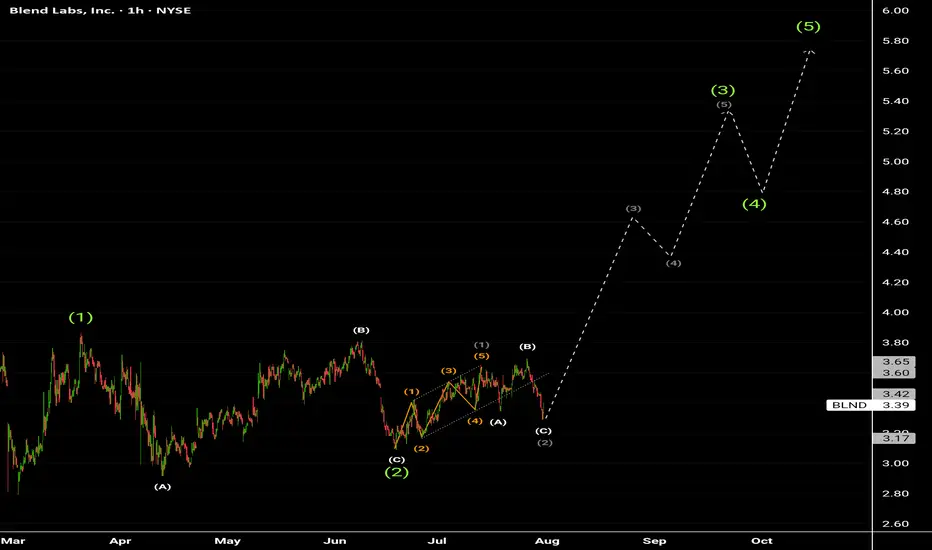
Blend labs inc. w1 completed of W3 , Rally expected to start to almost 4.60$ and above .
Target price 5.35$ and above shortly. 💥
It seems to me a great Earnings coming in August.
Highly recommended for Buying Now from present level.
Buy it ASAP 💣.
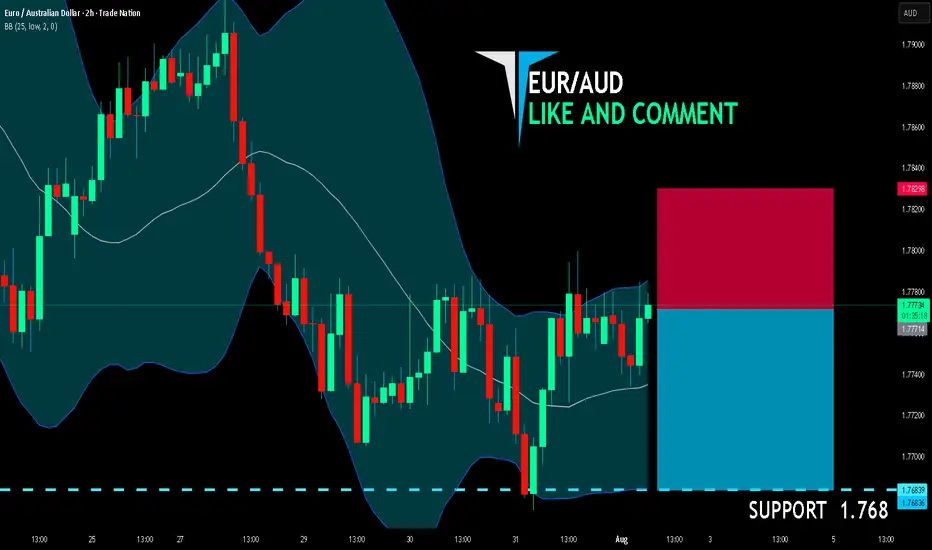
EUR/AUD BEARS ARE GAINING STRENGTH|SHORT
EUR/AUD SIGNAL
Trade Direction: short
Entry Level: 1.777
Target Level: 1.768
Stop Loss: 1.782
RISK PROFILE
Risk level: medium
Suggested risk: 1%
Timeframe: 2h
Disclosure: I am part of Trade Nation's Influencer program and receive a monthly fee for using their TradingView charts in my analysis.
✅LIKE AND COMMENT MY IDEAS✅
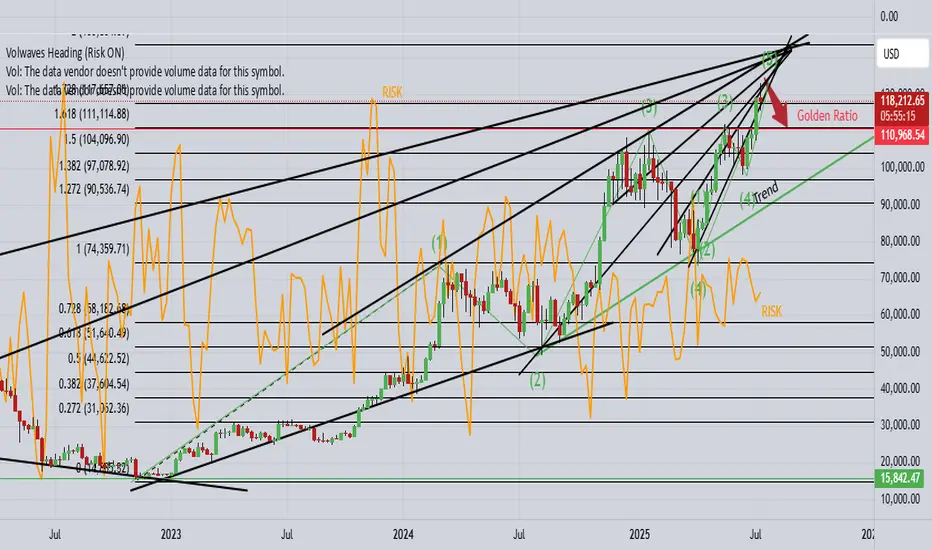
BTCUSD looking for corrective drop towards $111K!1). "Indecisive" weekly Doji retail candle! 2). Price rejection off higher times! 3). Risk indicator is heading south! 4). Trump said "BUY!" 5). There appears to be a cluster of "BUY" orders around $114$K as typically, price drops to trigger those orders!
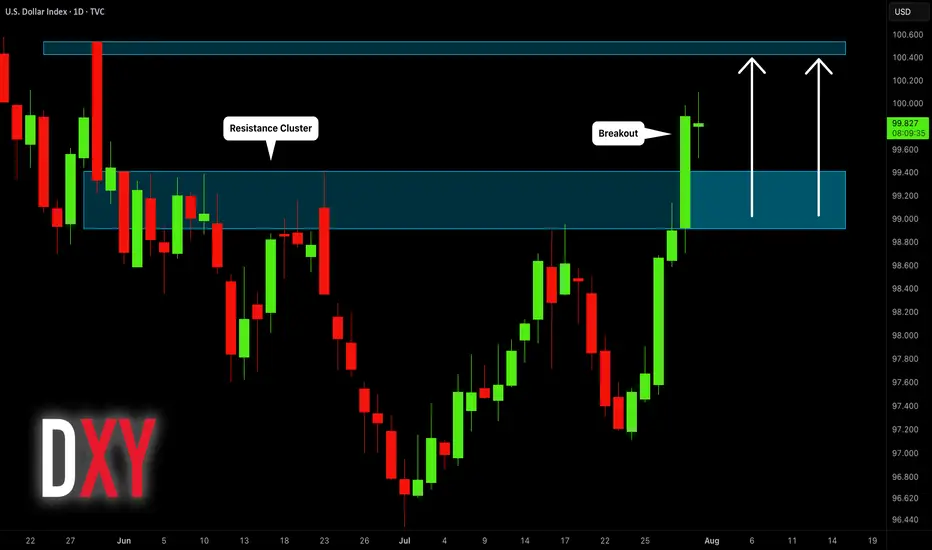
Dollar Index (DXY): Will It Rise More?!
Dollar Index is on its way to 100.4 resistance.
A breakout of a major supply cluster on a daily after FED meeting
yesterday indicates a strong bullish pressure.
I think that growth will continue soon.
❤️Please, support my work with like, thank you!❤️
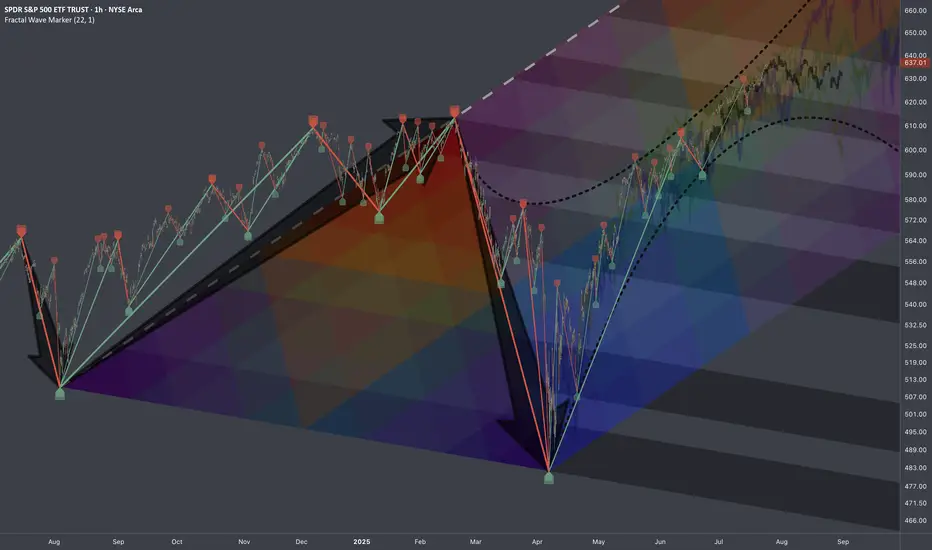
$SPY: Mapping Scenarios🏛️ Research Notes
Fractal Corridors
Shows recursive formations which indicates a full fractal cycle.
The angles of decline are parallel which is important for potential buildup.
To map a cycle we'd need to apply fib channel to the opposite direction In a way this should be sufficient to cover the scenarios of nearest future if we were to use bar patterns to validate a structure.
These are examples of historic progressions with similar growth patterns (composite sub-cycles):
This explains most elements present in interactive chart.
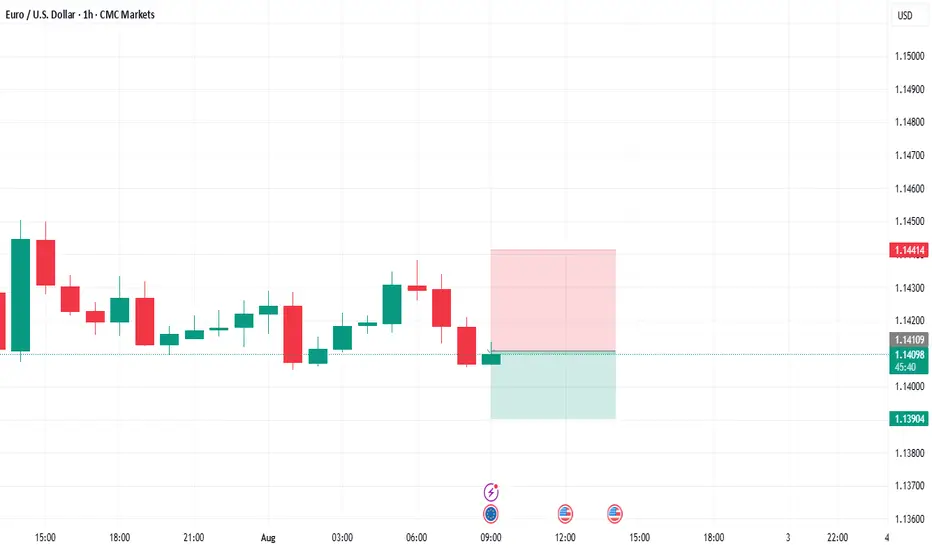
eurusd Short position sell 20 to 30 pips Eur usd short position sell 20 to 30 pips .
If you want to learn this analysis system free free contrect with me .
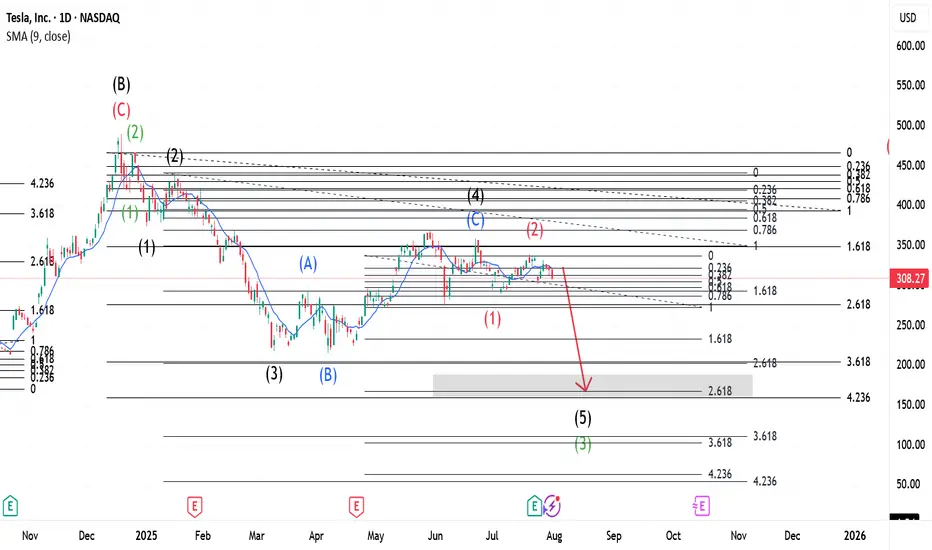
$TSLA ~ Elliott Wave Updates.This whole wave is Wave C(Black) that started when Wave B(Black) was completed. This Wave C(Black) expresses itself in 5 main waves shown in Green. Wave 2(Green) was a Zigzag and a Flat should be expected for 4(Green). Meanwhile, Wave 3(Green) expresses itself in a 5 wave move shown in Black- with Wave 2(Black) being a Zigzag, our 4 was a Flat. This Flat is shown as Blue ABC. When Wave 4(Black) completed, our Wave 5 began which upon completion, would be Wave 3(Green) of the main wave. Wave 2(Red) is a Flat and a Zigzag should be expected after 3(Red).
Go to for more information of the same.
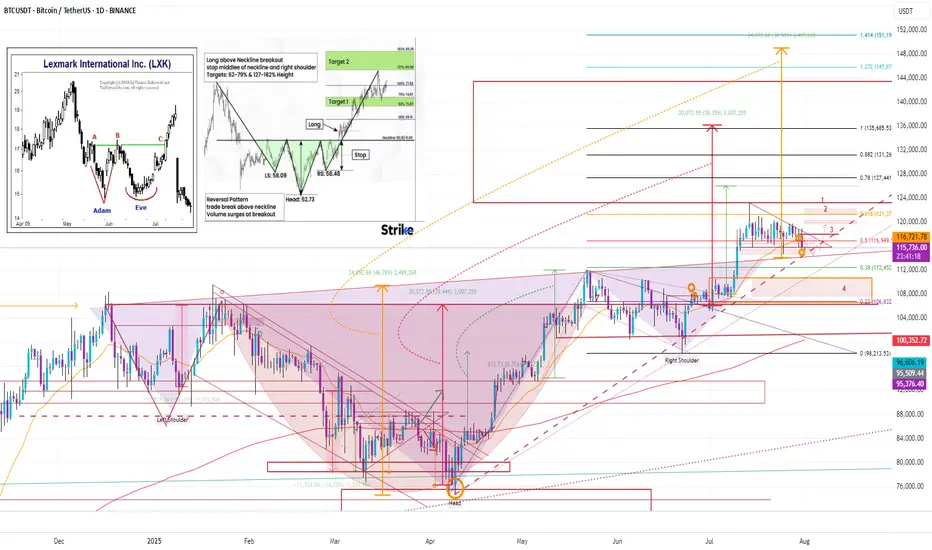
This is why I firmly believe we'll witness BTC reach 150K soon.No caption needed and every reasons are kept in the chart. Zoom In and analyze every single lines in the chart and hope you will see what I tend to see as far as my capabilities allows me. Let me know your comments on the idea. I am looking forward to witness $150K in the next 3 to 4 months time. I will be updating my confluences to say this on higher timeframes too.
With Regards. And stay Tuned.
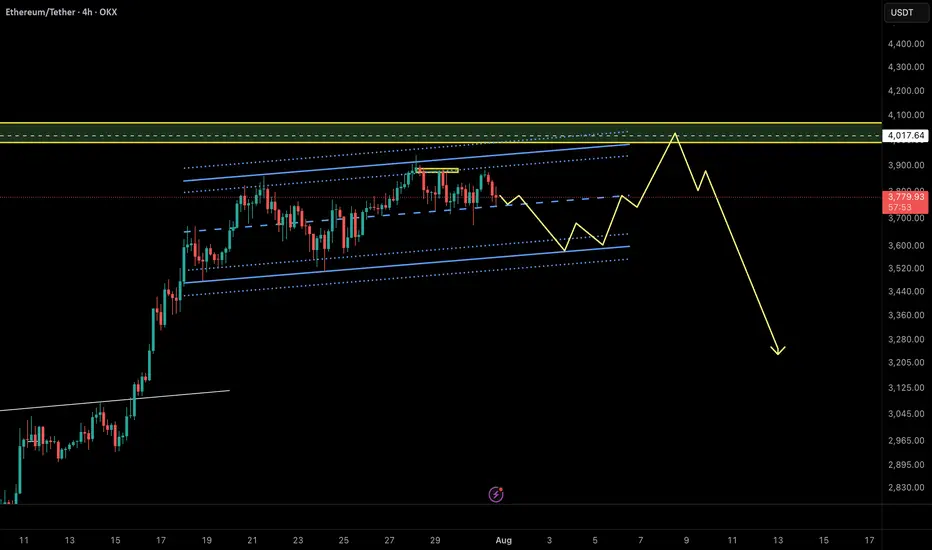
Ethereum Quick Outlook – Potential Trap Before Drop?ETH is moving within a rising channel, but momentum is fading. Price failed to break above the midline and is now testing lower support.
A fakeout to the upside toward the $4,015–$4,050 supply zone is possible before a deeper drop. The projected path suggests a short-term bounce, final liquidity sweep, then potential reversal.
🟡 Key Resistance: $4,015
🔻 Breakdown trigger: Below $3,620
🎯 Bearish Targets: $3,250 → $3,100
Structure hints at a possible Ending Diagonal (Neowave), or a Trap-Wave E inside a Complex Correction.
⚠️ Watch for manipulation near highs – confirmation needed for short entry.