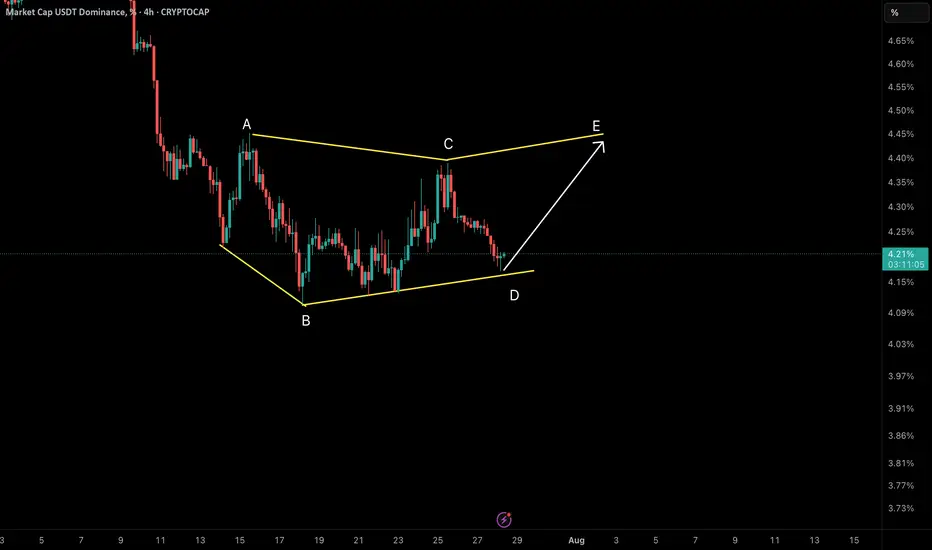
NeoWave Analysis – USDT Dominance (4H Timeframe)We are currently observing a Symmetrical Diametric correction pattern unfolding in the USDT Dominance chart. The wave structure labeled A–B–C–D–E shows clear evidence of this complex formation.
✅ Reasons for Diametric Labeling:
• Wave A and B initiated the pattern with a sharp drop (A), followed by wave B extending lower than A’s starting point – an early sign of a non-classical corrective structure.
• Waves C and D developed with alternating strength and duration, reflecting the expanding and contracting rhythm typical of diametric formations.
• Time and Price Alternation between segments is clearly visible, especially the extended duration between waves B and D compared to the earlier legs.
• The current price action is sitting right at the D wave bottom, which acts as a key structural support zone.
🔄 What’s Next?
• From this support, we expect wave E to initiate. In symmetrical diametrics, wave E typically reaches or slightly exceeds the top of wave C.
• A break below the D wave low doesn’t immediately invalidate the diametric scenario but may call for a re-evaluation toward an Expanded or Terminal Diametric.
• Confirmation of wave E may come with a bullish BOS (Break of Structure) on lower timeframes.
📌 Conclusion: We are likely at the early stage of wave E. If this interpretation holds, a bullish move should develop soon.
📡 Analysis by CryptoPilot – navigating the market with precision.
#CryptoPilot #USDT.D #Elliot #NeoWave #MarketStructure #TrendChannel #BOS #Altcoins #CryptoTrading
Wave Analysis
Wif 10-20% up this week?I am looking to grow my spot with a 10-20% move on wif this week if it takes the external liquidity.
I took a position on yesterday when it traded at the equilibrium of the 2 day range
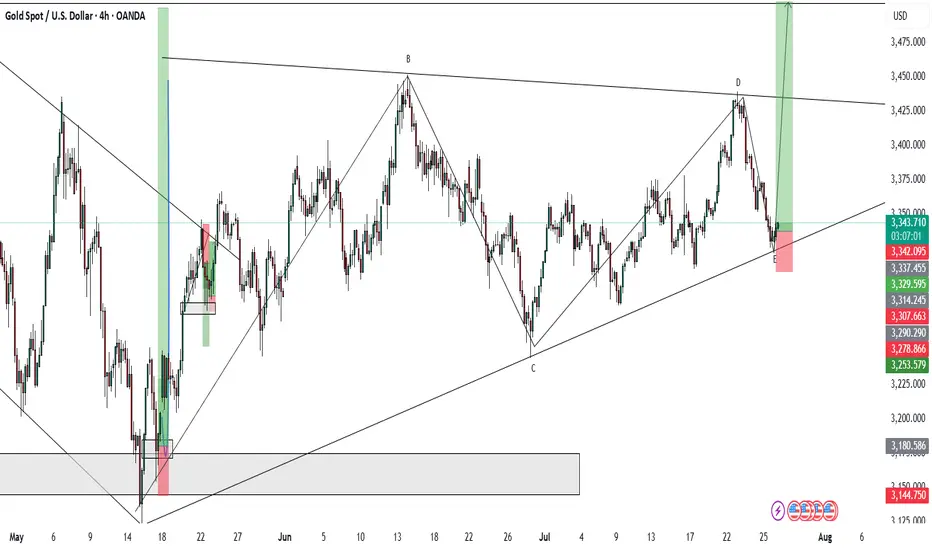
Elliott waveAccording to the bearish structure, the ABC wave is completed, there are 5 more bearish waves.
Sell 3334, stoplos 3344, tp 3310

EURUSD - Break of support?In this moment we have a potential distribution of volume with a potential break of dinamic support we can have a deep rebound until area 1.14

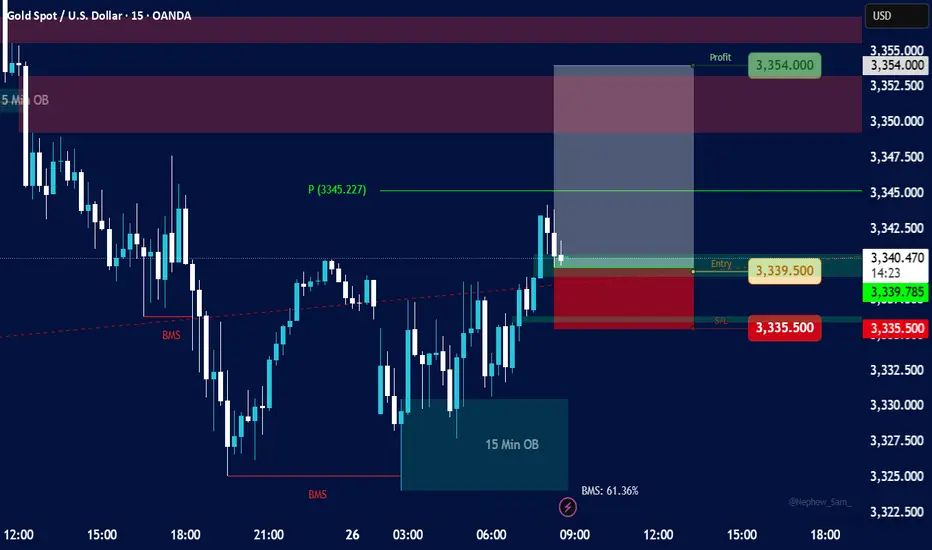
15-minute timeframe for XAU/USDKey Elements and Observations:
Price Action:
The price initially shows a downtrend, breaking below a previous low, indicated by "BMS" (likely "Break in Market Structure" or "Break of Market Structure").
Following the break, the price consolidates and then shows a strong upward movement, breaking above a resistance level, again marked by "BMS." This suggests a potential shift in momentum from bearish to bullish.
Order Blocks (OB):
5 Min OB (Blue Box, Top Left): There's a "5 Min OB" marked at a higher price level earlier in the chart. This represents a bearish order block, where significant selling pressure was previously observed.
15 Min OB (Teal Box, Bottom Right): A "15 Min OB" is identified at a lower price level (around 3326.00 - 3330.00). This is likely a bullish order block, indicating an area where institutions or large players placed buy orders, leading to a bounce in price.
Break in Market Structure (BMS):
Two "BMS" labels are visible:
The first BMS (red dashed line below 3330.00) indicates a break of a support level during the downtrend.
The second BMS (red dashed line above 3330.00) indicates a break of a resistance level during the subsequent uptrend, confirming a potential shift in market bias to bullish.
Entry, Stop Loss, and Take Profit (Trade Setup):
Entry (Green Line): The suggested entry point for a long (buy) position is at approximately 3339.50. This entry aligns with a retest of a previous resistance level that has now turned into support, or potentially the lower boundary of a small bullish order block or fair value gap.
Stop Loss (Red Line/Red Box): The stop loss is set at 3335.50. This is placed below a recent low or significant support level, specifically within a red-shaded area that likely represents a "Supply/Demand" zone or an area where the trade would be invalidated.
Take Profit (Green Line/Green Box): The take profit target is 3354.00, resulting in a "Profit" of 3354.00. This target is placed at a significant resistance level or an area where price might reverse. The white shaded box above the entry, extending to the take profit, highlights the potential profit zone.
Risk-Reward Ratio: While not explicitly calculated, the visual representation suggests a favorable risk-reward, with the potential profit (green box) appearing larger than the potential loss (red box).
Pivot Point (P):
A "P (3345.227)" is marked on the chart, likely indicating a pivot point, which can act as a dynamic support or resistance level. The current price is trading above this pivot point, further supporting a bullish bias.
"BMS: 61.36%" (Bottom Right):
This percentage likely refers to a "Break in Market Structure" metric or a specific trading indicator that quantifies the strength or probability of the market structure shift. 61.36% suggests a reasonably strong confirmation.
Implied Trading Strategy:
The chart depicts a bullish reversal strategy, likely based on "Smart Money Concepts" or "ICT" (Inner Circle Trader) principles. The strategy involves:
Identifying a shift in market structure: Price breaking highs after breaking lows, signaling a change from bearish to bullish.
Utilizing Order Blocks: Using the 15 Min OB as a foundational support level and potentially looking for entry confirmations around it.
Waiting for a Retest/Pullback: The entry around 3339.50 suggests waiting for a pullback after the initial bullish impulse. This could be a retest of a broken resistance level, a fair value gap (FVG), or a small bullish order block within the larger 15 Min OB.
Placing Stop Loss Strategically: Below a significant low or invalidation point.
Targeting Previous Highs/Resistance: Setting the take profit at a logical resistance level where previous selling pressure was observed.
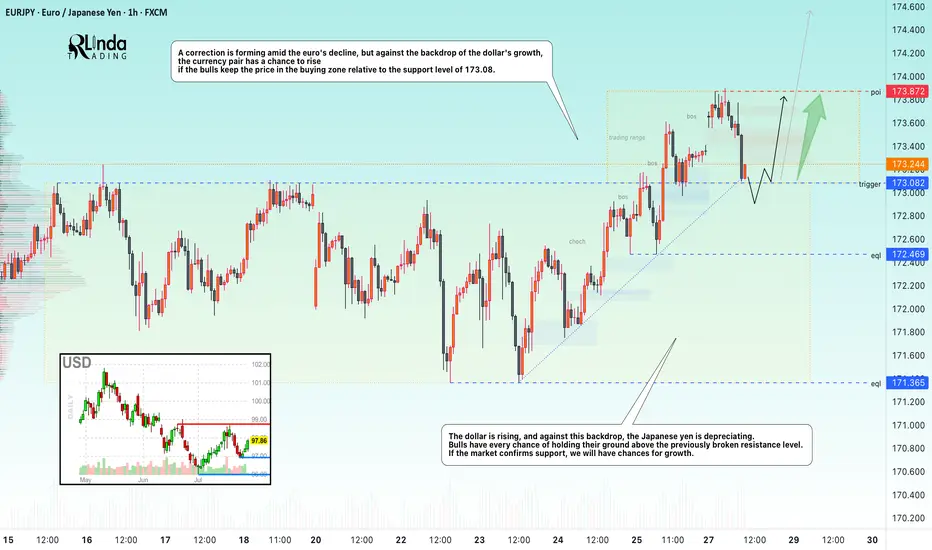
EURJPY → Retest support before growthFX:EURJPY has been correcting since the opening of the European session. The movement was triggered by yesterday's news related to the trade deal between the US and Europe...
EURJPY is reacting to news related to the deal between the US and Europe. A correction is forming amid the fall of the euro, but against the backdrop of the dollar's growth, the currency pair has a chance to rise if the bulls keep the price in the buying zone relative to the support level of 173.08.
The dollar is rising, and against this backdrop, the Japanese yen is falling. Bulls have every chance of holding their ground above the previously broken resistance. If the market confirms support, we will have chances for growth.
Resistance levels: 173.87
Support levels: 173.082, 172.47
The currency pair may form a liquidity trap relative to the previously broken consolidation resistance. A false breakdown of support and price consolidation in the buying zone (above 173.1) could trigger further growth.
Best regards, R. Linda!
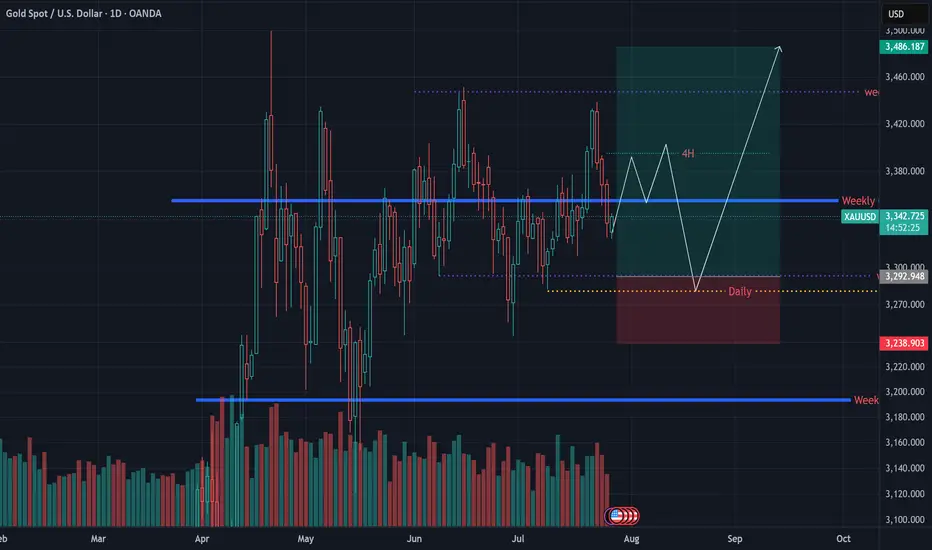
Gold (XAU/USD) Daily Trading Plan - 28th July 2025🔺 Technical Analysis
Gold opened the Asian session this week with a slight retracement, testing the 0.382 Fibonacci Retracement level before bouncing back strongly to last week's closing price around 3339. This move further solidifies the price action from a technical perspective.
Notably, gold has broken through a minor resistance on the M15 timeframe, invalidating the bearish structure and forming a full-bodied H1 candle. This sets the stage for a potential corrective uptrend to unfold.
On the Daily timeframe, the initial session's decline retested the bullish trendline and bounced back within the boundaries of the flag pattern. It's likely that this week, the price will continue towards the end of this pattern, providing a clearer confirmation of the medium-term trend.
🔺 Key Macroeconomic News
This week promises to be volatile with several crucial economic announcements, particularly as it marks both the end of the month and the start of a new one. Two key events that traders should pay close attention to are:
FOMC Interest Rate Decision: Always a focal point for the market, with significant impact on safe-haven assets like gold.
Non-Farm Payroll (NFP) Report: Vital US labour market data, capable of triggering substantial movements in both the USD and gold.
Therefore, be prepared for potential market shocks and exercise careful risk management.
📈 Trading Strategy & Considerations
Given the technical setup and upcoming macroeconomic events, consider the following:
Potential Corrective Uptrend: The invalidated bearish structure on M15 and the strong H1 candle suggest a short-term bullish bias for a corrective move.
Daily Flag Pattern: Monitor price action as it approaches the end of the flag pattern on the Daily timeframe for medium-term trend confirmation.
High Volatility Ahead: Exercise extreme caution around the FOMC and NFP announcements. These events can lead to significant and rapid price swings.
Risk Management: Prioritise strict risk management. Consider reducing position sizes or employing wider stop-losses during high-impact news events.
Disclaimer: This analysis is for informational purposes only and does not constitute financial advice. Trading involves significant risk, and you should only trade with capital you can afford to lose.

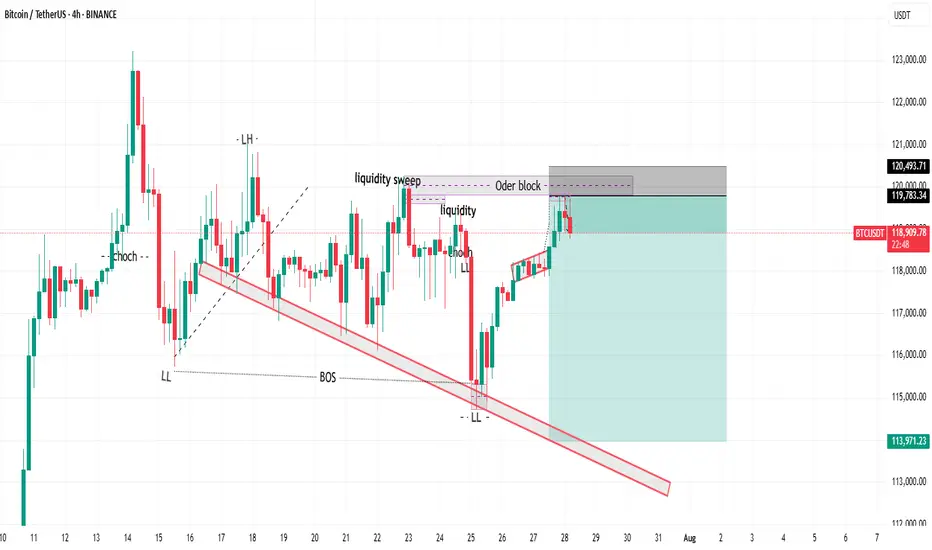
BTCUSD sell "I had posted it before as well, but it got hiddenAnalyzing market structure and liquidity using Price Action and Smart Money Concepts. Focused on key supply/demand zones and institutional order flow
Daily outlook 7-28-25Daily outlook 7-28-25 - in this outlook i will tel my friend what i am gonna trade for today.

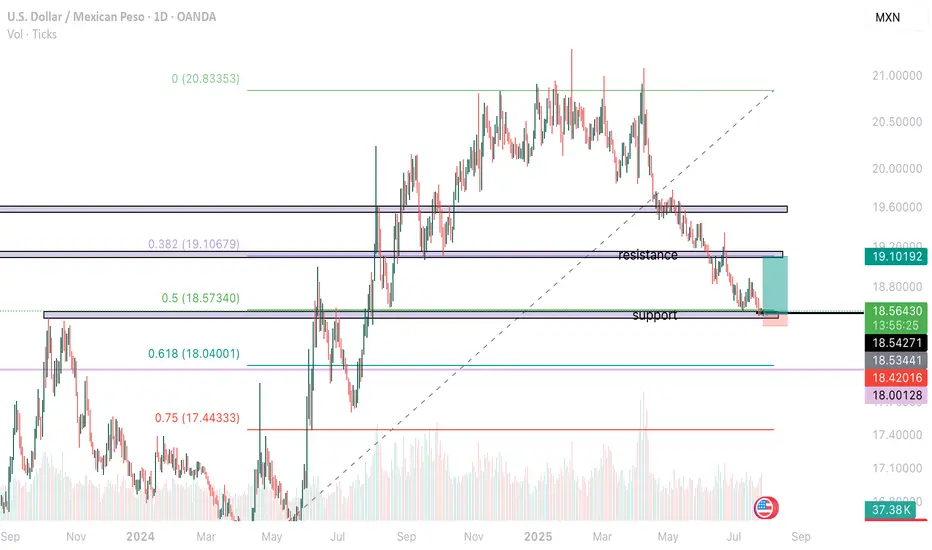
USD PESO- Support, Fib and other reasons LONGHello fellow traders!
Good news! good NEWS GOOOOOOD News for USA! here is the idea- support holding hence going for the 19.10-19.11 level of resistance Aldo the drop of the price seen well on a weekly/monthly chart hit the 0.5 fibs normally being reaction level and with a new trades and America is great again - my position, but please don't copy only if you made your own mind- this is just an idea not a trading advise! And when trading- have a s/l that won't blow your account, good luck!
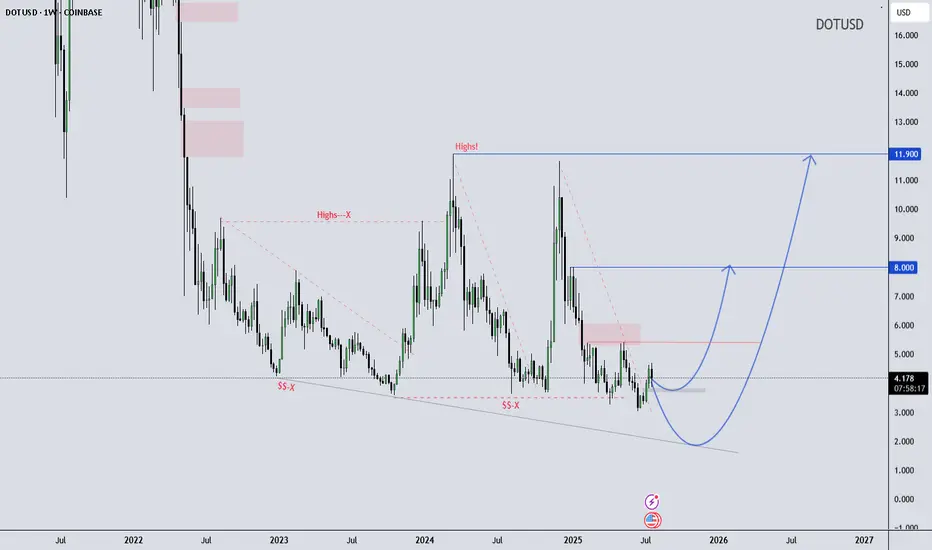
DOT/USD Weekly Structure - - Reversal Possibility Developing DOT/USD Weekly Outlook – Educational Perspective
Polkadot (DOT) is trading near the lower boundary of a long-term falling wedge structure, showing early signs of stabilization around the $4.20 support zone. Price has respected this level multiple times, potentially forming a rounded bottom, which often suggests shifting momentum.
If the structure holds, it may continue developing a macro reversal pattern. This kind of formation is typically monitored by swing traders looking for high risk-reward setups in longer timeframes.
Key Technical Levels to Watch:
$8.00 – Mid-range structural resistance
$11.90 – Historical supply / macro pivot zone
This chart is shared for educational purposes only to support market structure learning. Always follow your own analysis and risk management plan.
Wave Trader Pro
Learn & Earn
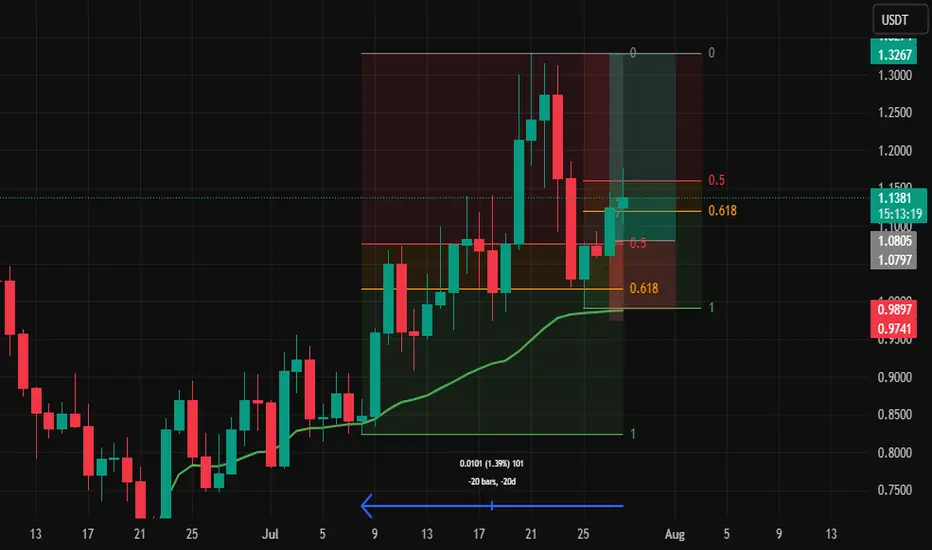
Bitcoin Cash cup and handle 2000% trade!!It could be bitcoin cash is making a cup and handle pattern. If it plays out it should stay above 0.5 fib and target the 2 fib. Crazy 2000%

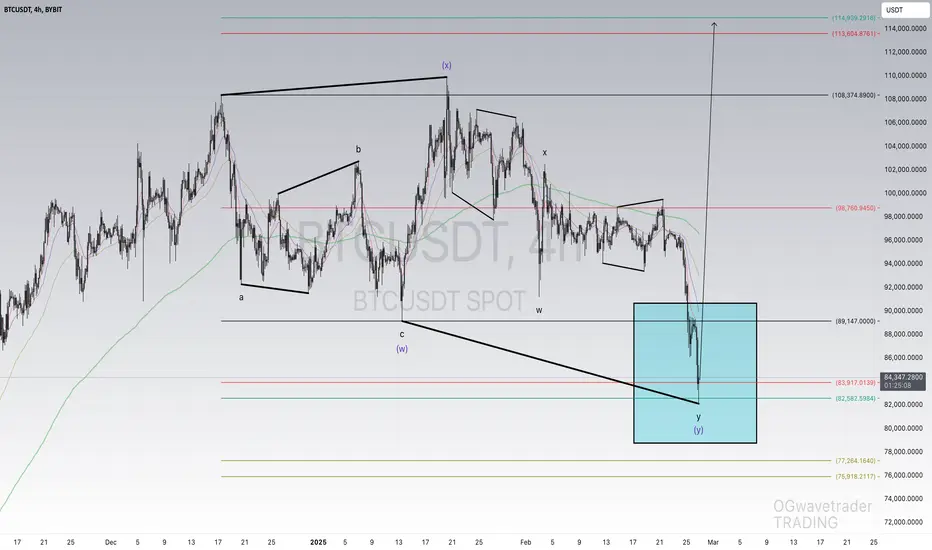
BTCUSDT NEXT Impulse !Hi fellow traders, BTCUSD will be ready to make a move higher from the blue box after it completes the expanding flat pattern in a WXY formation. Target will be 113604.87 USD. Good luck and trade safe!
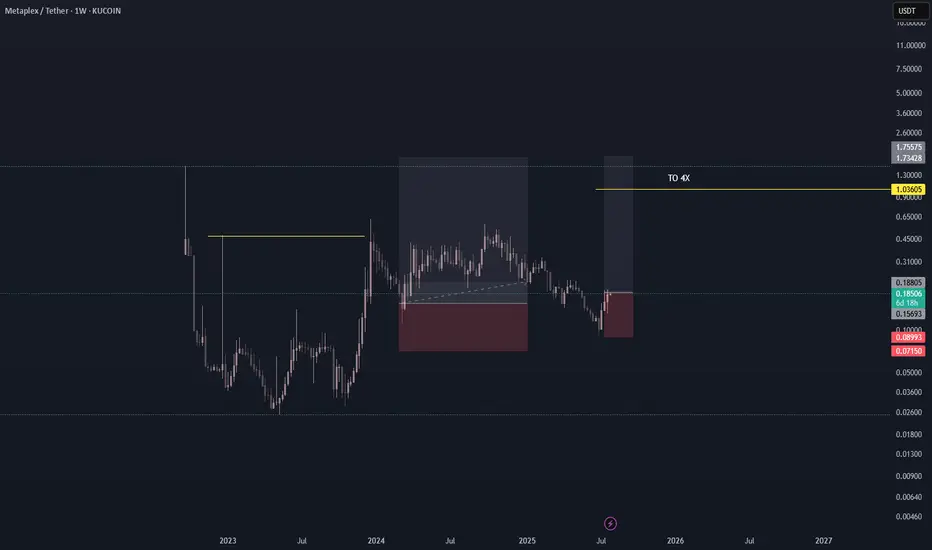
METAPLX/USDT BUY LONG FOR 4XCRYPTO - METAPLEX/USDT
EXPECTED RETURN TO 400-500%
** Crypto investing is highly volatile, you may lose all invested money, please keep it in mind and invest what you can lose and be ok.**
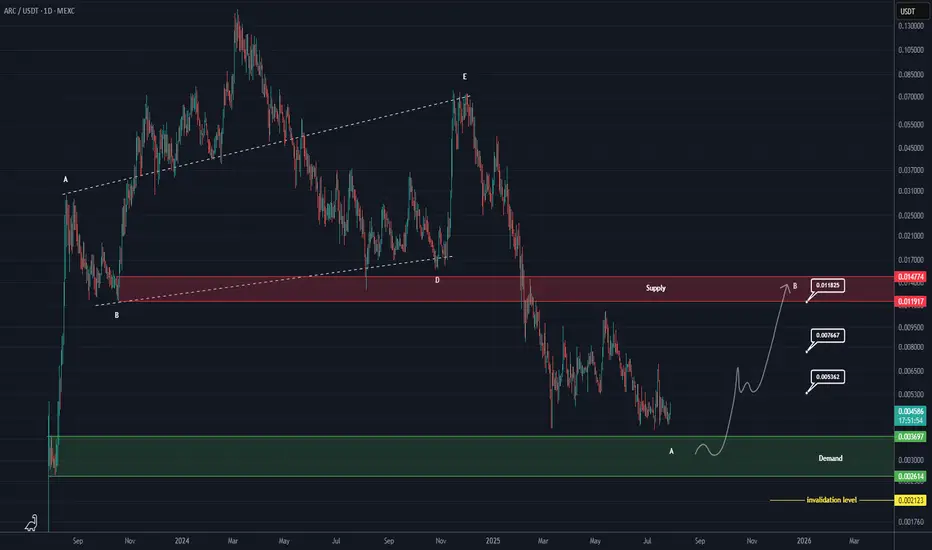
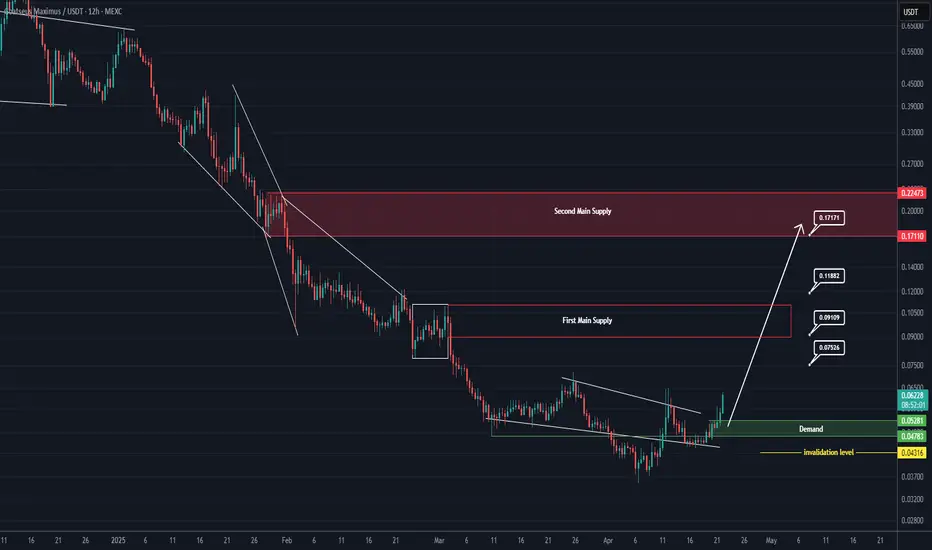
ARC Buy/Lonf Setup (1D)The ARC symbol, after completing a triangle and undergoing significant price and time correction, is approaching a strong and important origin.
It is expected that upon reaching the green zone, it will move toward the specified targets.
Since trading this symbol carries its own risks, make sure to practice proper risk management.
The targets are marked on the chart.
A daily candle closing below the invalidation level will invalidate this analysis.
For risk management, please don't forget stop loss and capital management
When we reach the first target, save some profit and then change the stop to entry
Comment if you have any questions
Thank You
XAUUSD Analysis – July 27, 2025Last week, we marked the 3320–3330 zone as a potential buy-entry area. However, mid-term order flow pushed price above 3400 before reaching that level.
Toward the end of the week, a sell-off slightly weakened buyer confidence, and we now anticipate more cautious re-entries around the 3300–3290 region.
📈 The broader trend remains bullish for mid and long-term traders.
For scalpers trading against the trend, we recommend sticking to minor bearish pullbacks only, and managing risk tightly.
🔻 The 3390–3400 range offers a potential 300+ pip short opportunity for risk-averse sellers.
🟠 Risk-tolerant traders might consider holding shorts until the 3300 zone is tested.
⚠️ Key Insight: Given the liquidity build-up at 3400, if the price returns to this level, there’s a strong chance we’ll see a breakout above the previous high.
XAG/USD on high time frame
"Hello, for investors in XAG/USD, the $37 zone appears to be a low-risk area for buying. Both technical and fundamental analyses suggest that the price is likely to move higher towards $48."
If you require further insights or have additional information to discuss, feel free to share!

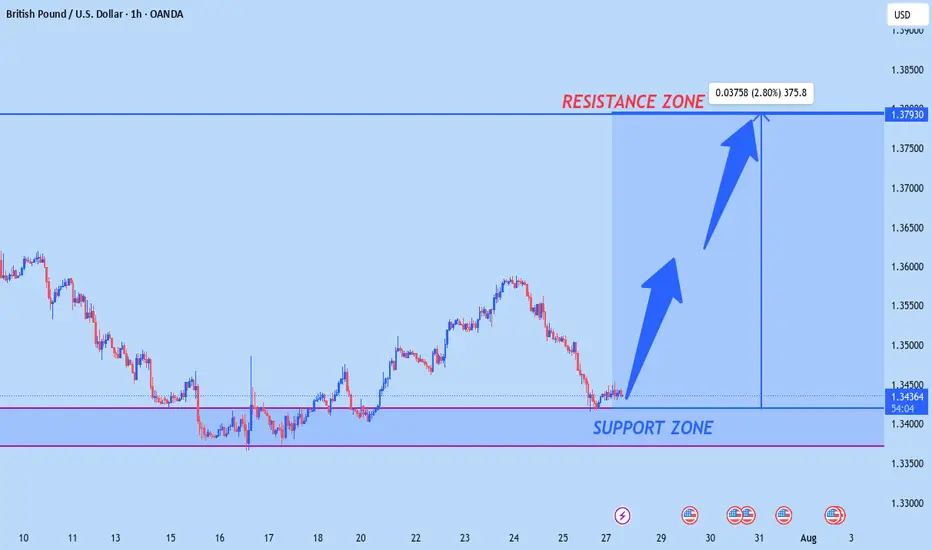
GBPUSD NEW LOOKaccording to H1 analysis GBP market is at support level we have good opportynity
go long from support level
Dont be greedy use money management
TRADE AT YOUR OWN RISK
REGARD ALBERT
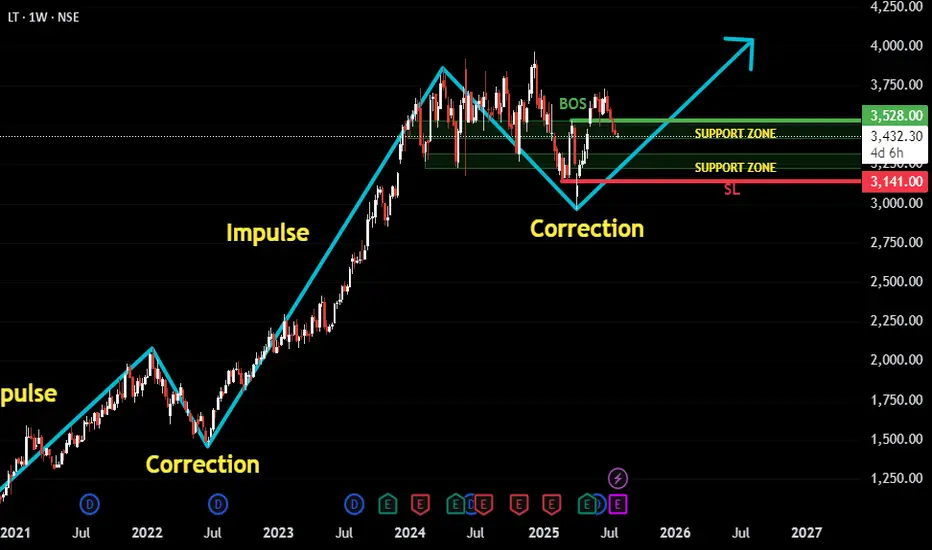
LT Following Classic Impulse-Correction Rhythm.This is a trend-following setup on LT (Larsen & Toubro) where we’ve observed a clear repeating pattern of Impulse → Correction → Impulse. The recent price action suggests that the latest correction has matured, and the structure now hints at a potential next impulse wave beginning.
Here’s the thought process behind the setup:
✅ The stock has been trending upward in a clean impulse-correction rhythm.
🕒 We waited patiently for the correction phase to develop fully and mature.
🔄 A Break of Structure occurred, signaling potential trend continuation.
🔁 Retest on support zones further strengthens the bullish case.
🧭 Support zones are drawn from the Daily chart for precision, though this post is based on the Weekly timeframe for broader trend visibility.
🛡️ Stop-loss can be maintained near ₹3141, just below key support.
🎯 Target is based on a 1:2 Risk-to-Reward setup, aligning with disciplined trading strategy.
Overall, this is a classic example of waiting for confirmation after correction before re-entering in the direction of the dominant trend.
As always, risk management is key. Watch how price behaves around the recent structure and support zones for validation.
GOAT Looks Bullish (12H)It seems that a wave A of a higher-degree structure has completed, and the price is forming a triangle at the bottom, preparing for an upward movement in the form of either a wave B or a new impulse wave. Since this wave belongs to a higher degree, we expect the upcoming bullish wave to take time and show a significant upward retracement.
Try to avoid entering during pumps, and instead focus on entries during price corrections.
As long as the green zone holds, the price has the potential to move upward.
A daily candle closing below the invalidation level will invalidate this outlook.
For risk management, please don't forget stop loss and capital management
When we reach the first target, save some profit and then change the stop to entry
Comment if you have any questions
Thank You
ALCH Looks Bearish (8H)ALCH is one of the altcoins that began its bullish rally earlier than others.
From the point where we placed the green arrow on the chart, it appears that an ABC correction has completed.
As long as the red box is maintained, price may move toward the FVG zone.
Targets are marked on the chart.
Additionally, a liquidity pool is forming below the candles, which is expected to be swept soon
A daily candle closing above the invalidation level would invalidate this bearish outlook.
For risk management, please don't forget stop loss and capital management
Comment if you have any questions
Thank You

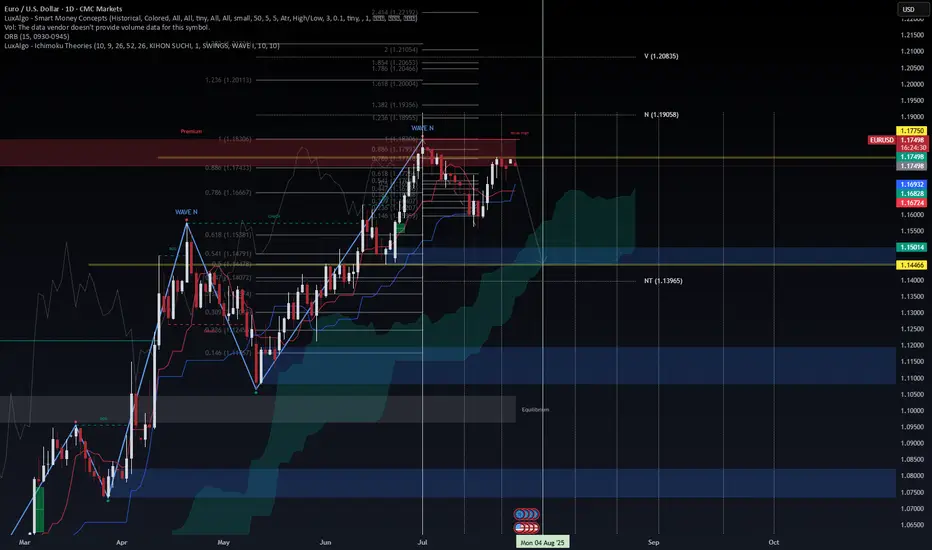
EUR/USD – Testing Premium Zone, ECB & USD Macro Drive Next MoveEUR/USD – Testing Premium Zone, ECB & USD Macro Drive Next Move
EUR/USD is consolidating near 1.1770–1.1780, right inside the premium liquidity zone (0.786–0.886 Fib) and just below the Weak High at 1.1830. This level is critical for the next directional move.
Macro Landscape
ECB paused at 2.0% after eight consecutive cuts but may ease again in late 2025 as inflation trends toward 1.4% (ECB, 2025).
USD remains under pressure on expectations of Fed cuts, high fiscal deficits, and tariff concerns, creating a medium-term bias toward EUR strength (Reuters, 2025).
EU–U.S. trade deal at 15% tariff base reduces downside risks but does not fully remove growth headwinds (OECD, 2025).
Technical Outlook
Key Resistance: 1.1780–1.1830 (premium zone).
Upside Targets: 1.1905 (N) and 1.2085 (V) on breakout.
Support: 1.1680–1.1630 (Cloud/Kijun) and 1.1500 pivot for mean reversion.
VolanX DSS Signal:
Score: 58/100 (Neutral-to-Bullish)
Trend remains constructive but premium levels suggest a possible pullback unless the pair clears 1.1835 with momentum.
Plan:
Watch for a fade setup at 1.178–1.183 with stops >1.184.
A confirmed breakout above 1.1835 opens a run toward 1.19–1.21.
#EURUSD #Forex #MacroStrategy #ECB #CurrencyMarkets #TradingView
For educational purposes only. Not financial advice.